stop wasting mental
capital drawing lines.
50+ indicators that auto-plot your levels, shade your sessions, and help you spot your setups before the open. so when the bell rings, you're already ready.
you're burning mental capital before the session even starts.
by the time you finish drawing your levels, you've already forgotten which ones actually matter.
50+ TradingView indicators
data-backed levels plotted automatically. stop drawing lines on your charts, preserve your mental capital. indicators that do the work for you.
gap analysis
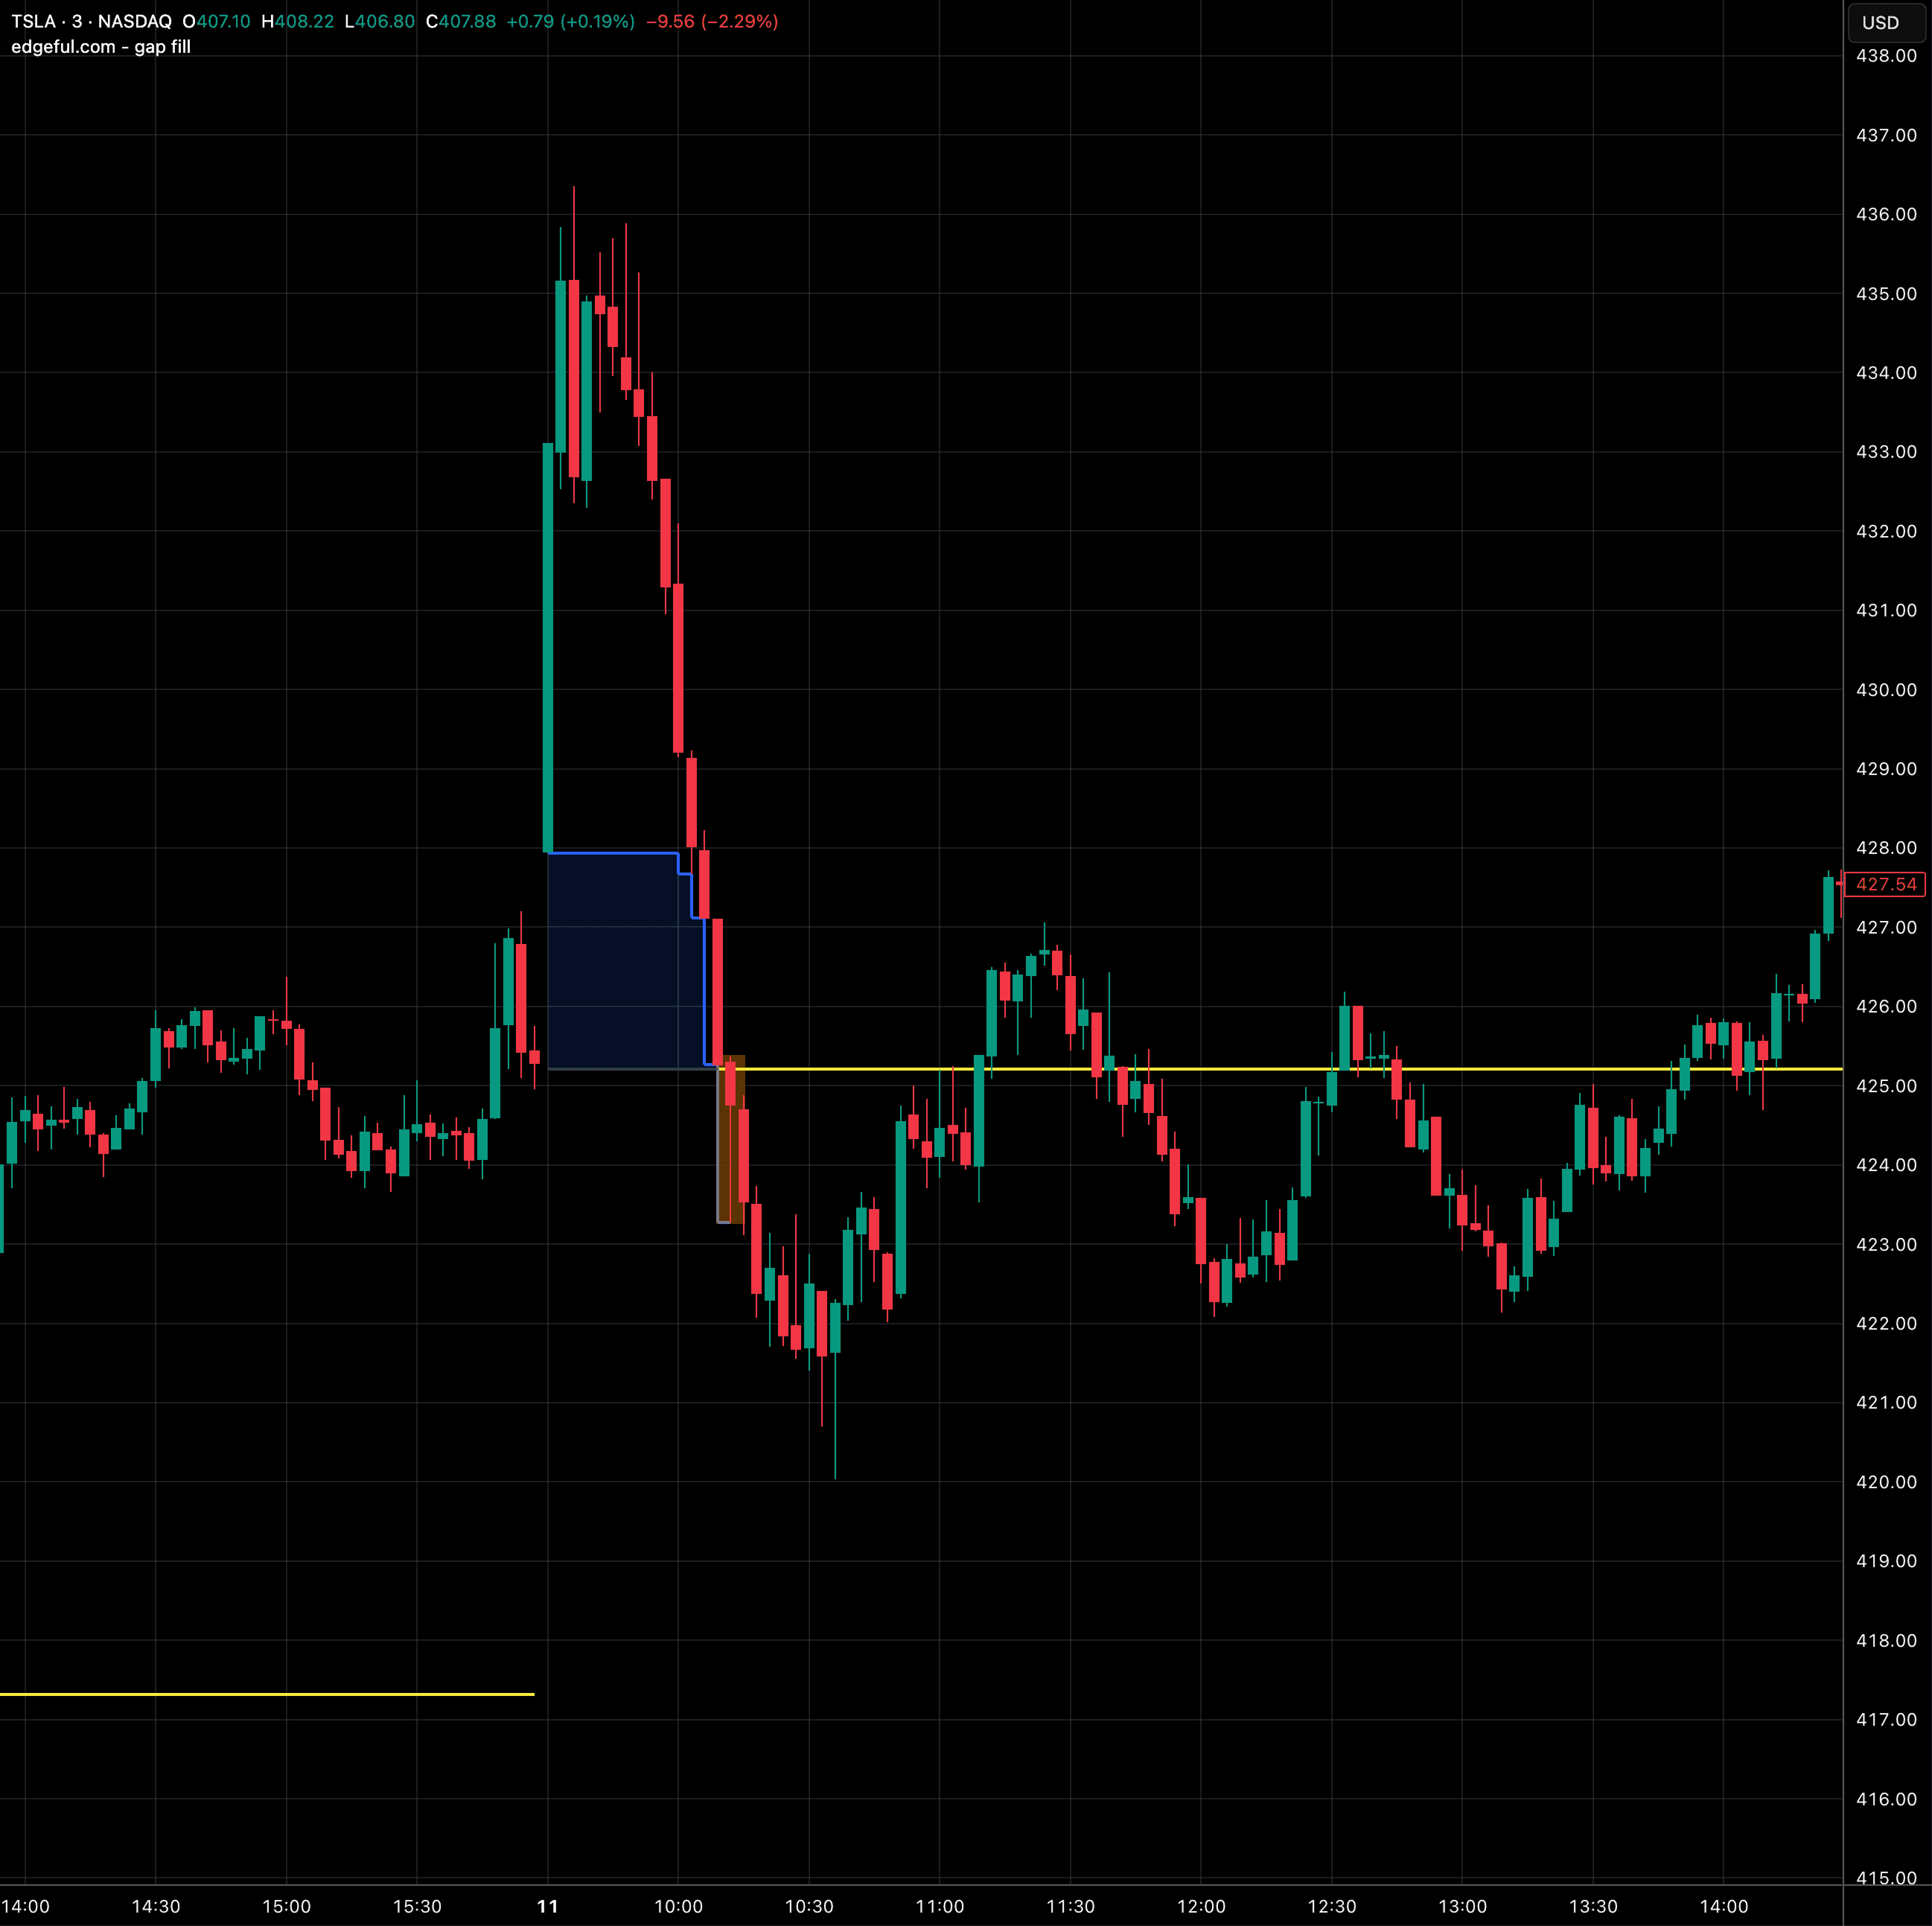
gap fill
auto-detects gap ups and gap downs at market open and tracks when price fills back to the previous session's close.
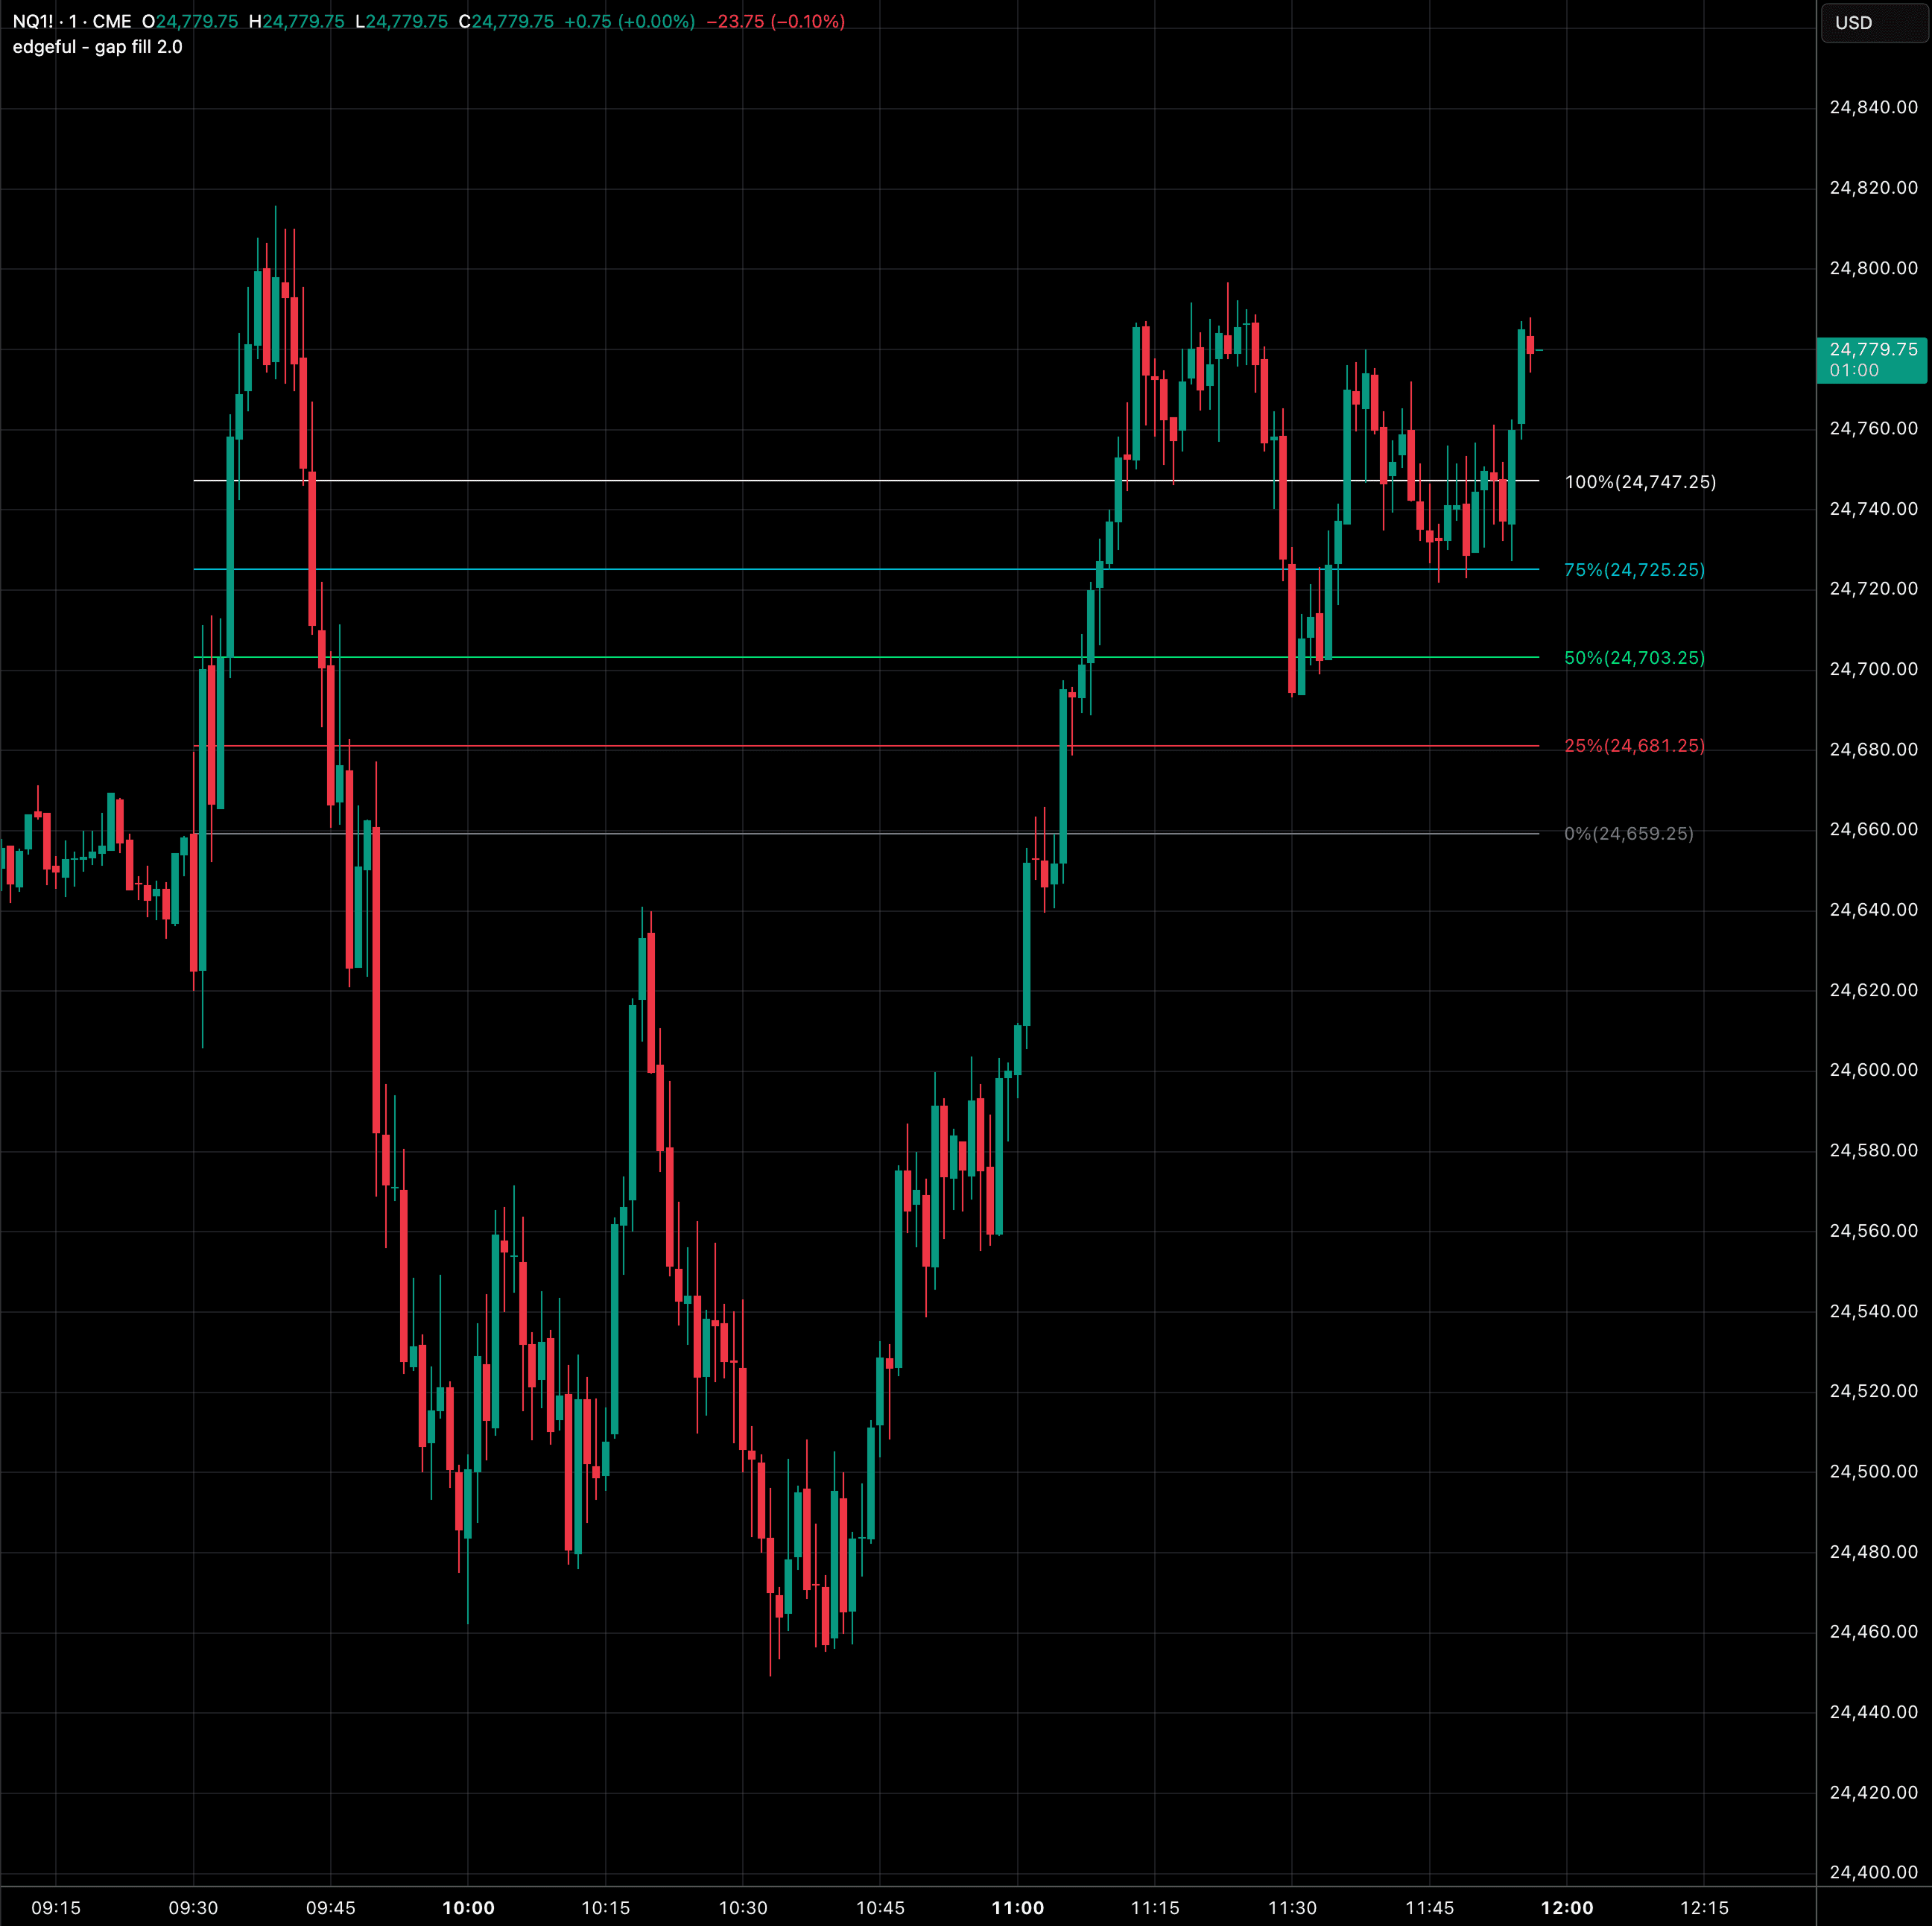
gap fill 2.0
popular
plots retracement levels within the gap zone so you can target entries as price fills back to the previous session's close.
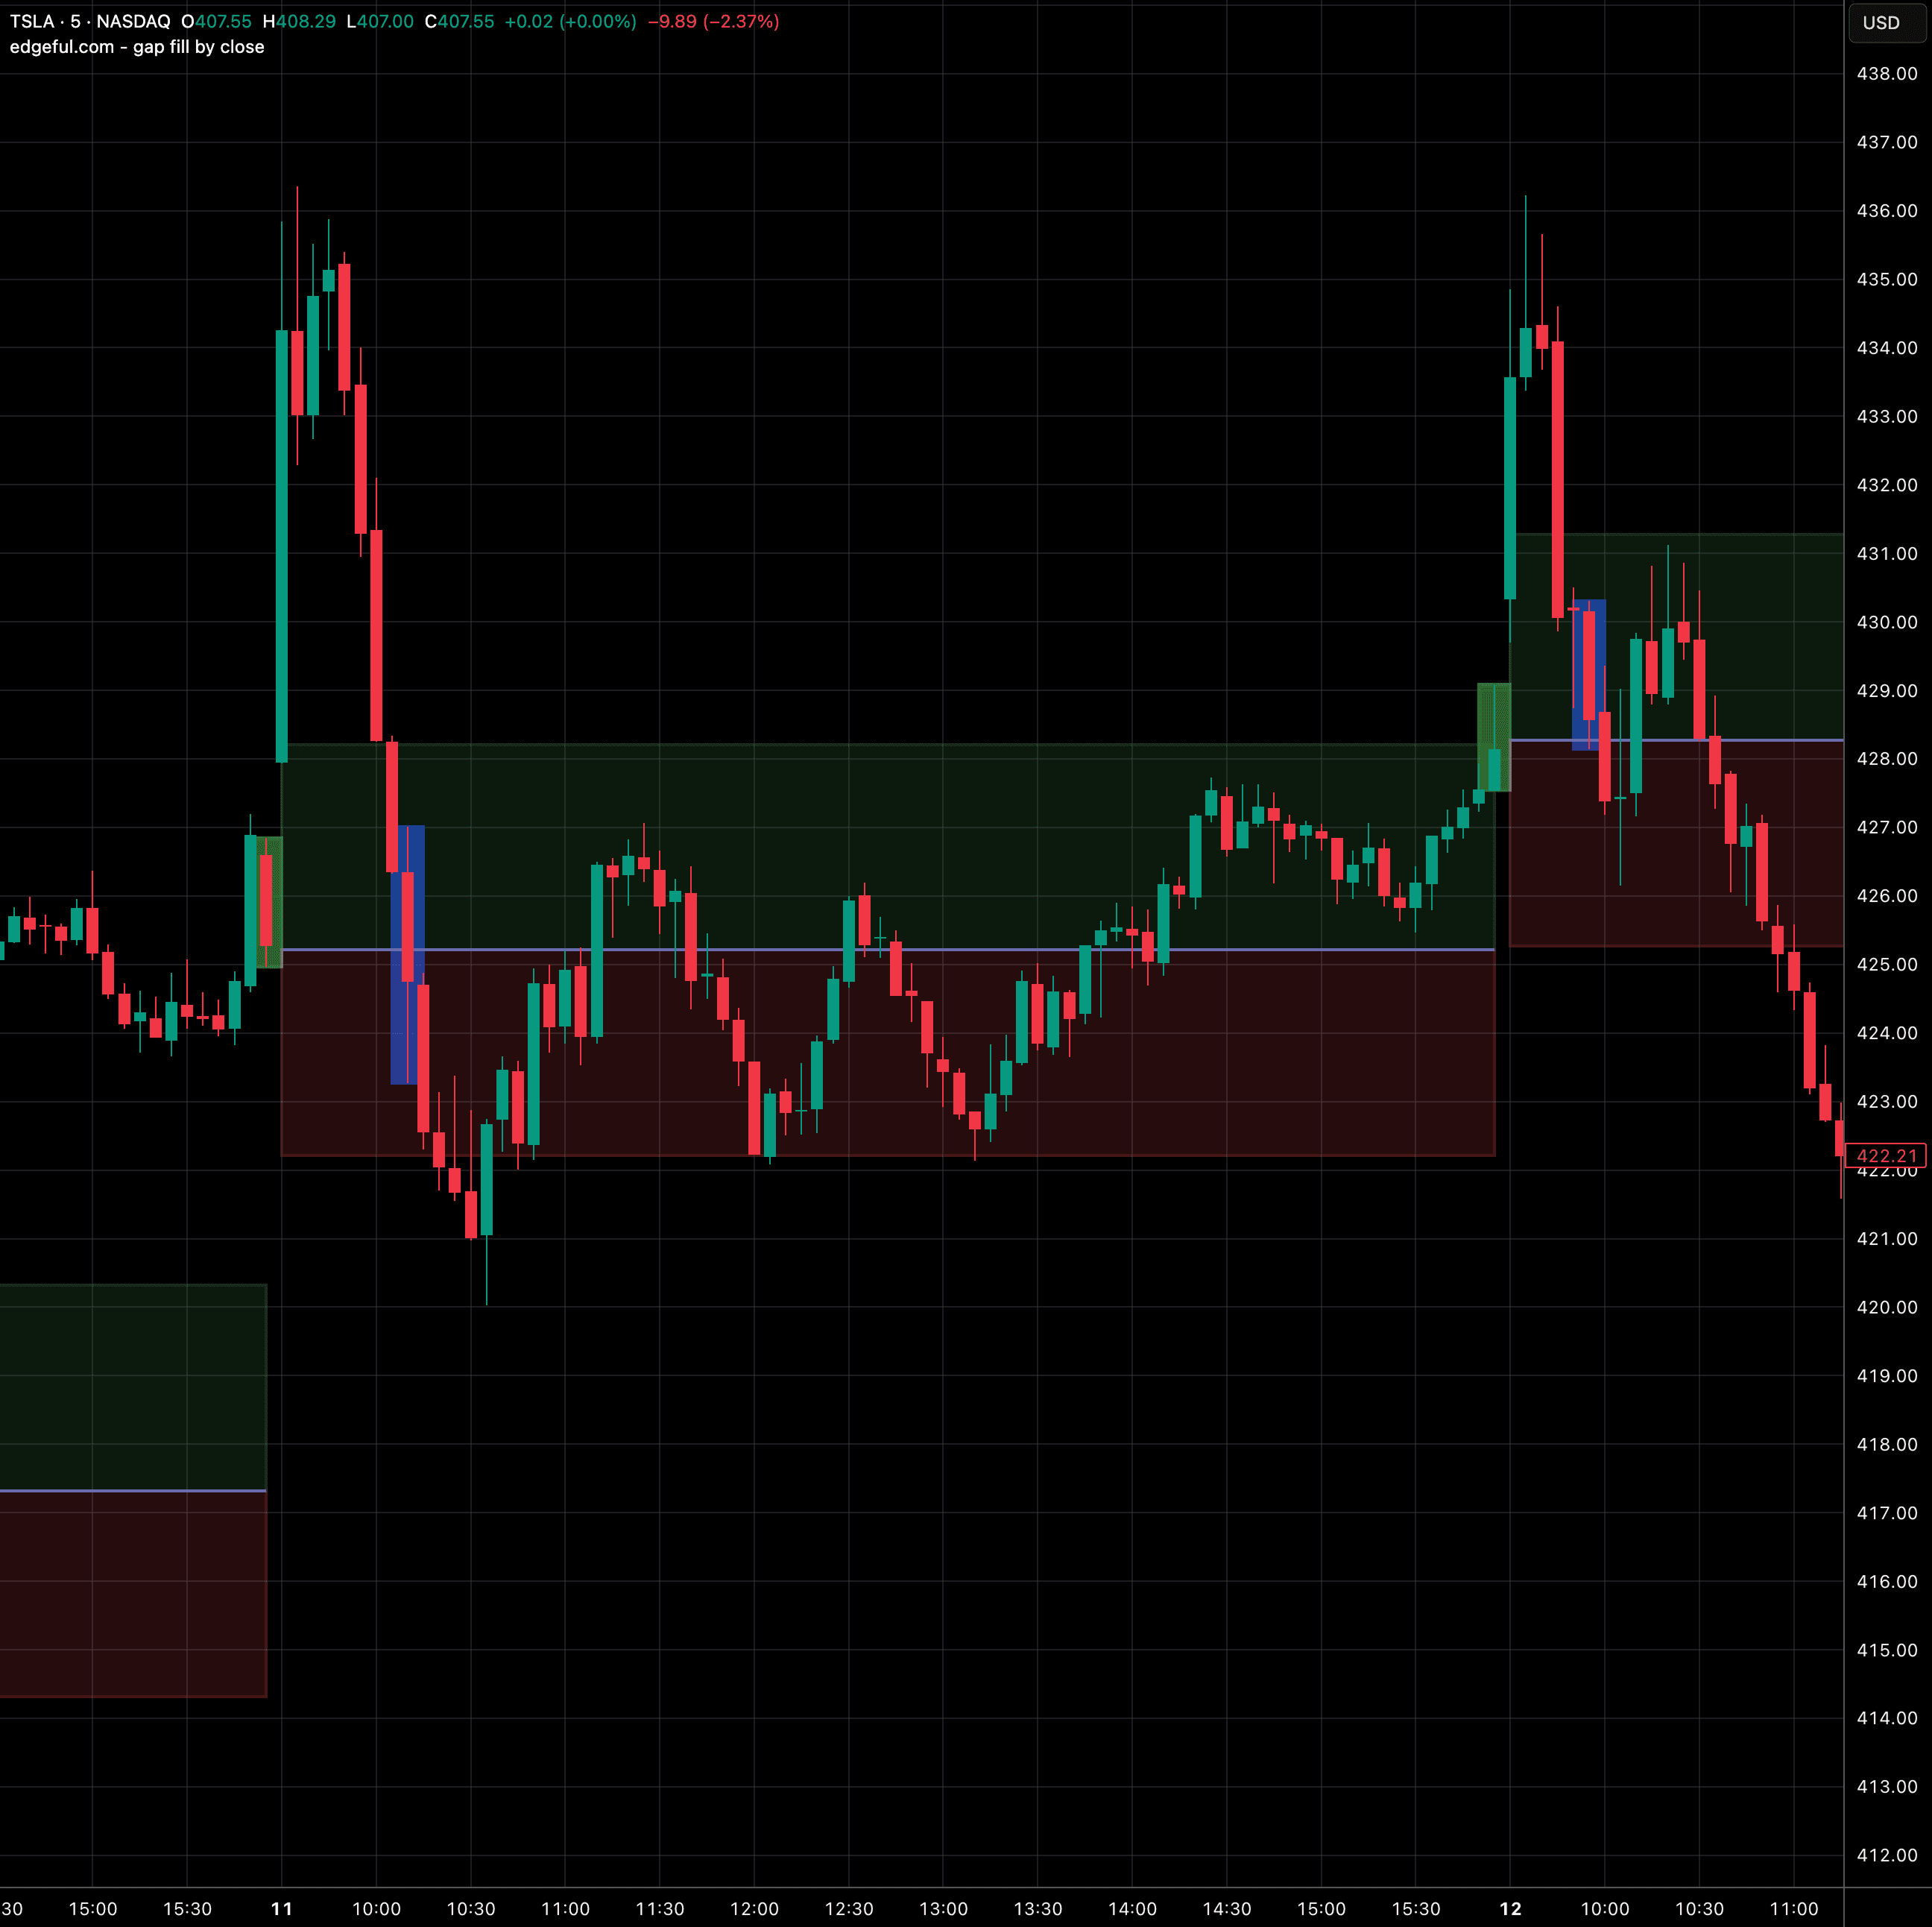
gap fill by close
tracks intraday gap fills and color-codes the closing candle based on whether price finished above or below the prior close.
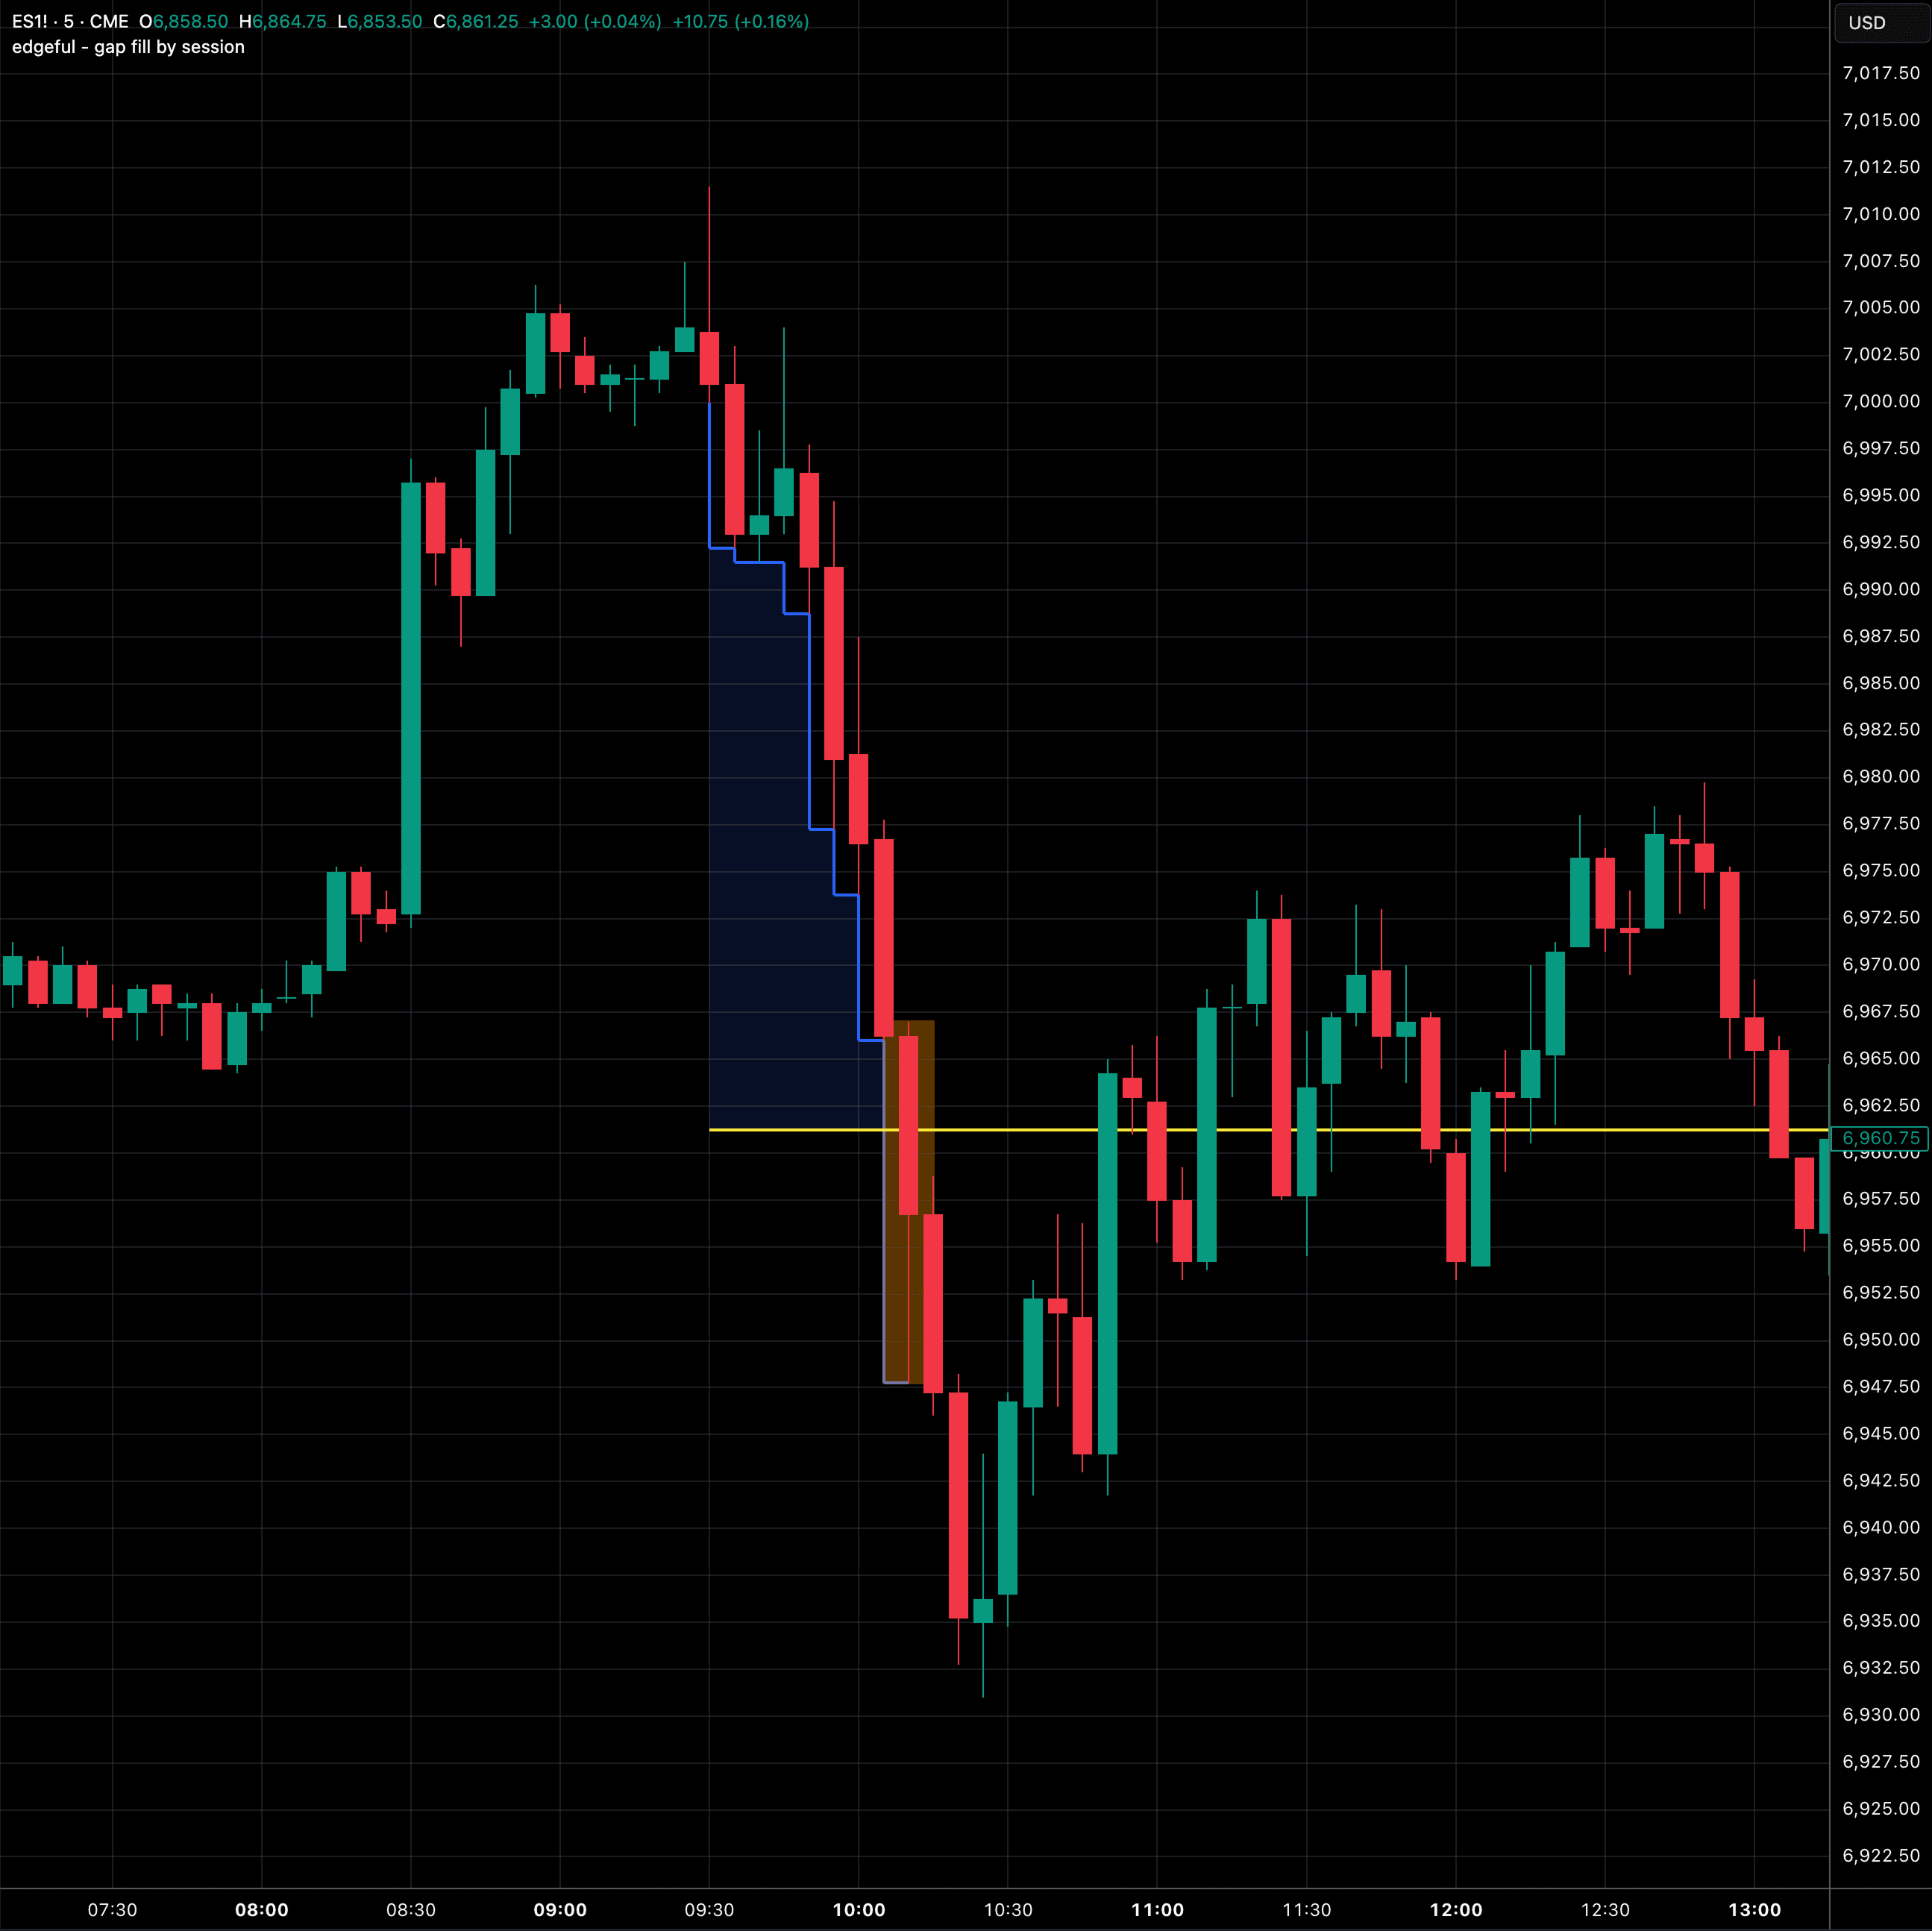
gap fill by session
auto-tracks gap fills using the prior session's close across Tokyo, London, New York, and Sydney sessions.
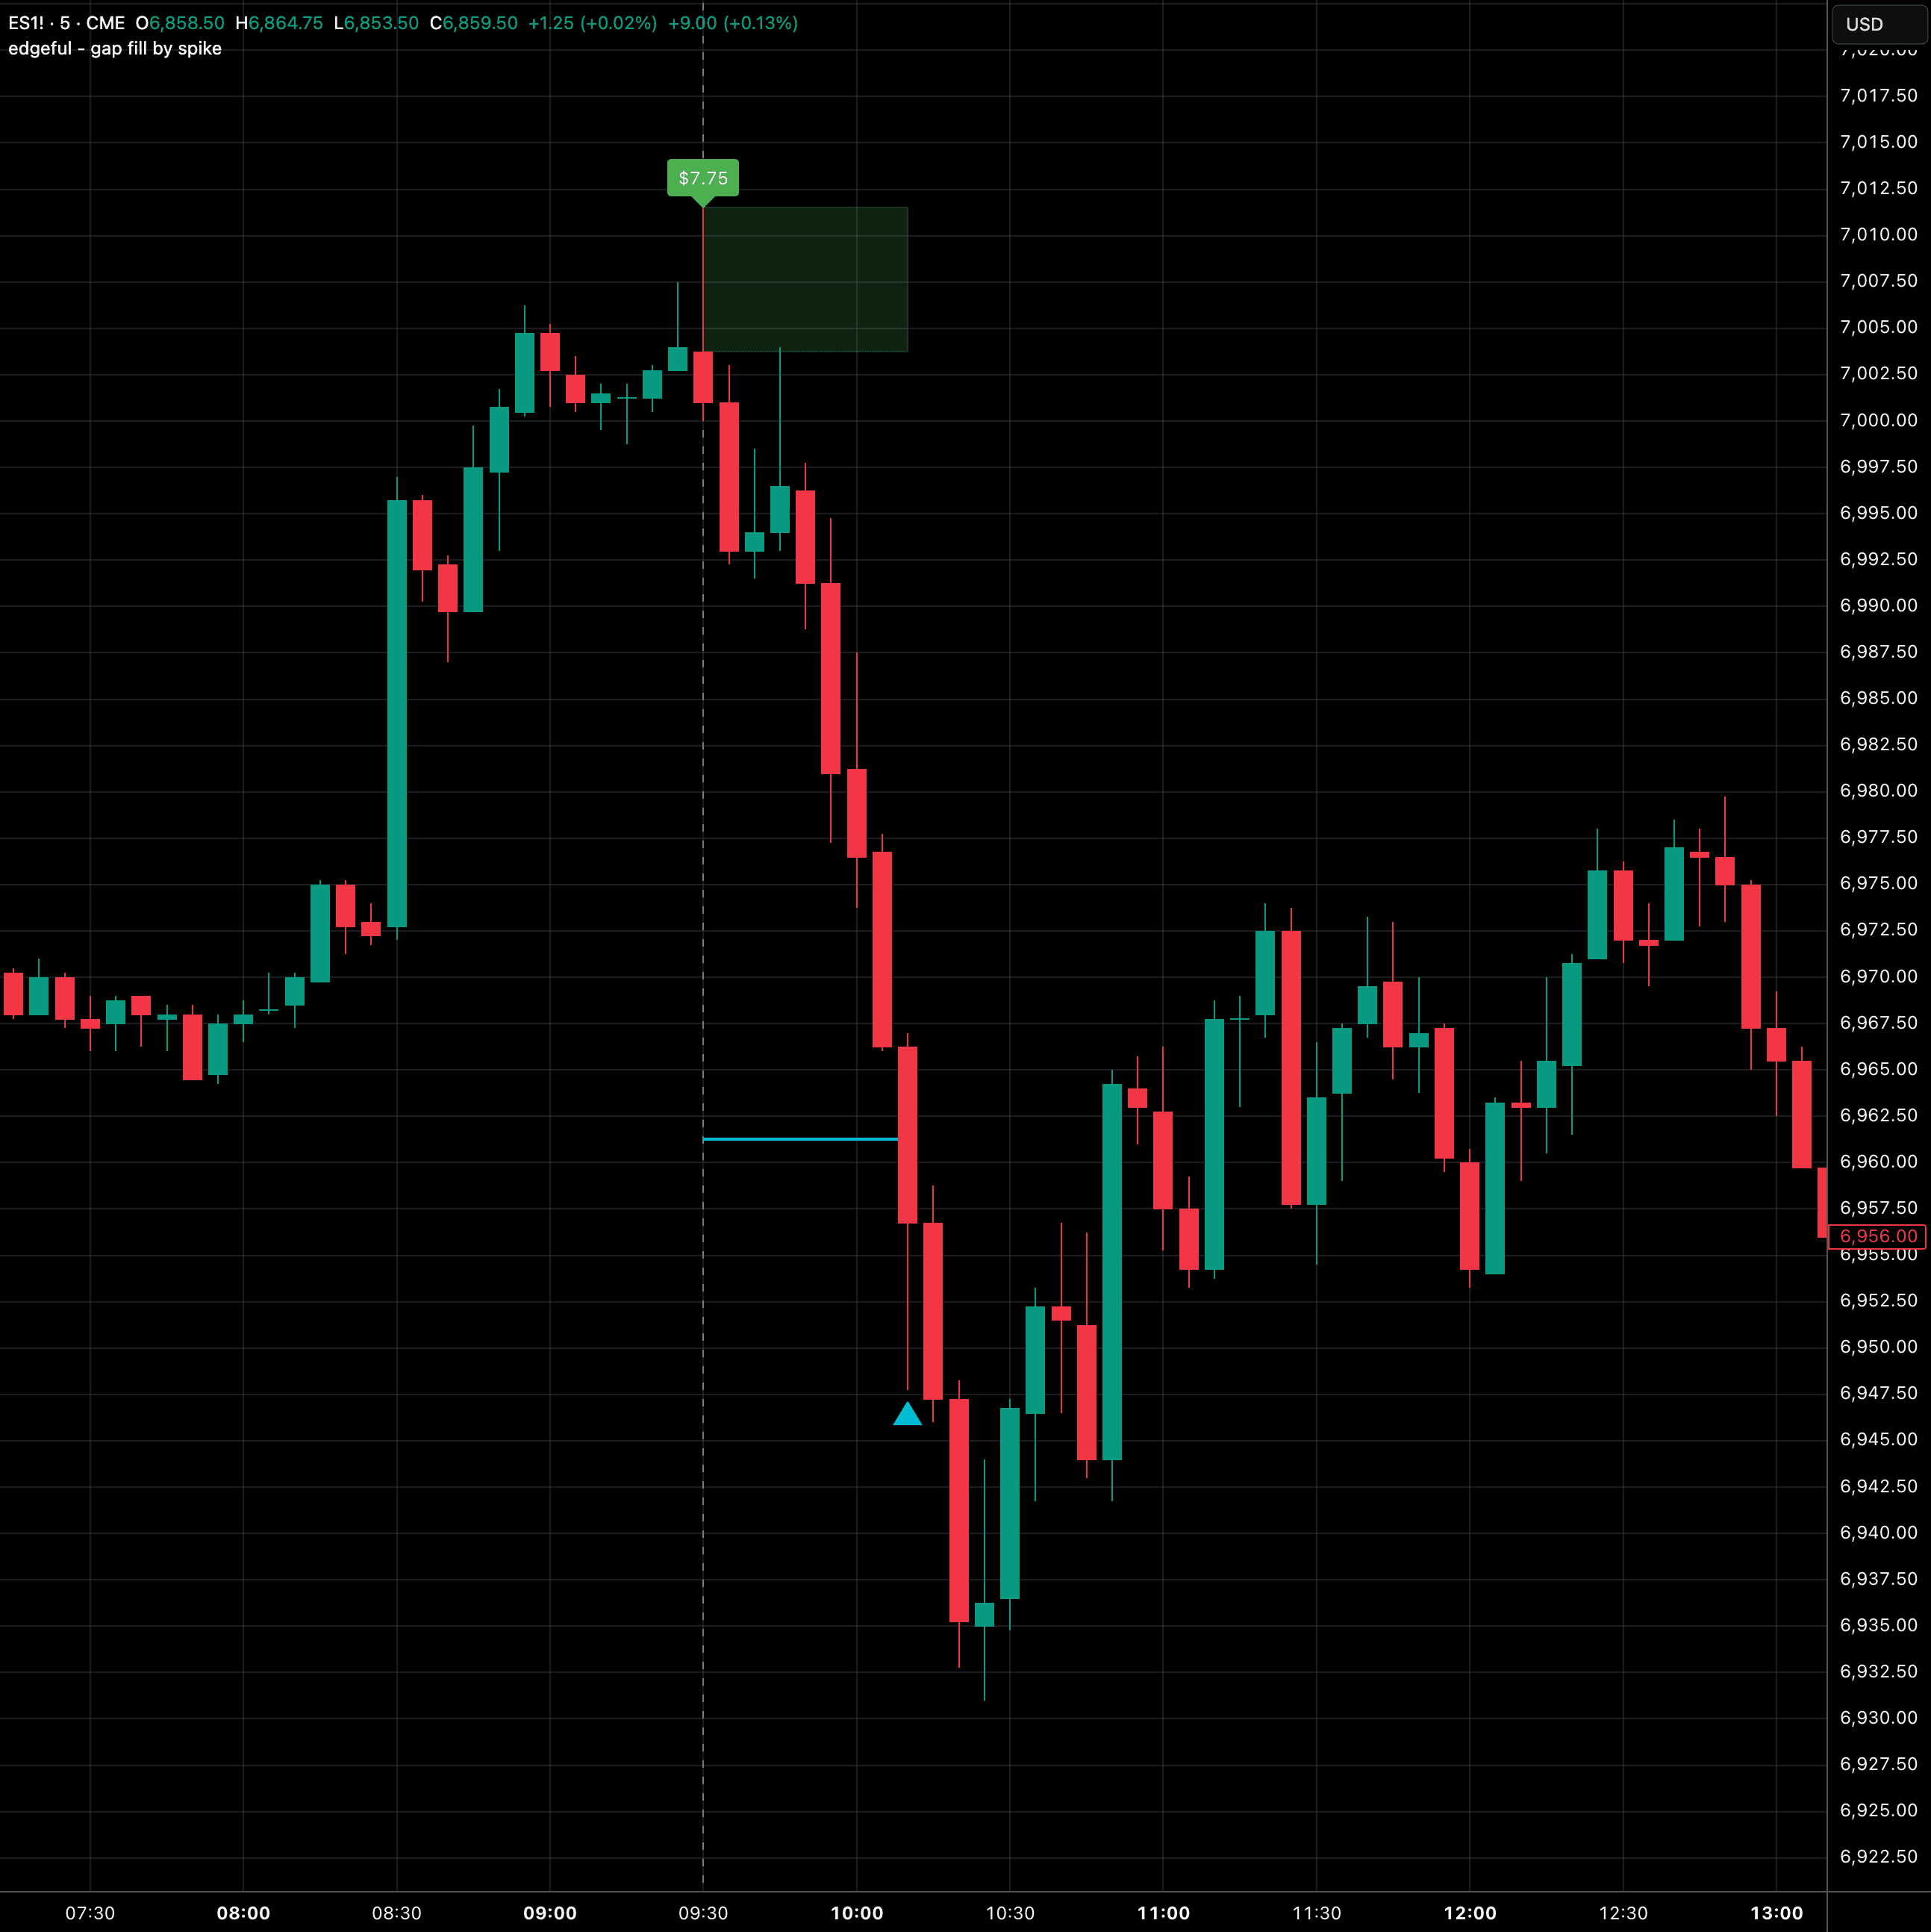
gap fill by spike
measures how far price spikes from open before filling the gap, with expanding boxes and dollar-value spike labels.
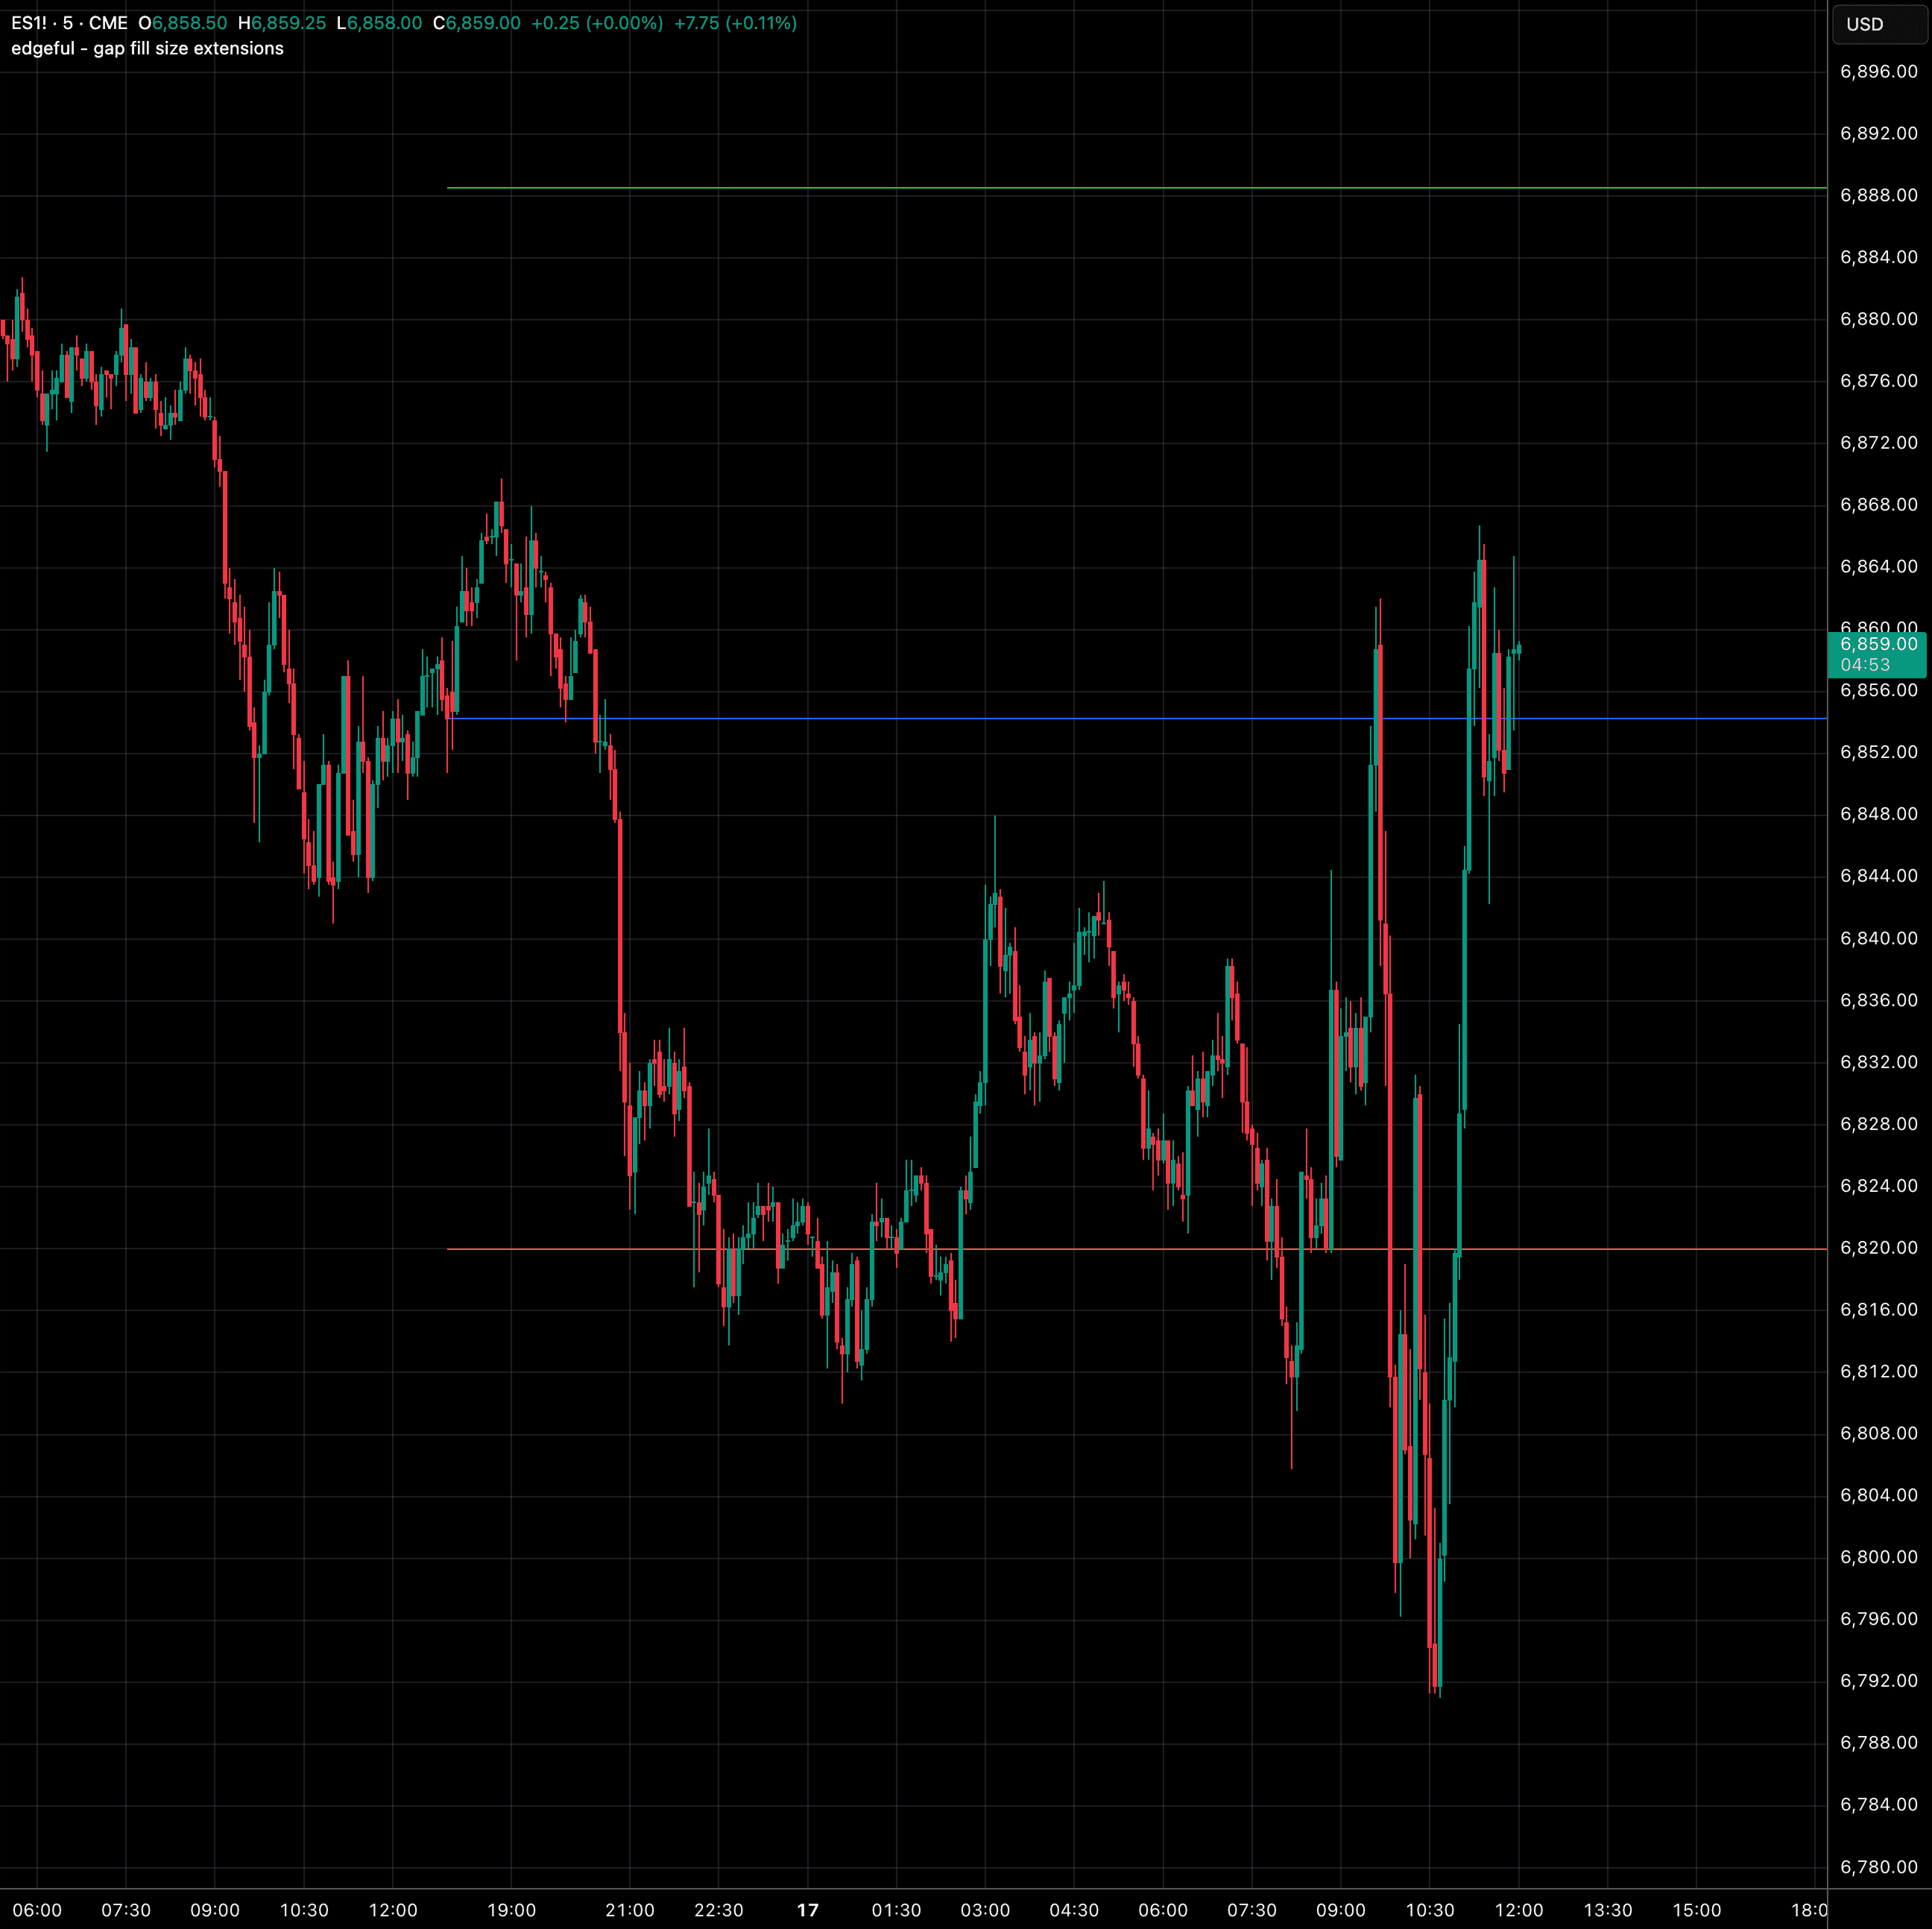
gap fill size extensions
projects percentage-based price targets above and below the session close for price movement after the gap.
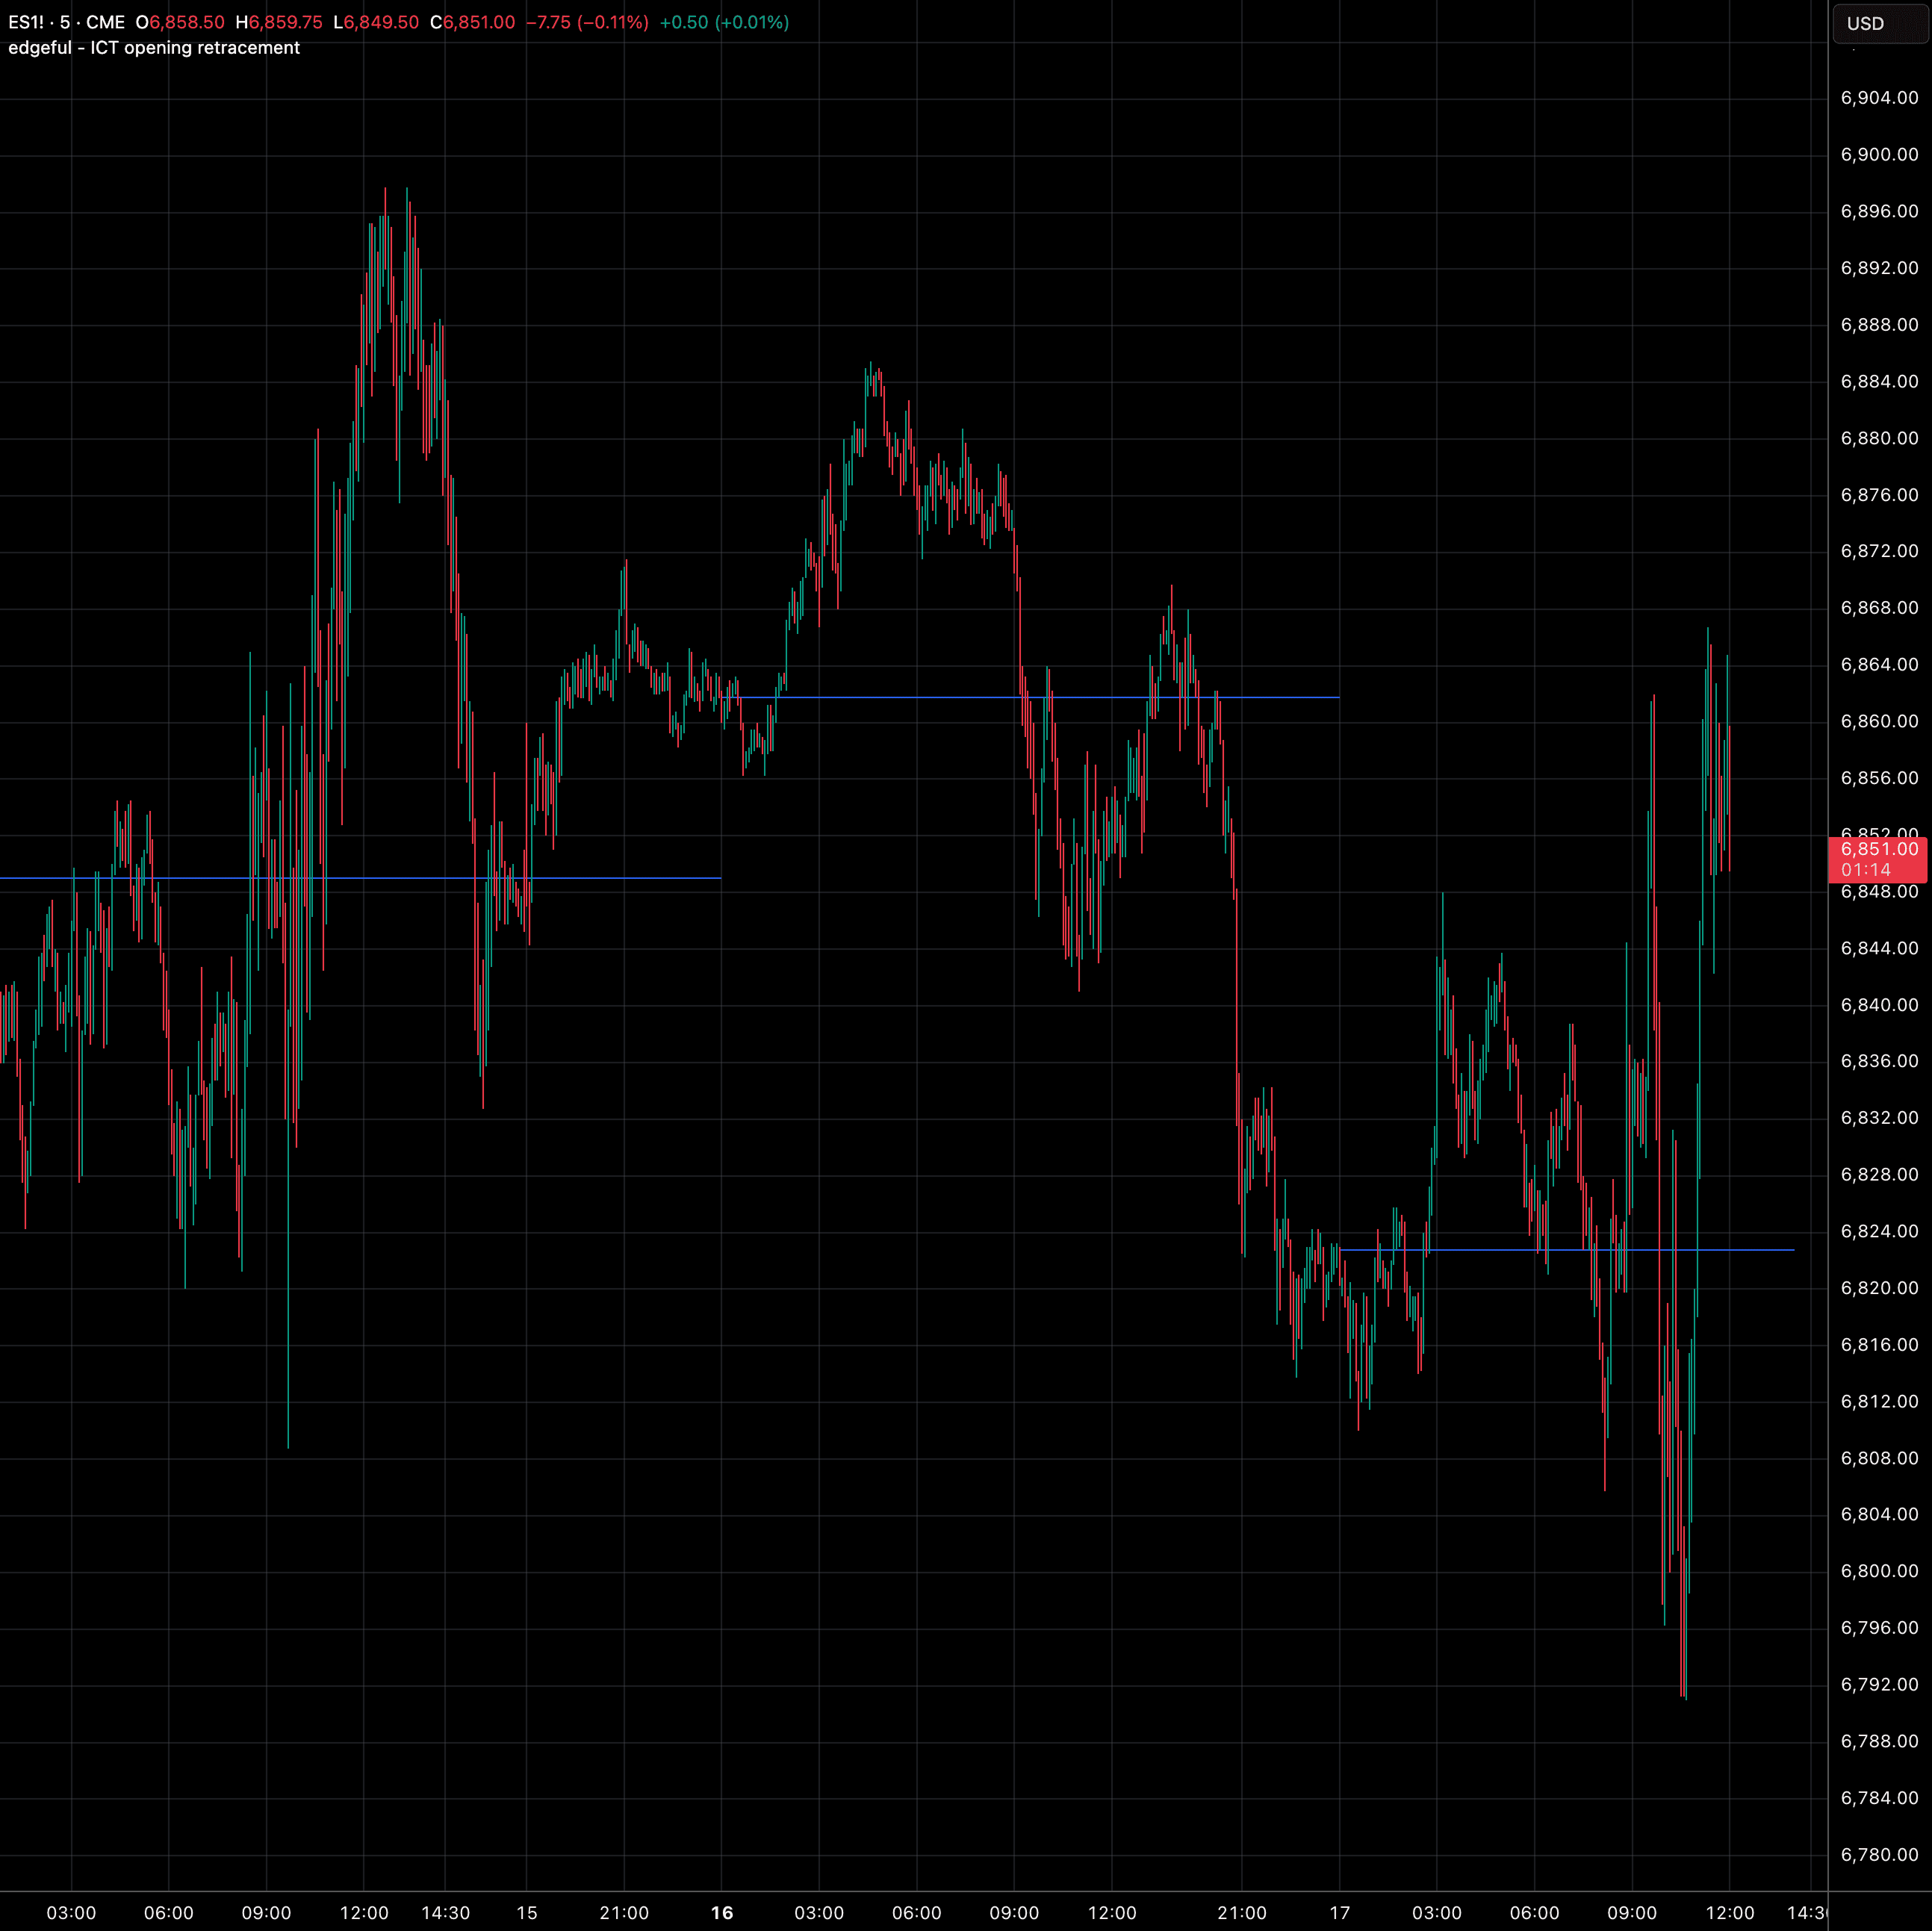
ICT opening retracement
auto-plots the NY midnight open price as a key retracement level for to watch for futures traders.
range breakouts
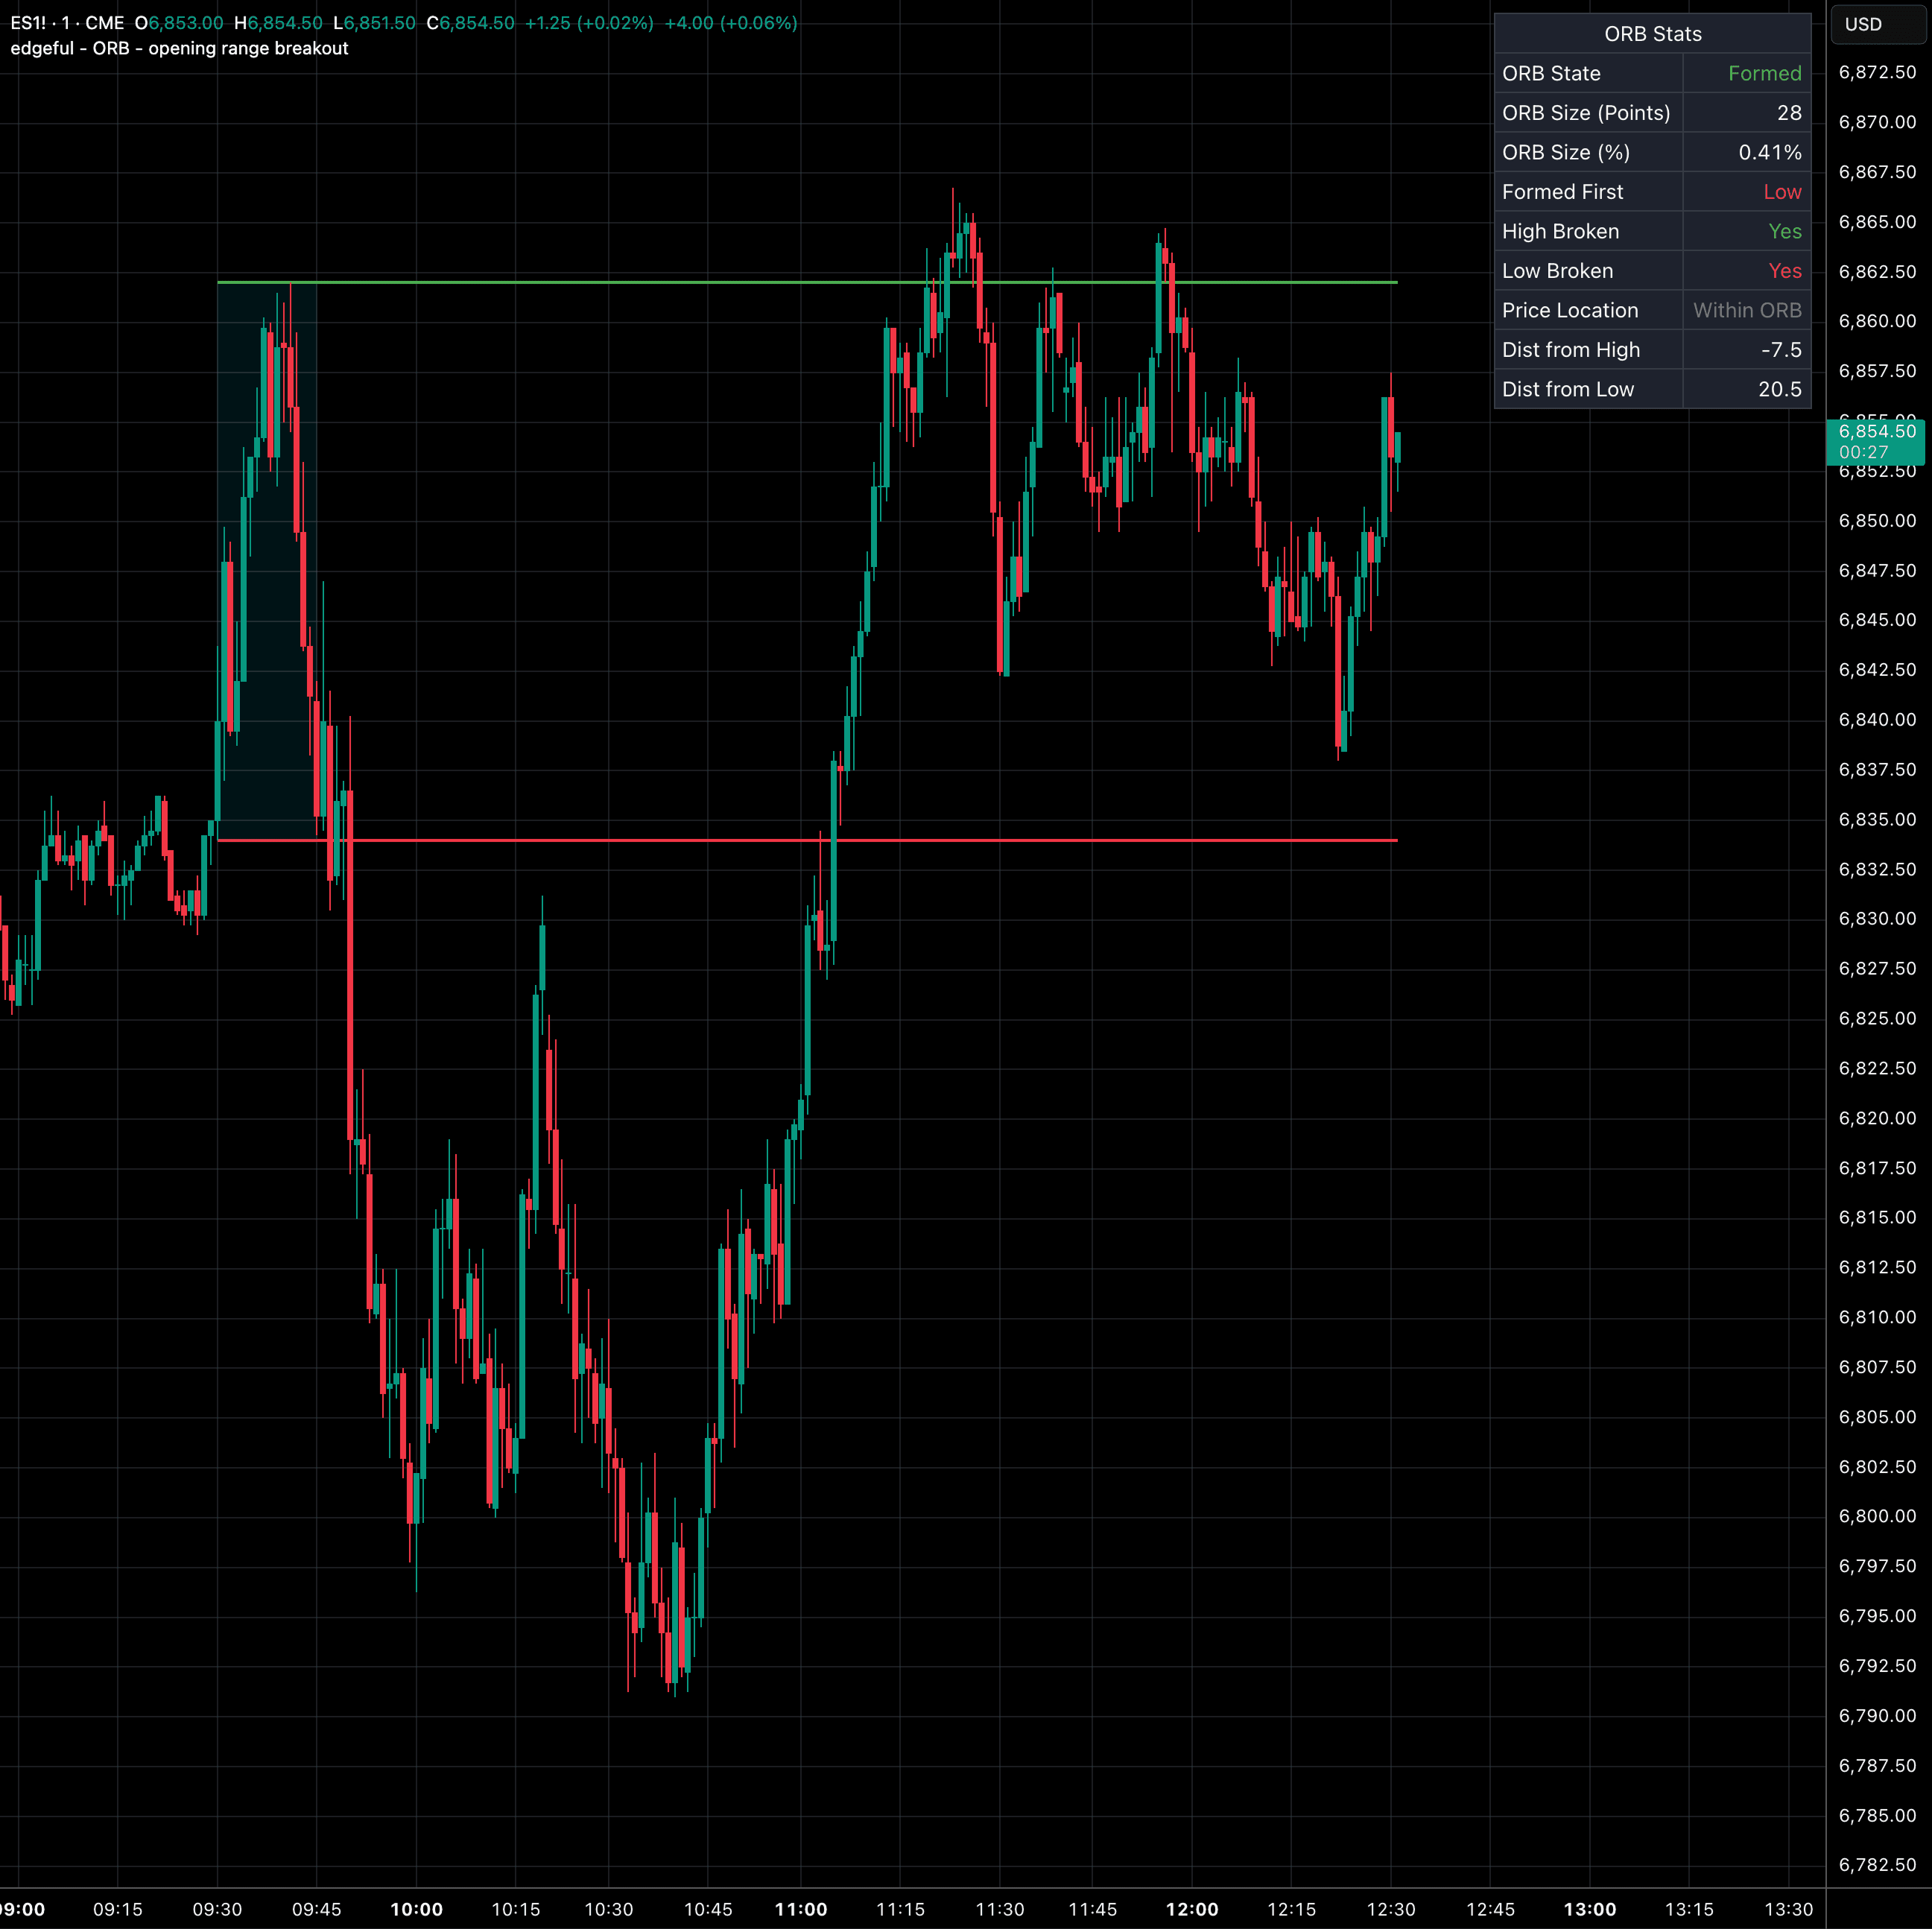
opening range breakout (ORB)
popular
auto-plots the opening range high/low with various extension and retracement levels, plus a live stats dashboard.
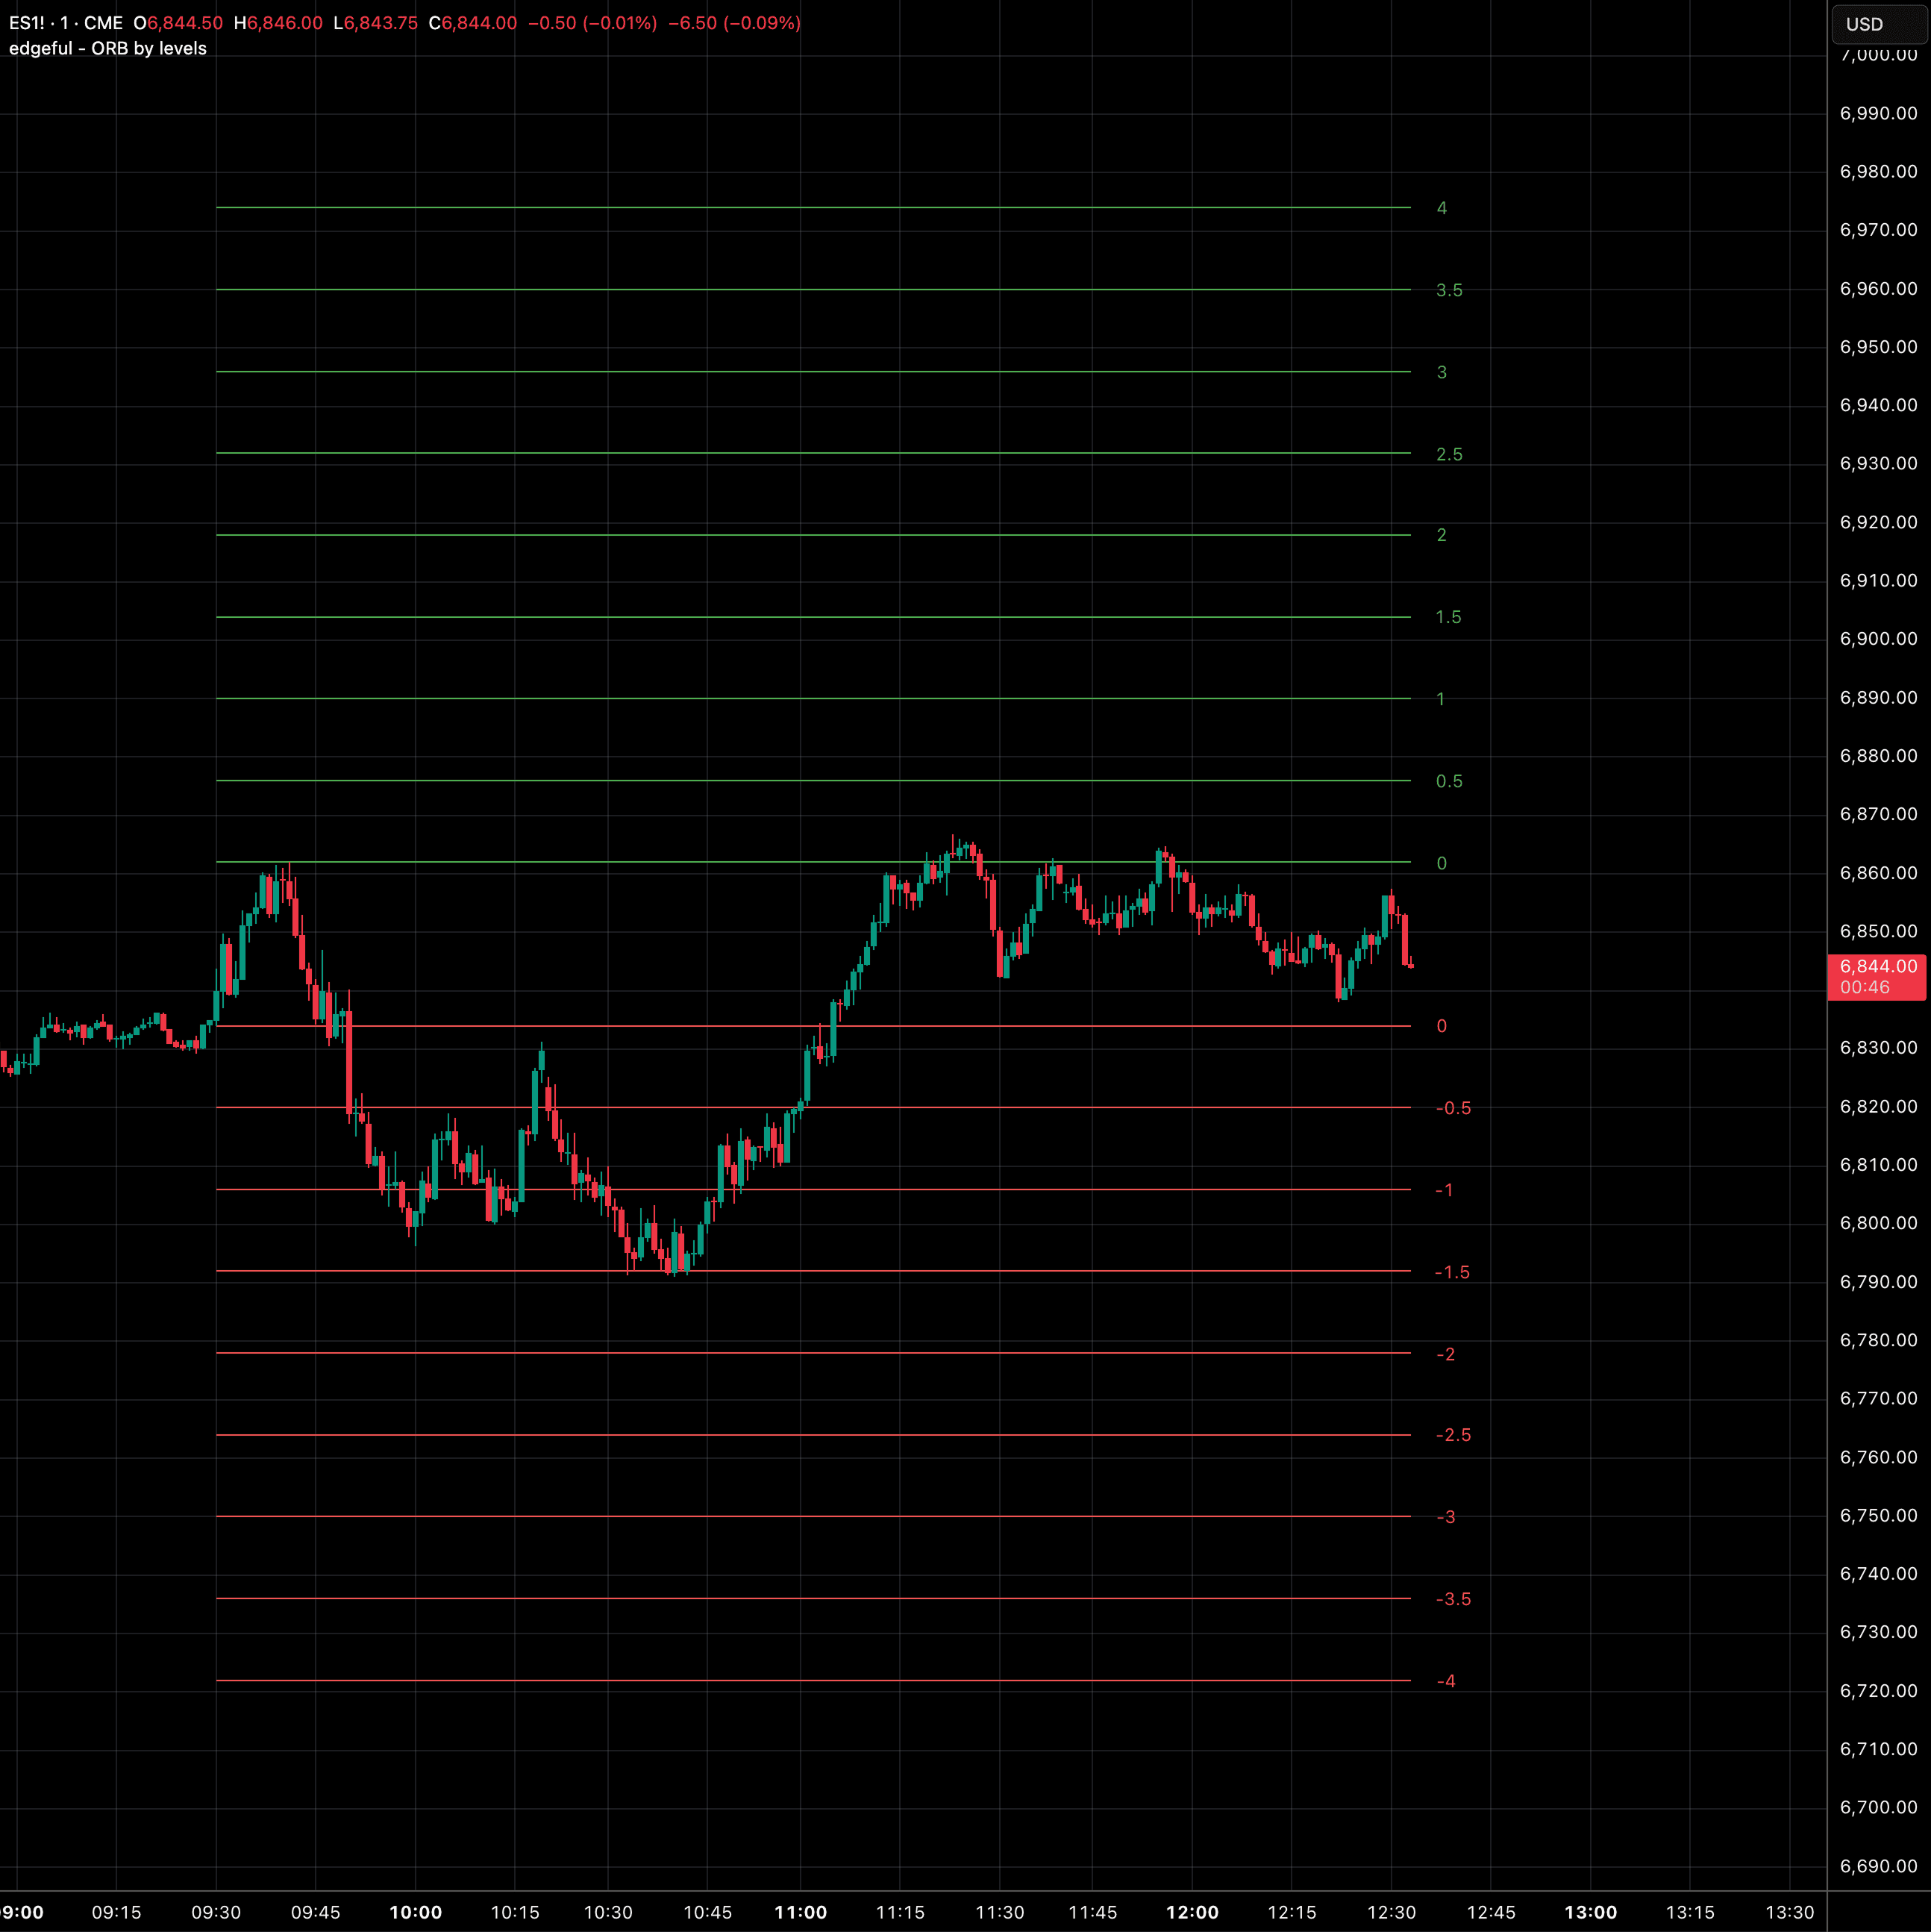
ORB by levels
auto-plots multiple extension levels above and below the opening range with dynamic price labels that follow current price.
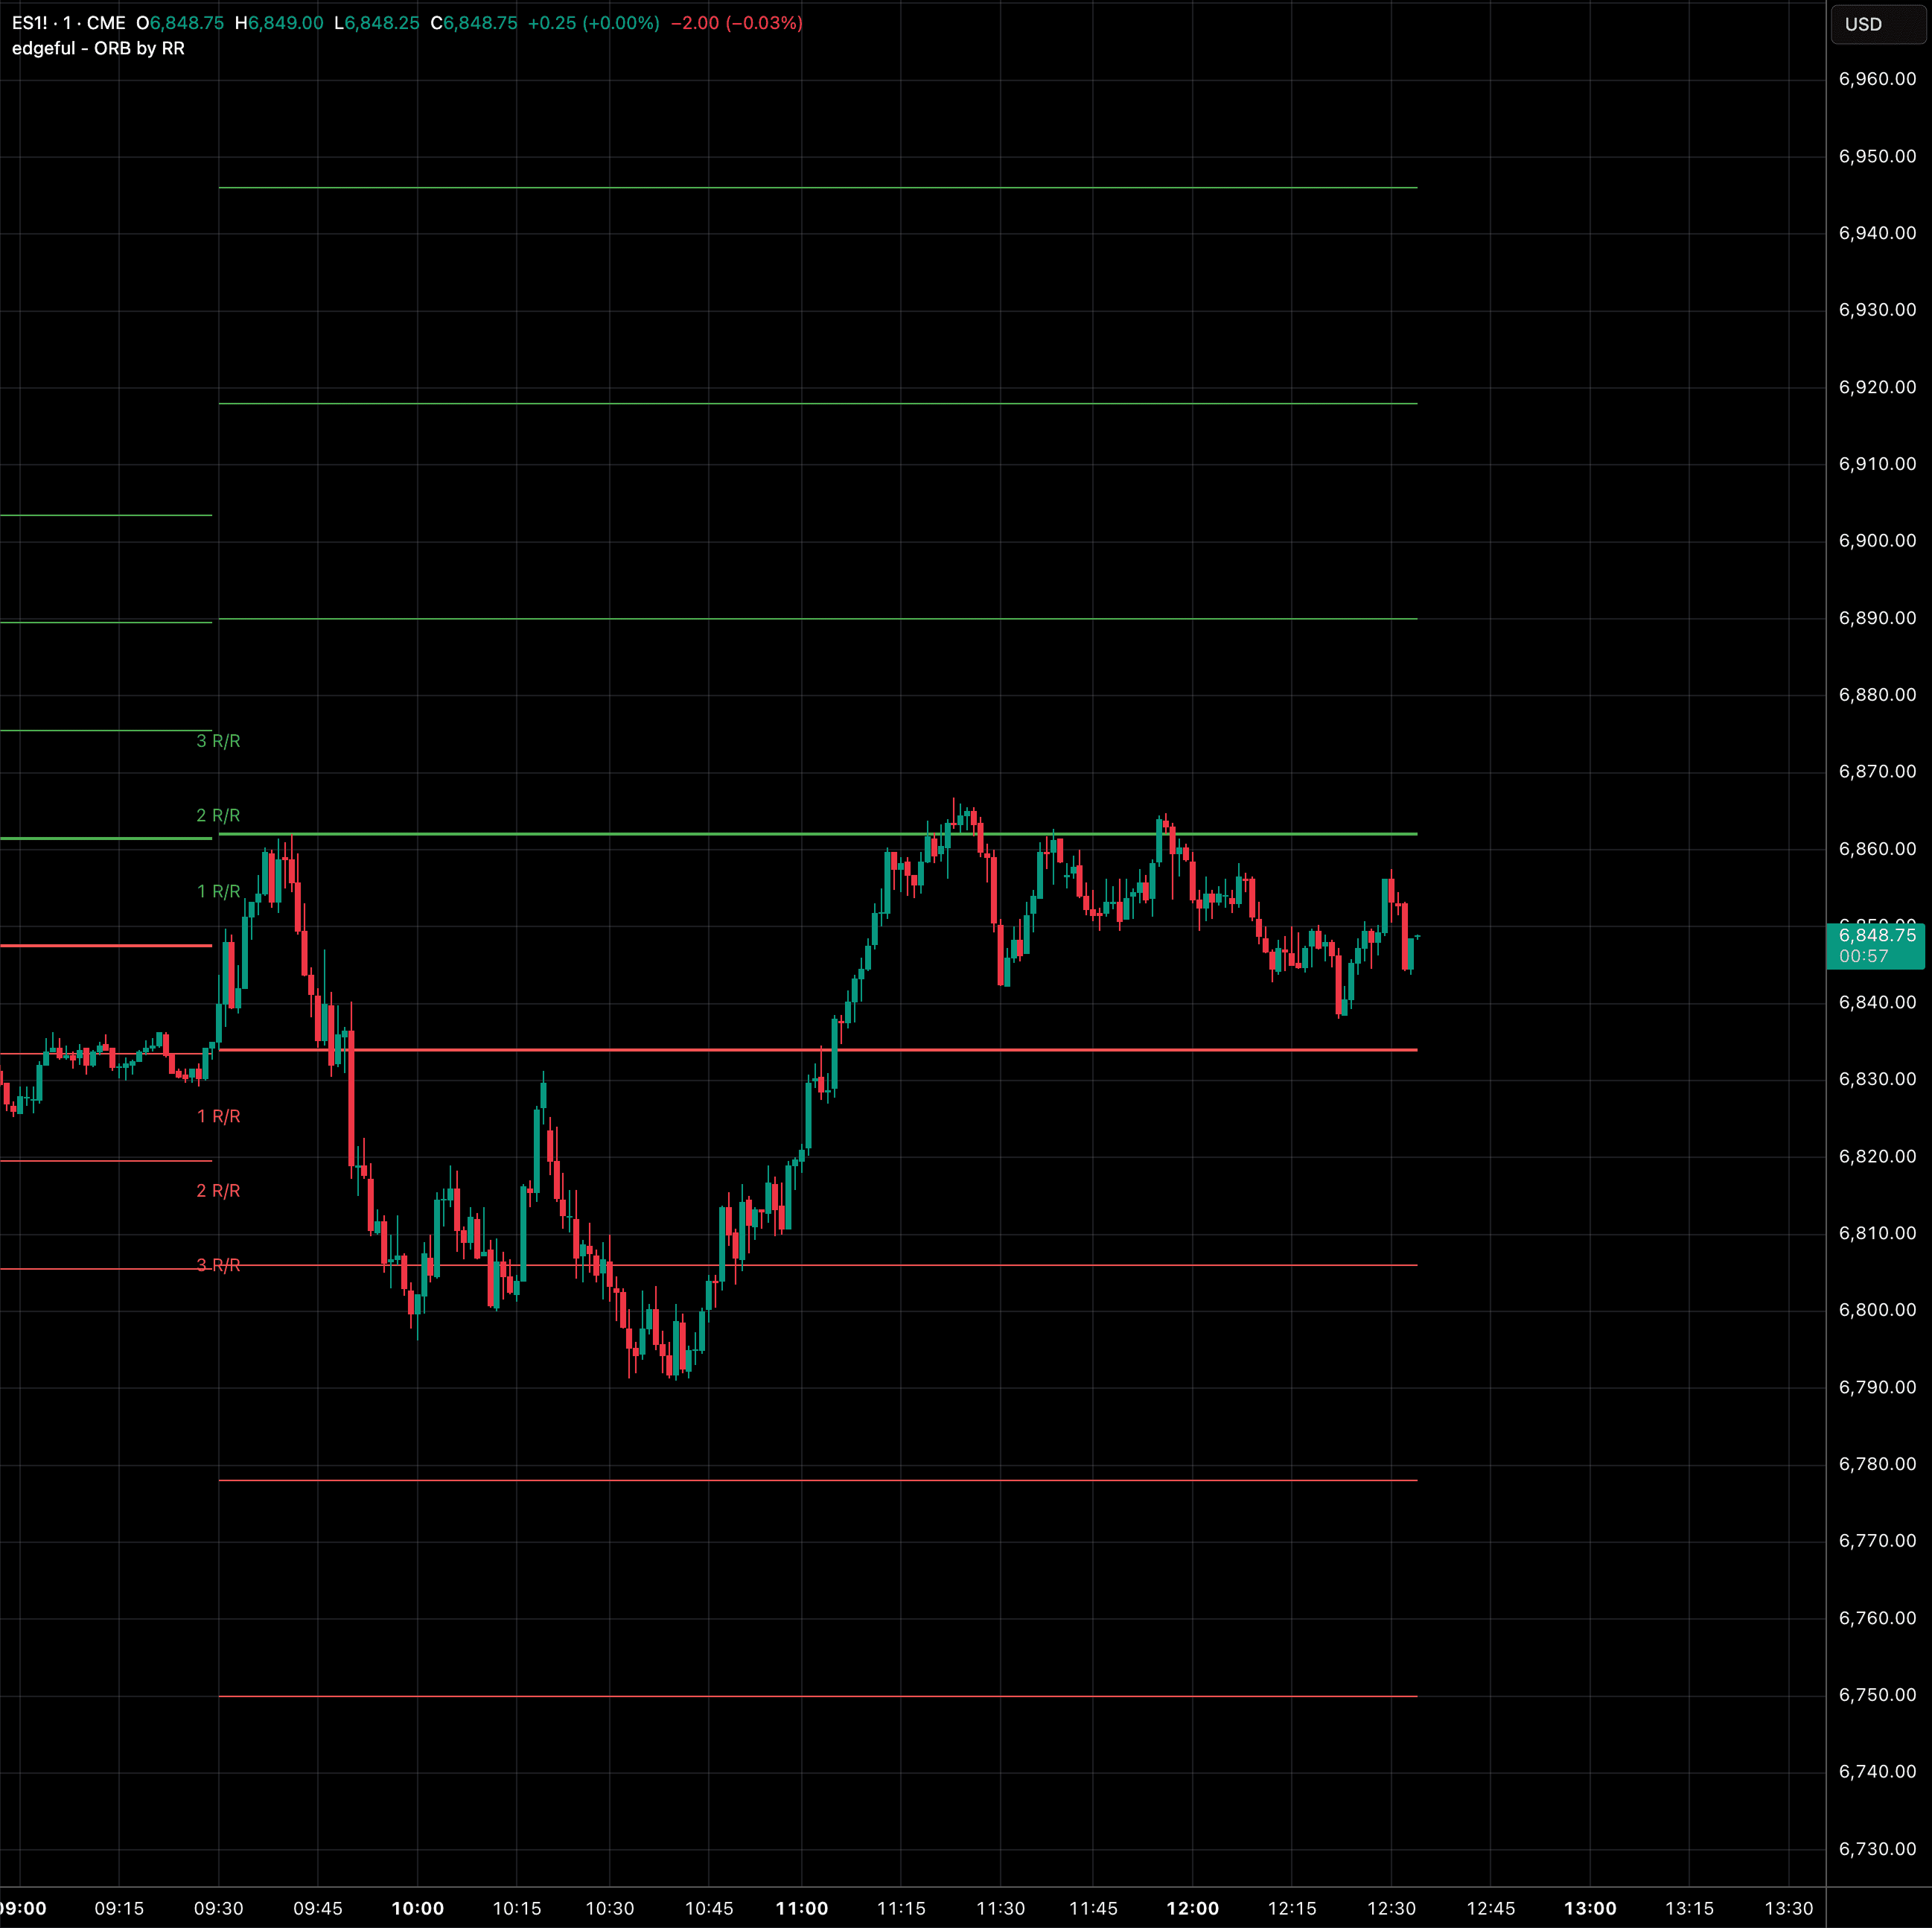
ORB by R/R
auto-plots fixed 1R, 2R, and 3R target levels for long and short breakout trades based on the opening range size.
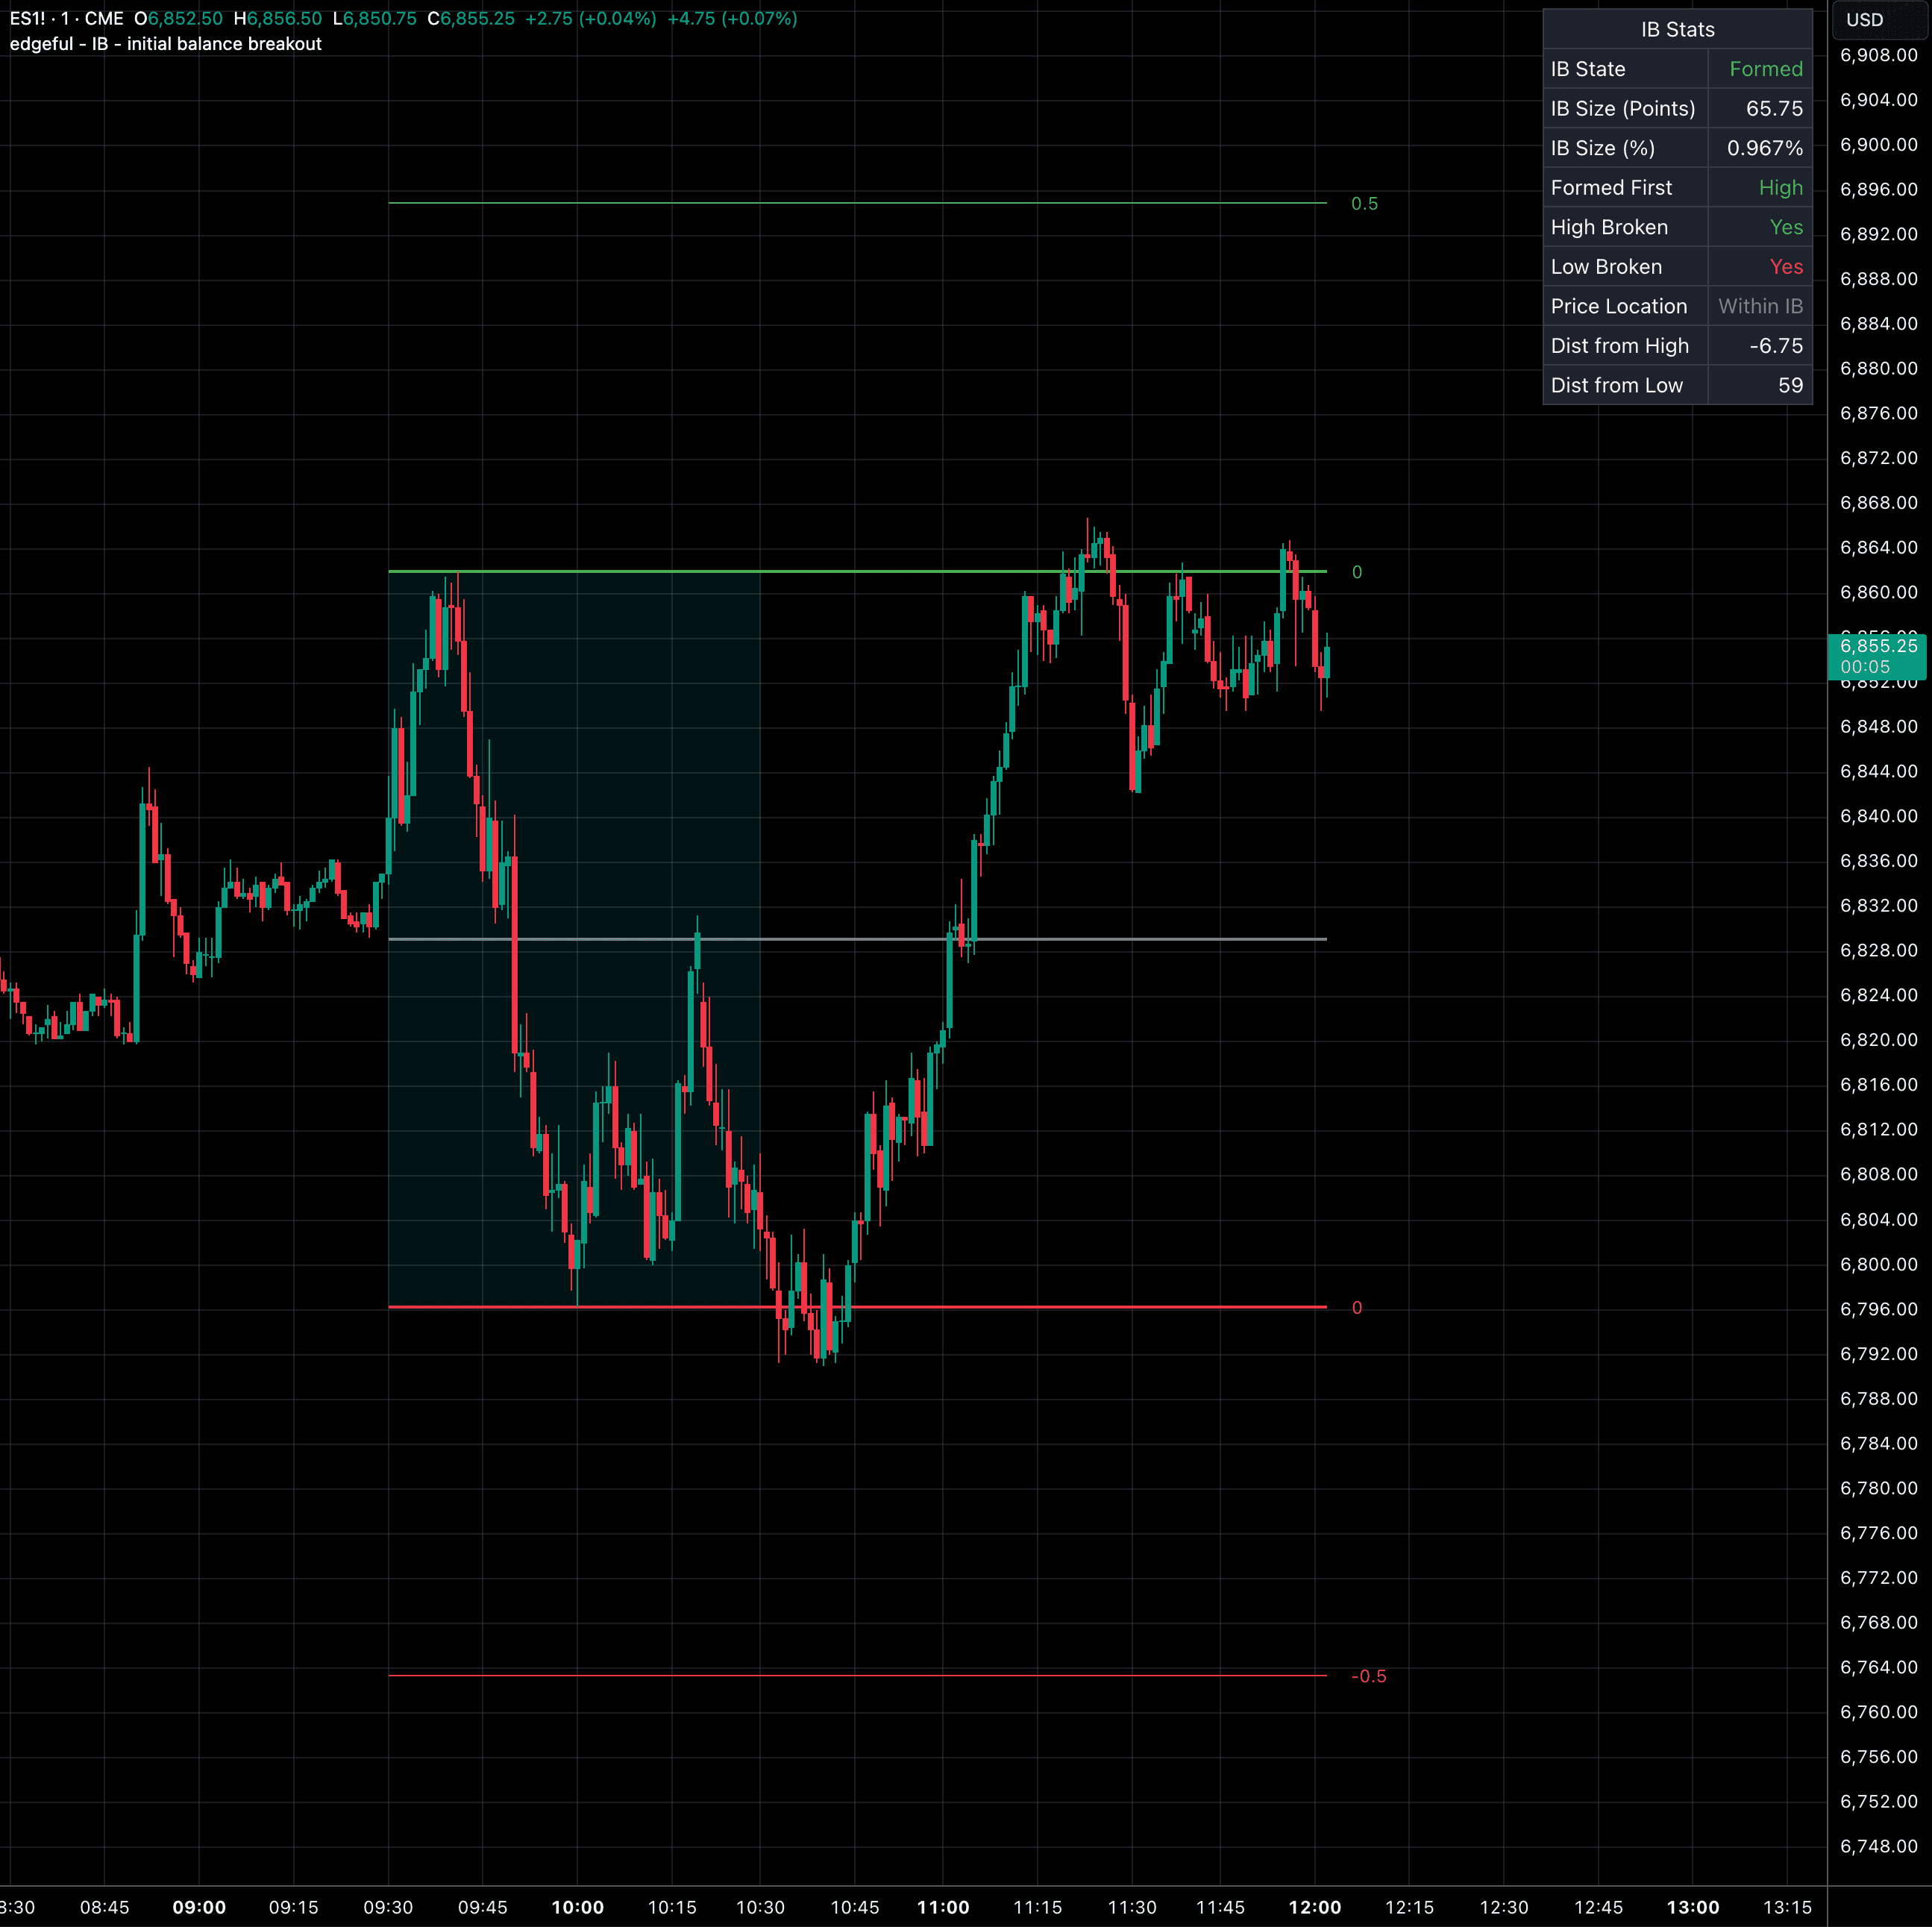
initial balance (IB)
popular
auto-plots the first hour's high/low with multiple extension and retracement levels, plus a live stats dashboard.
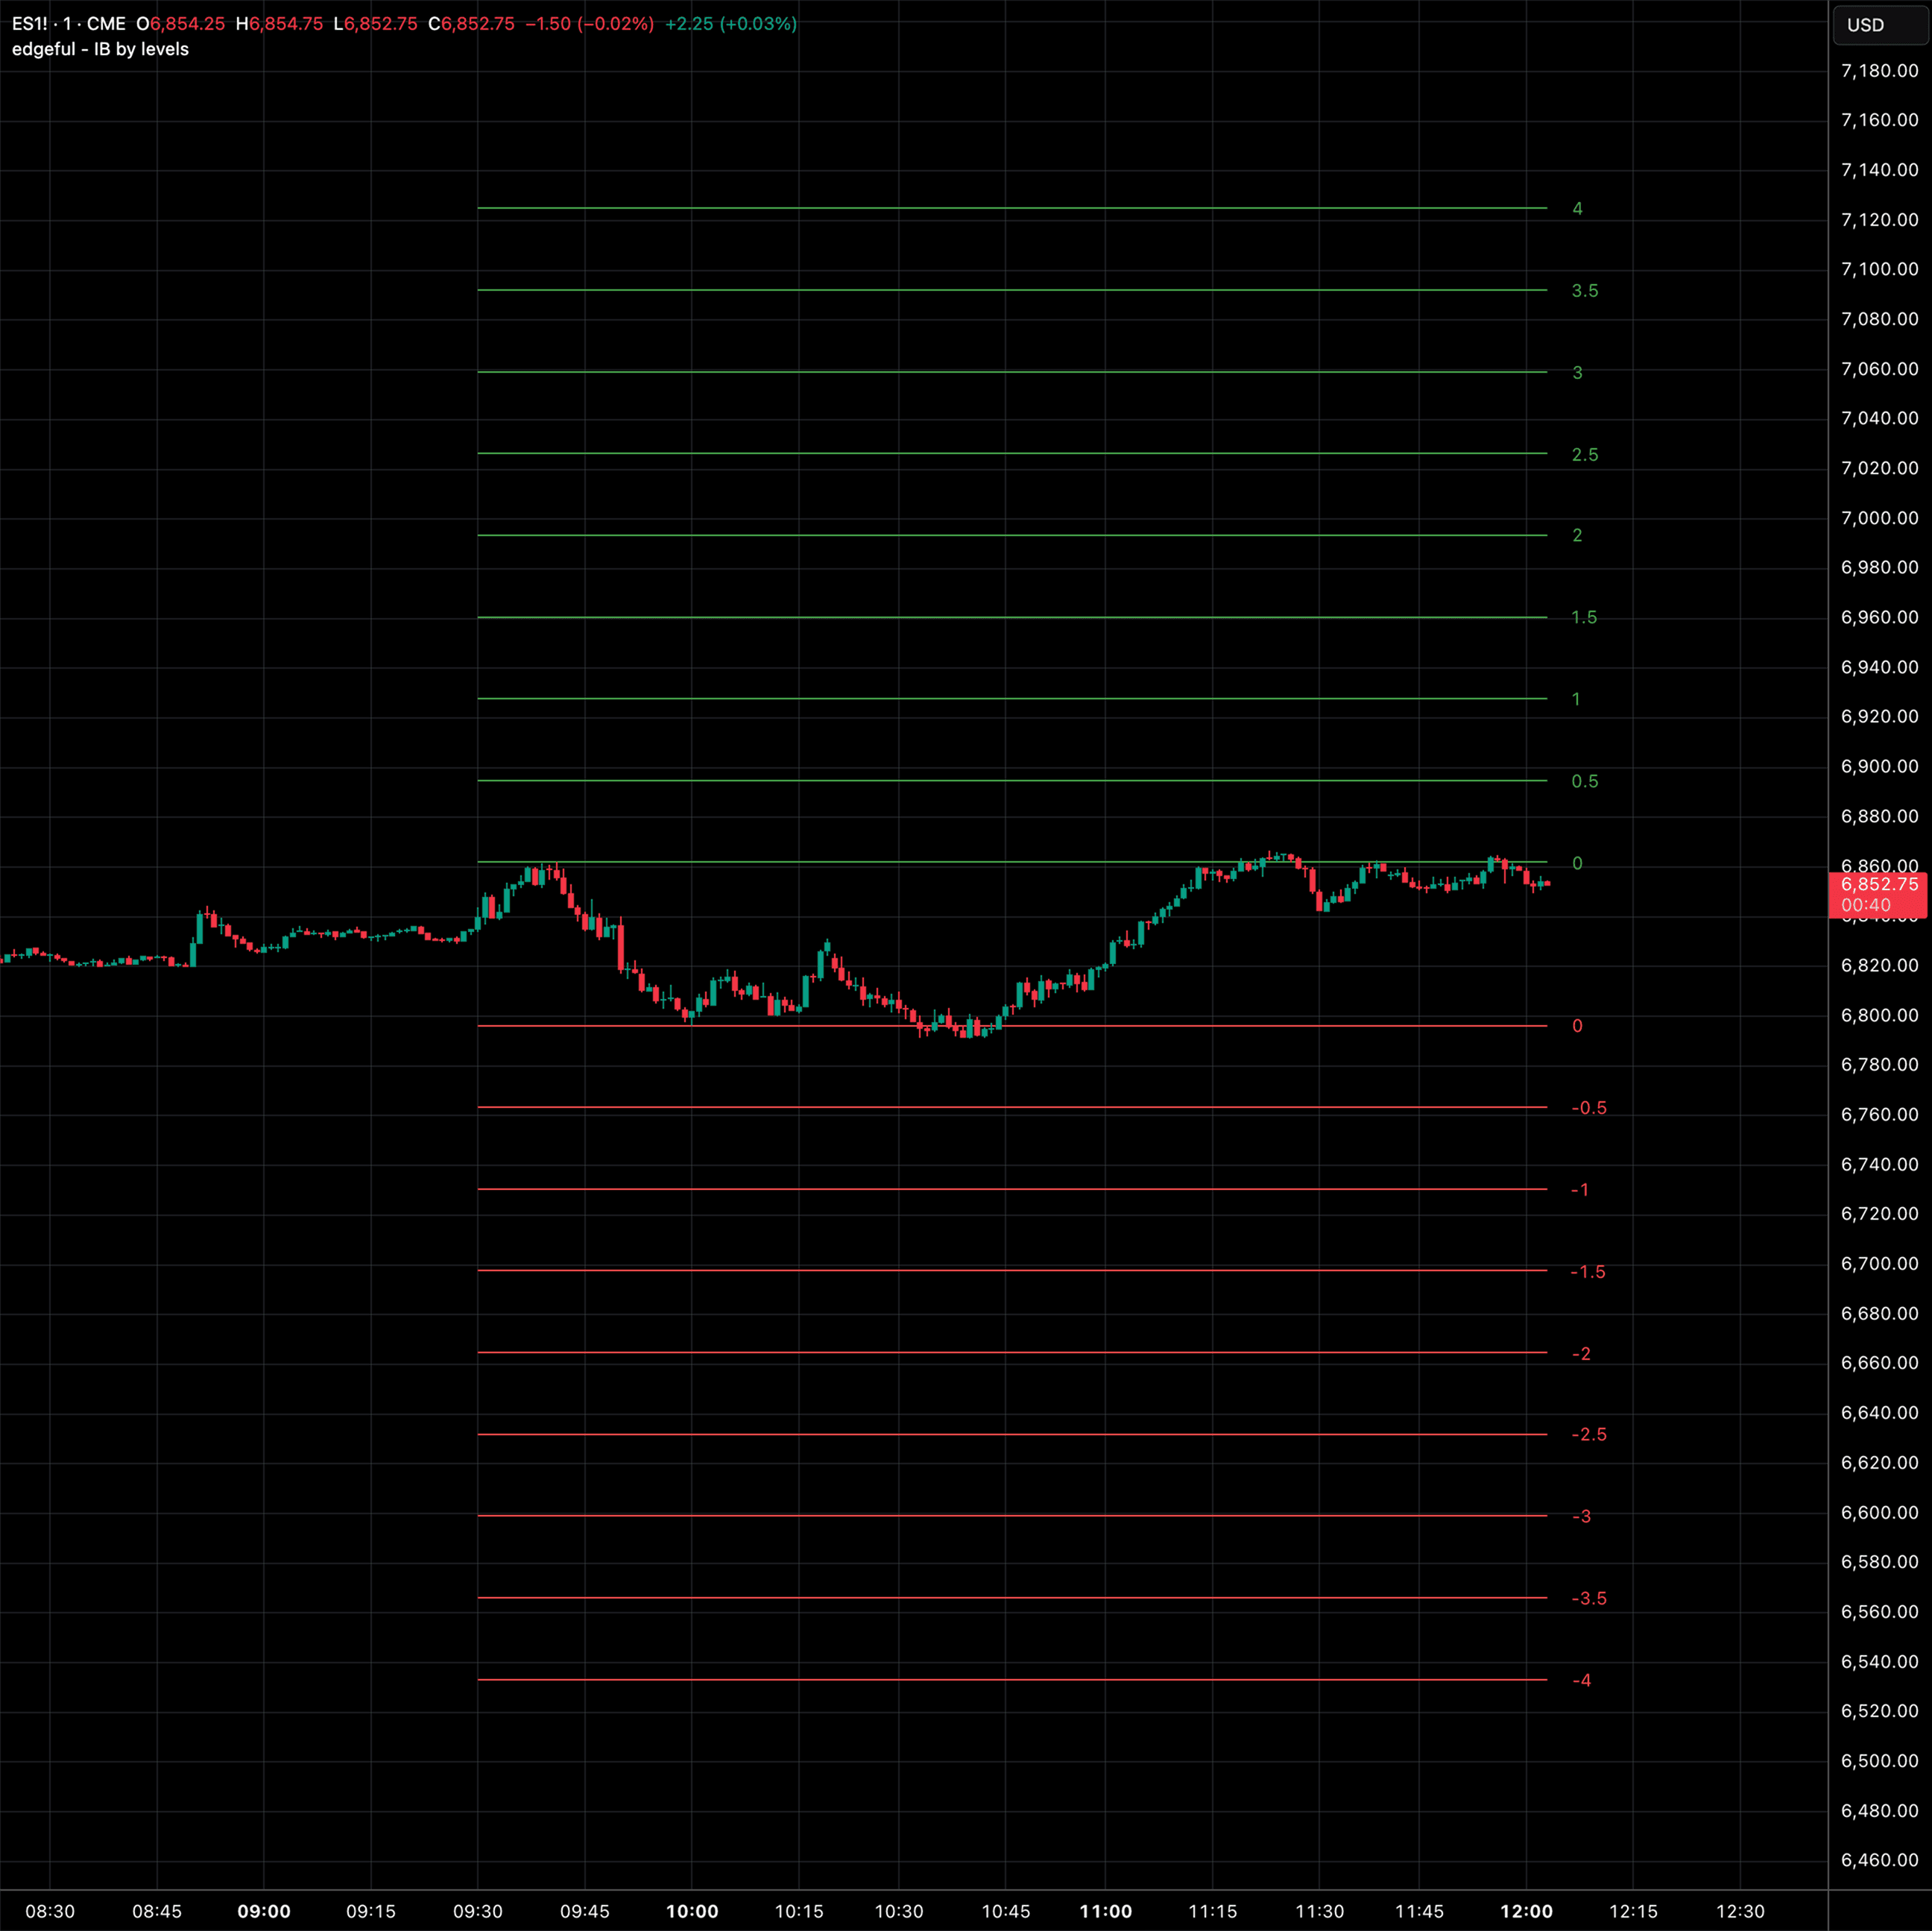
IB by levels
auto-plots mulitple extension levels above and below the first hour's range with dynamic price labels that follow current price.
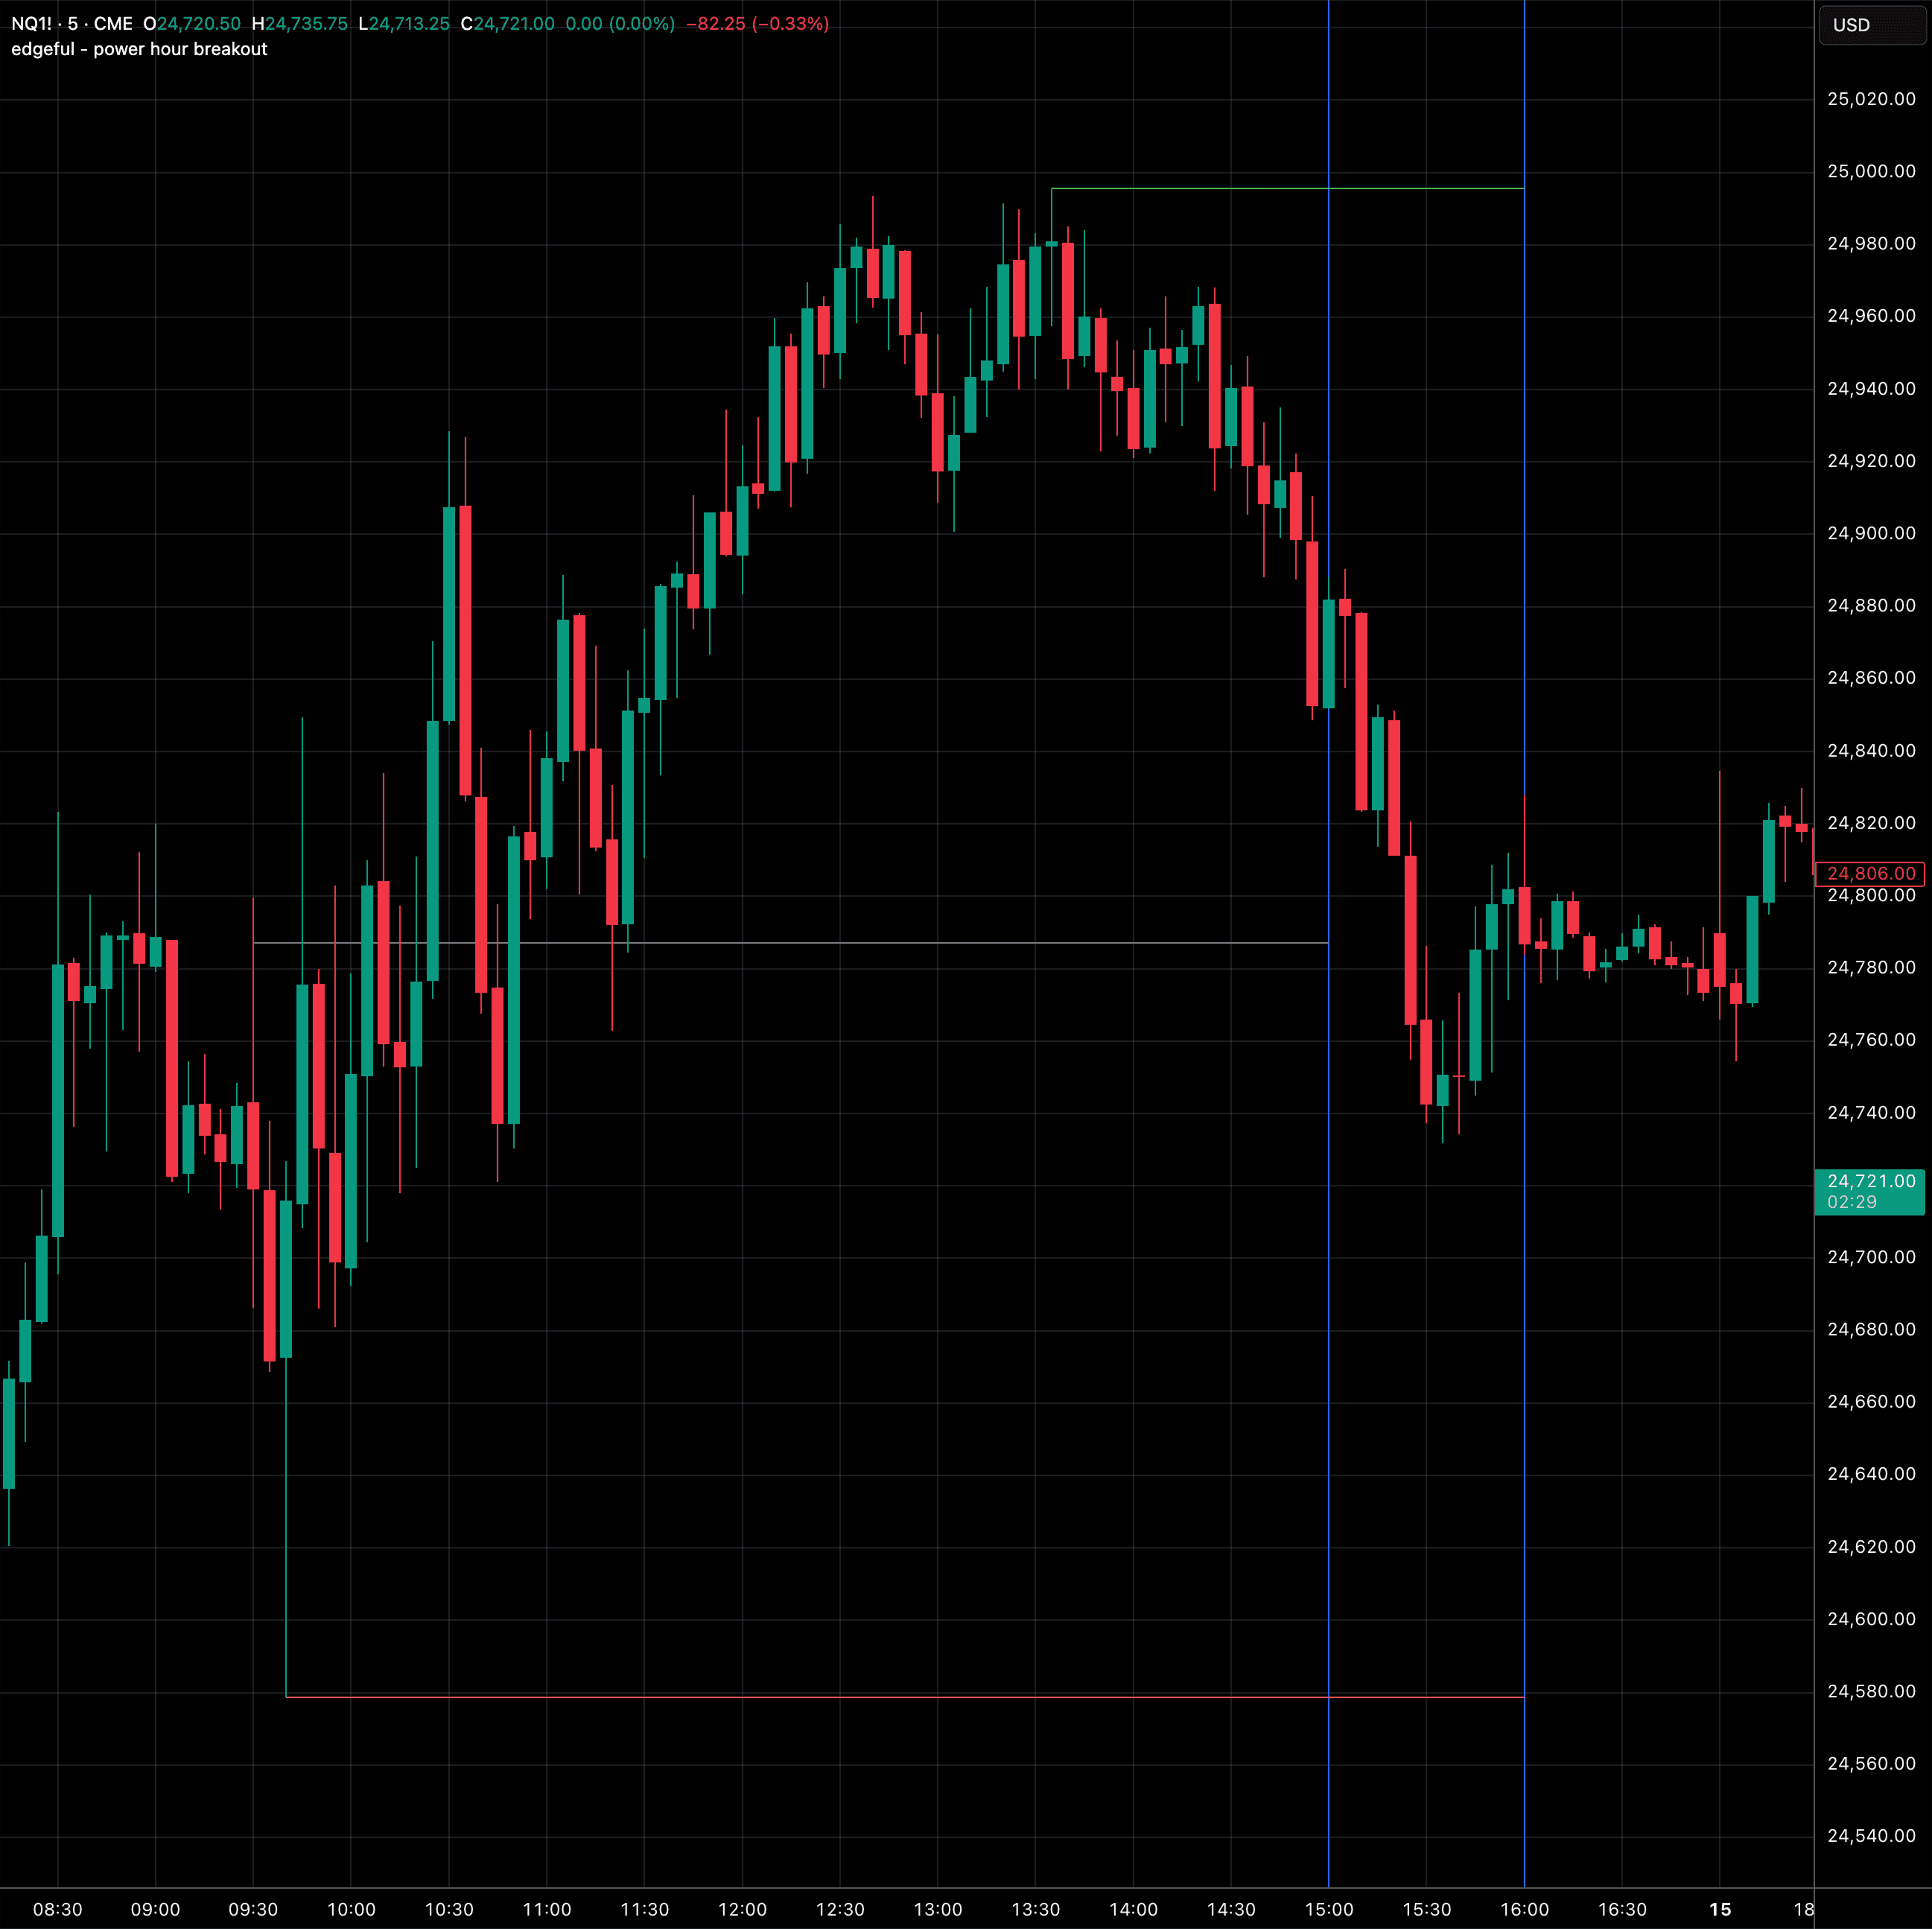
power hour breakout
captures the day's high and low from open to 3 PM, giving you key breakout levels to watch and potentially target for the final hour of trading.
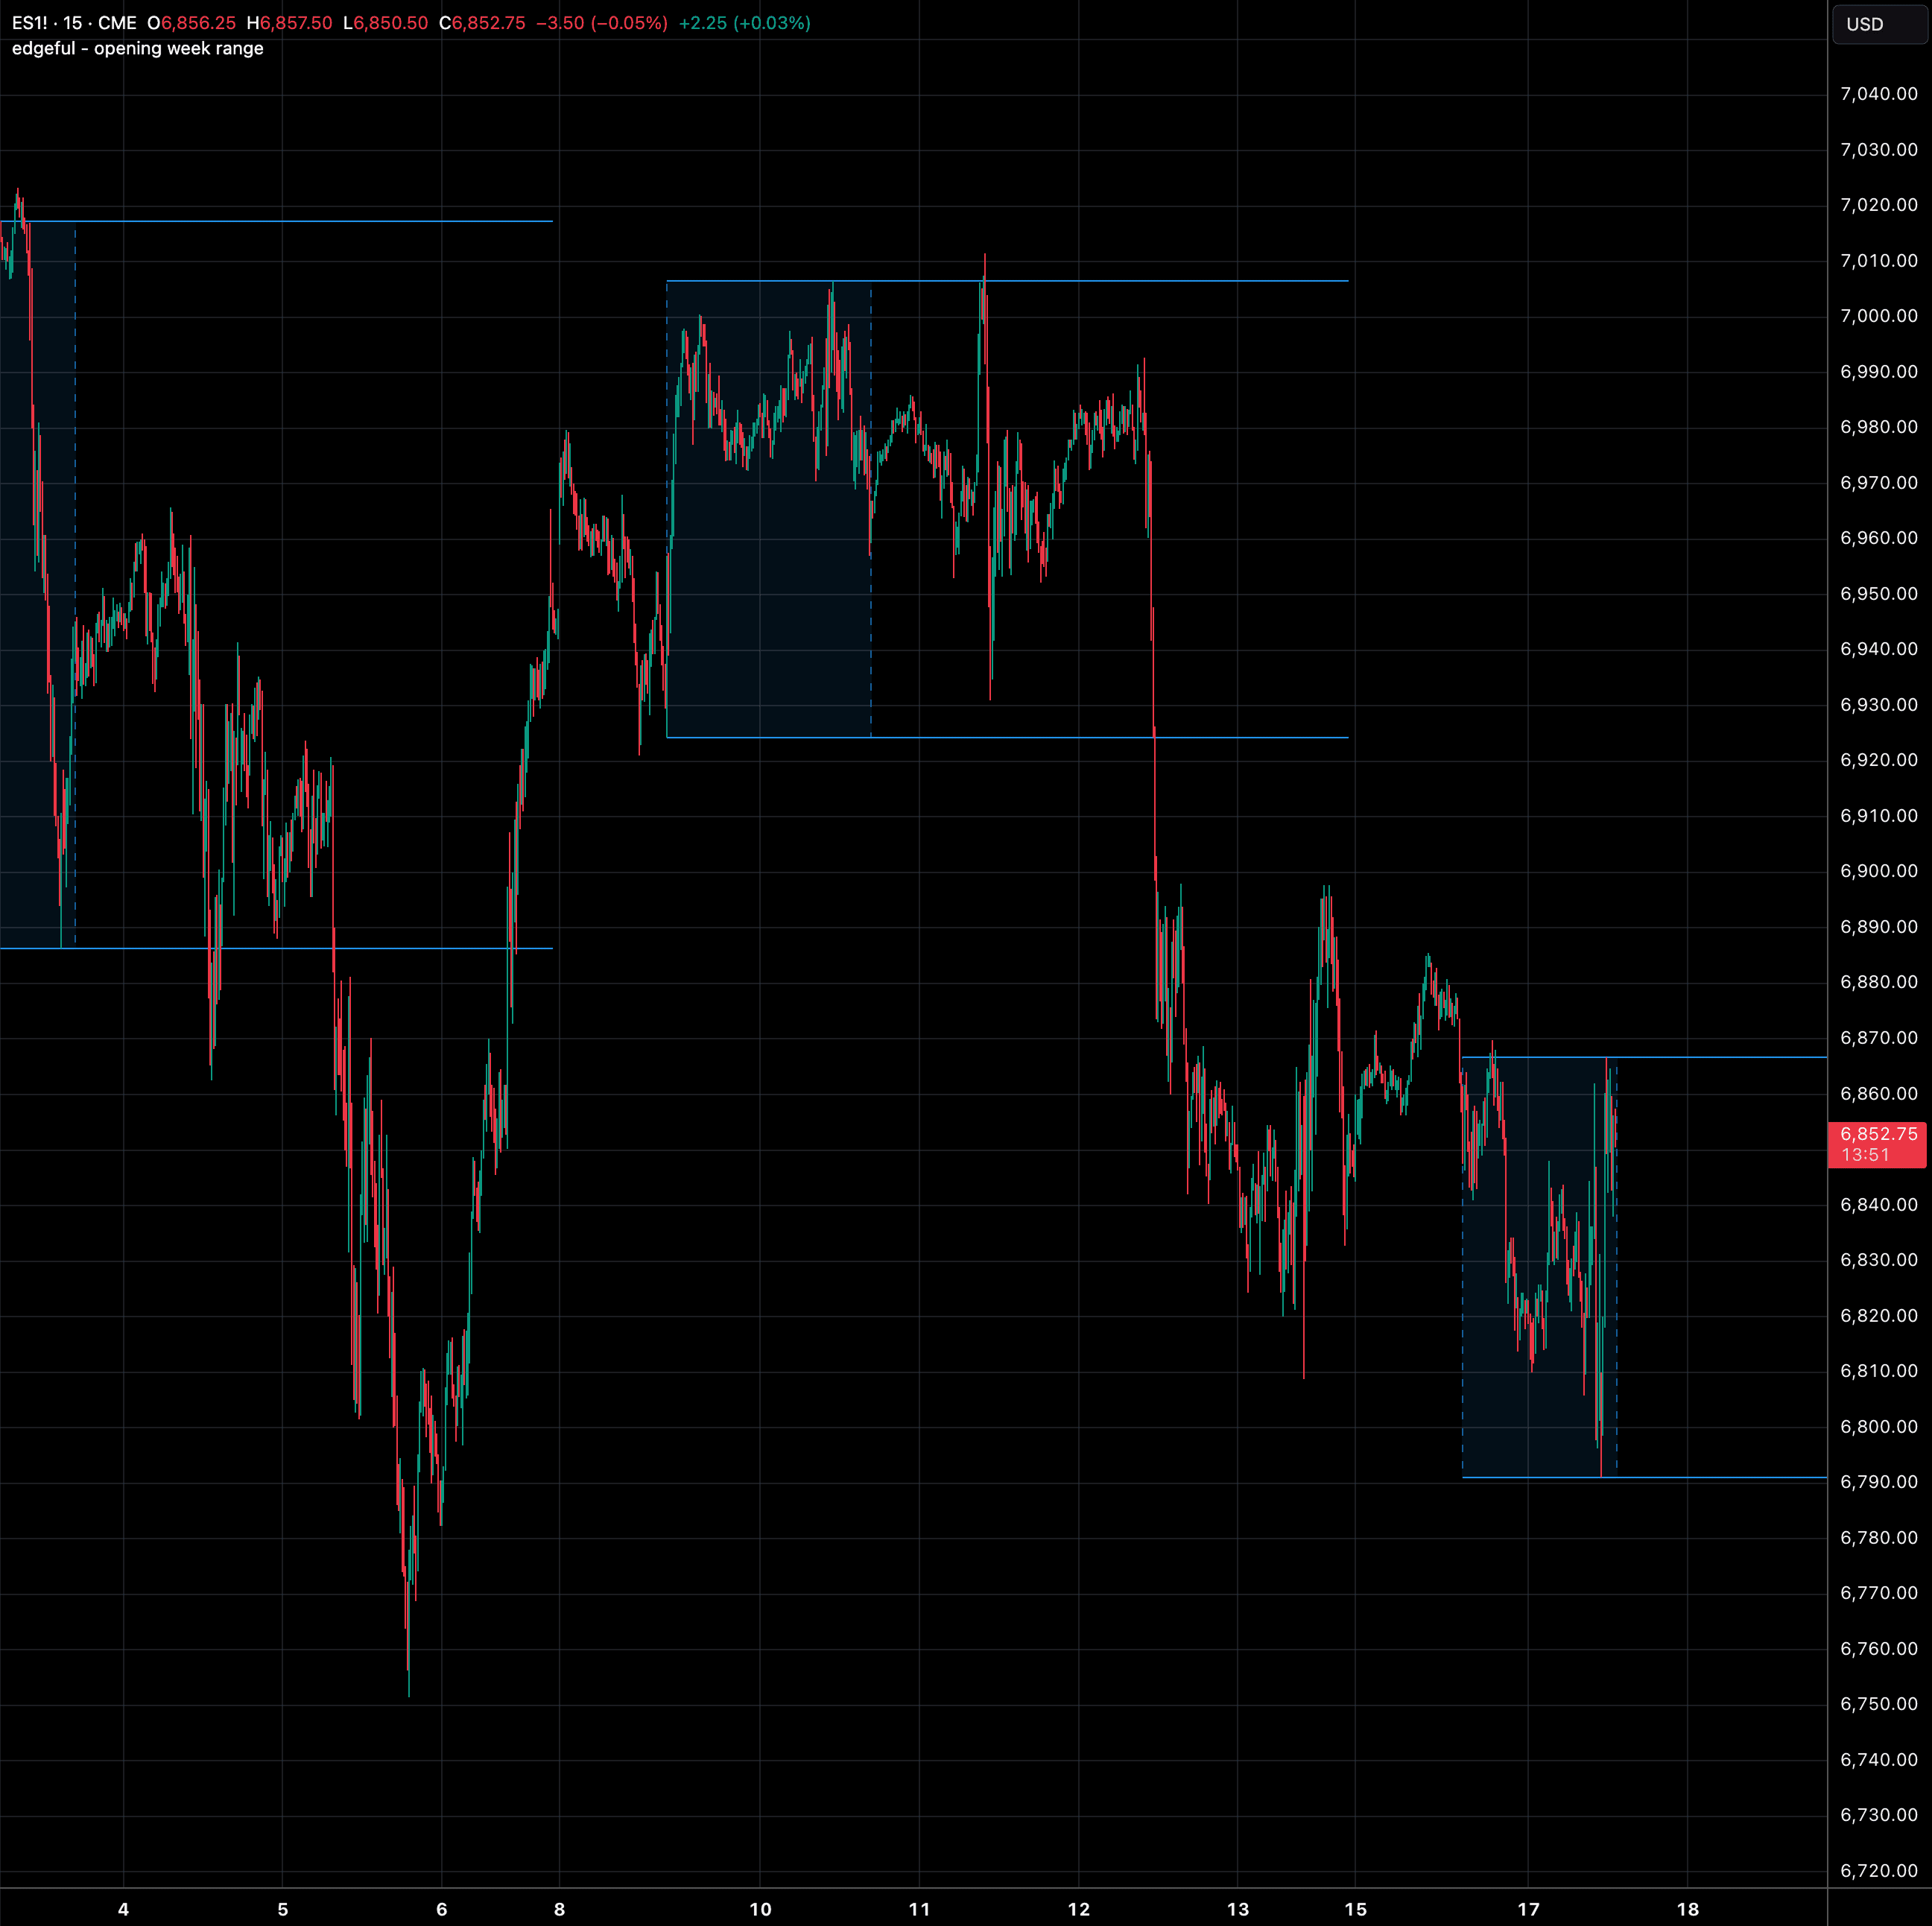
opening week range
captures Monday's high and low (or multiple days) and extends those levels through Friday for weekly breakout reference.
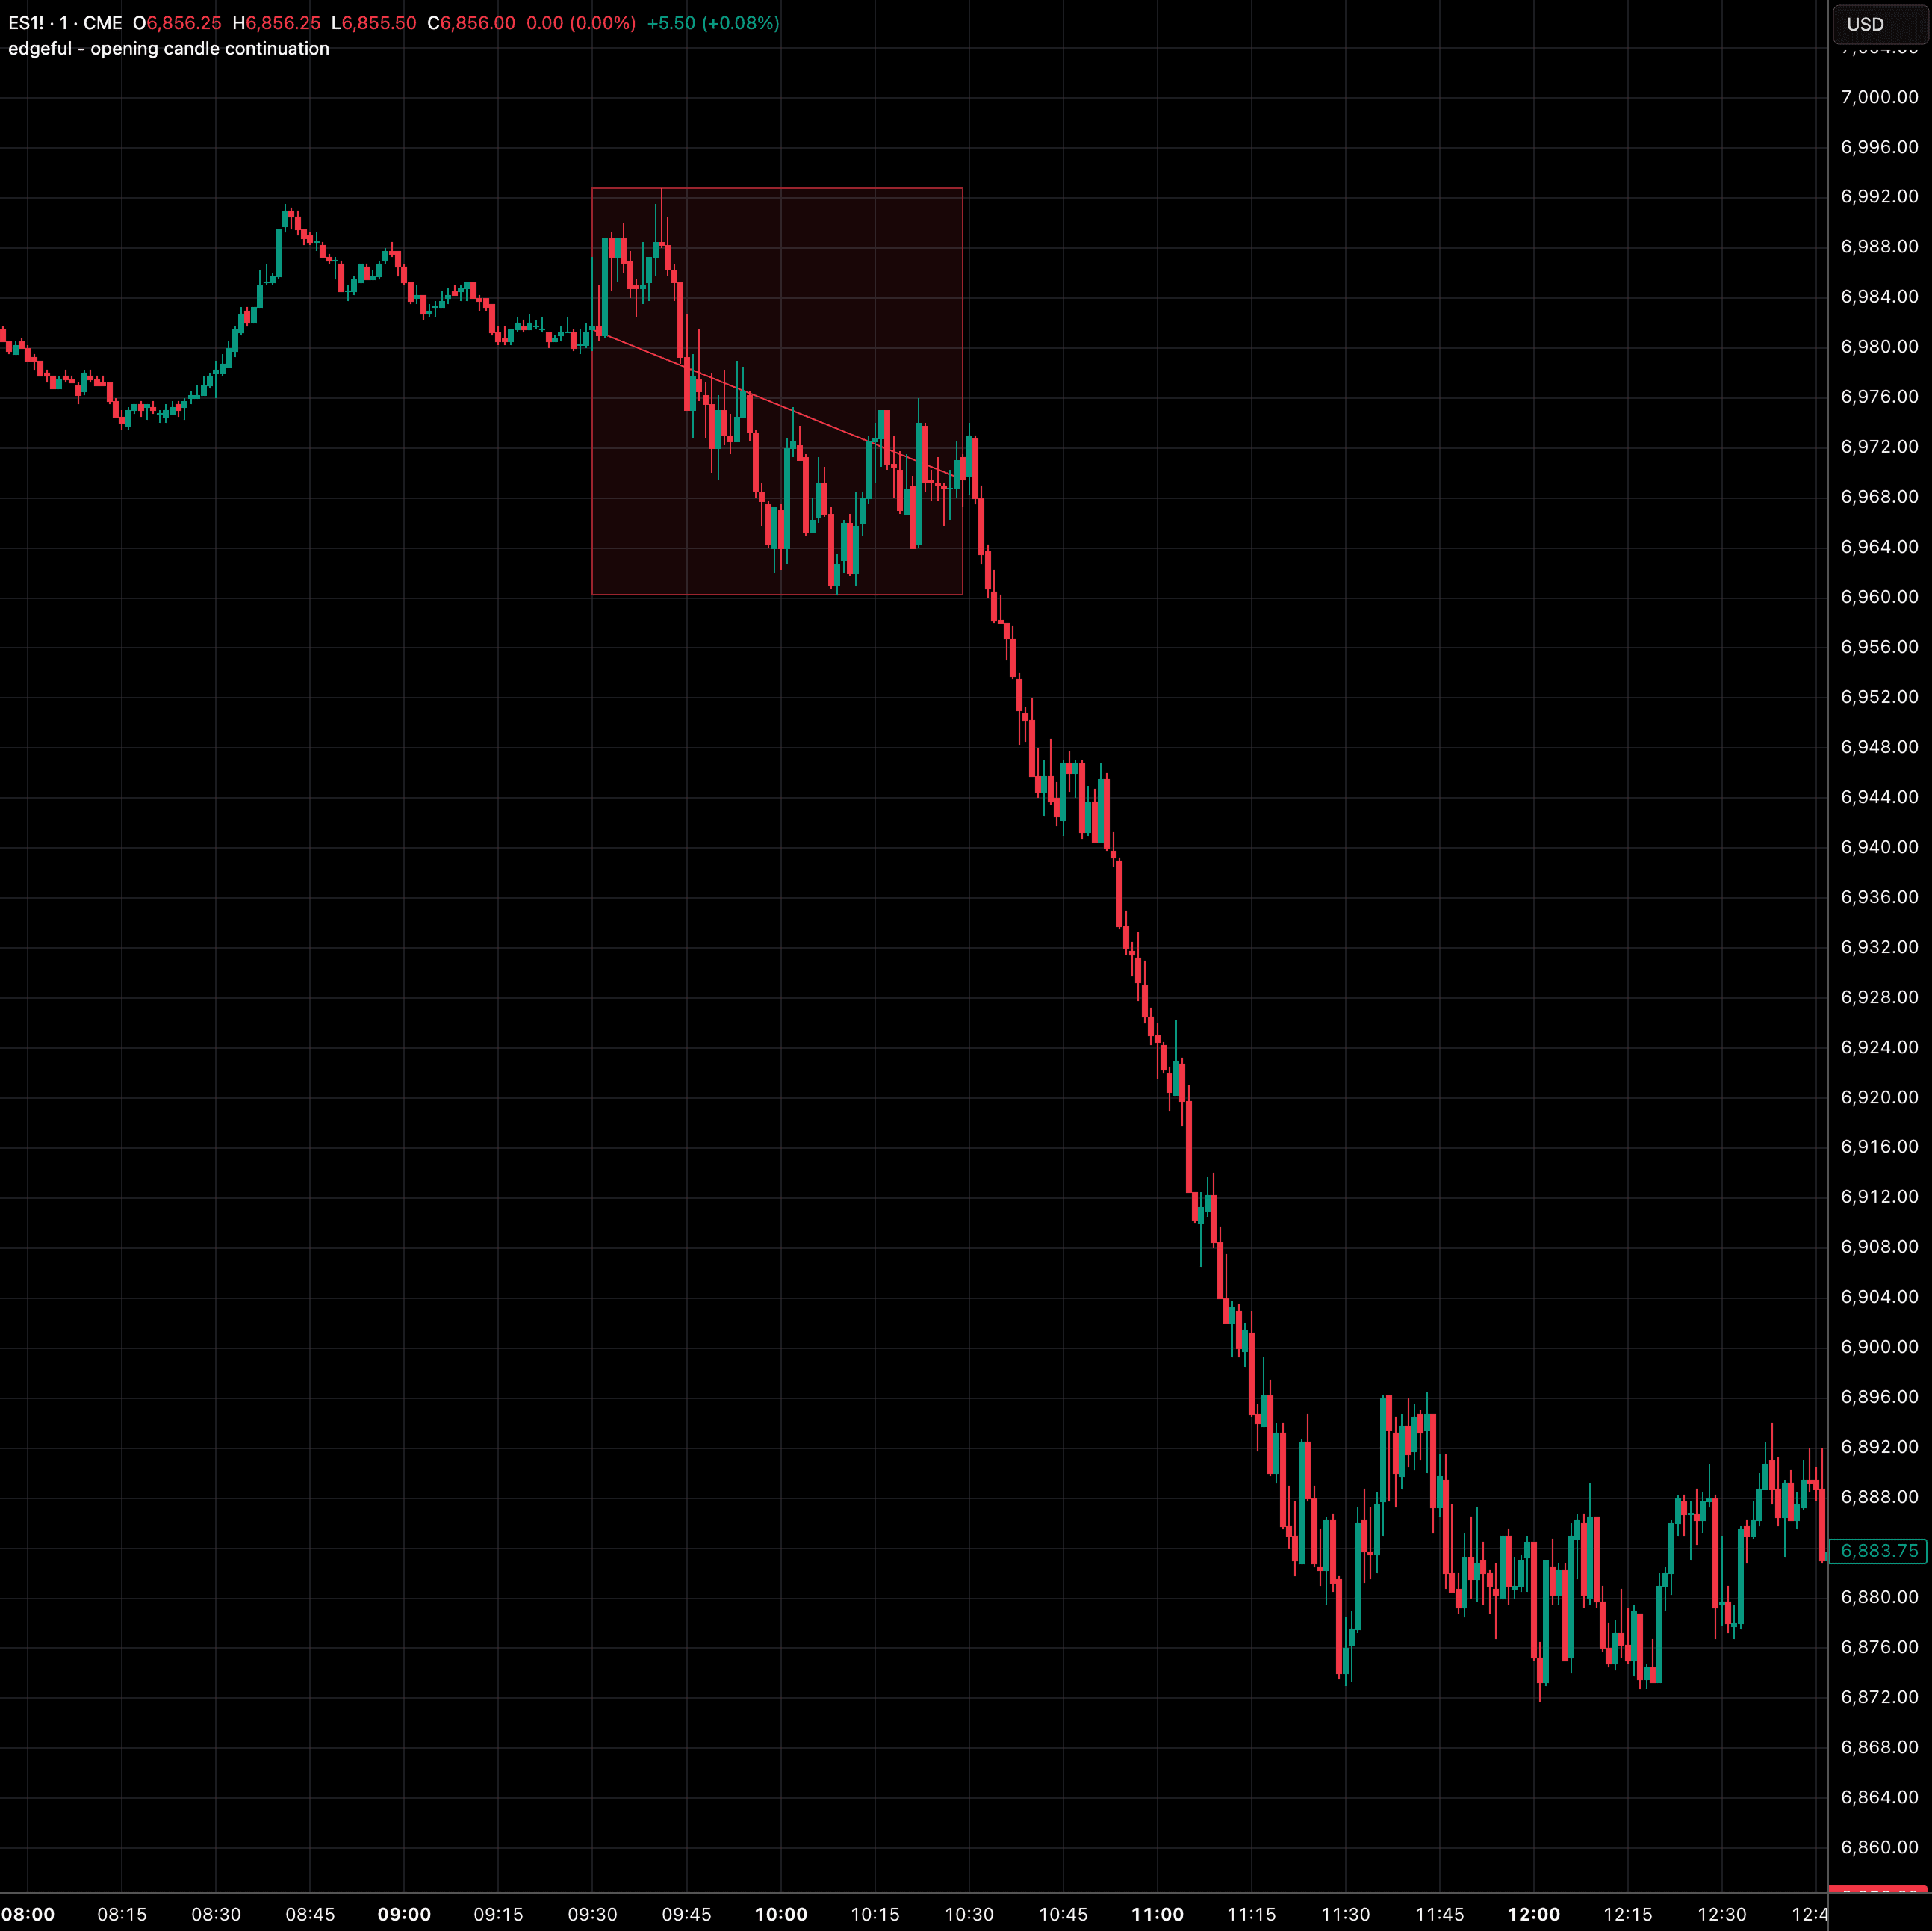
opening candle continuation
popular
auto-plots the first hour's price action, and then automatically classifies the candle as bullish or bearish to help you determine your bias for the rest of the session.
session & time
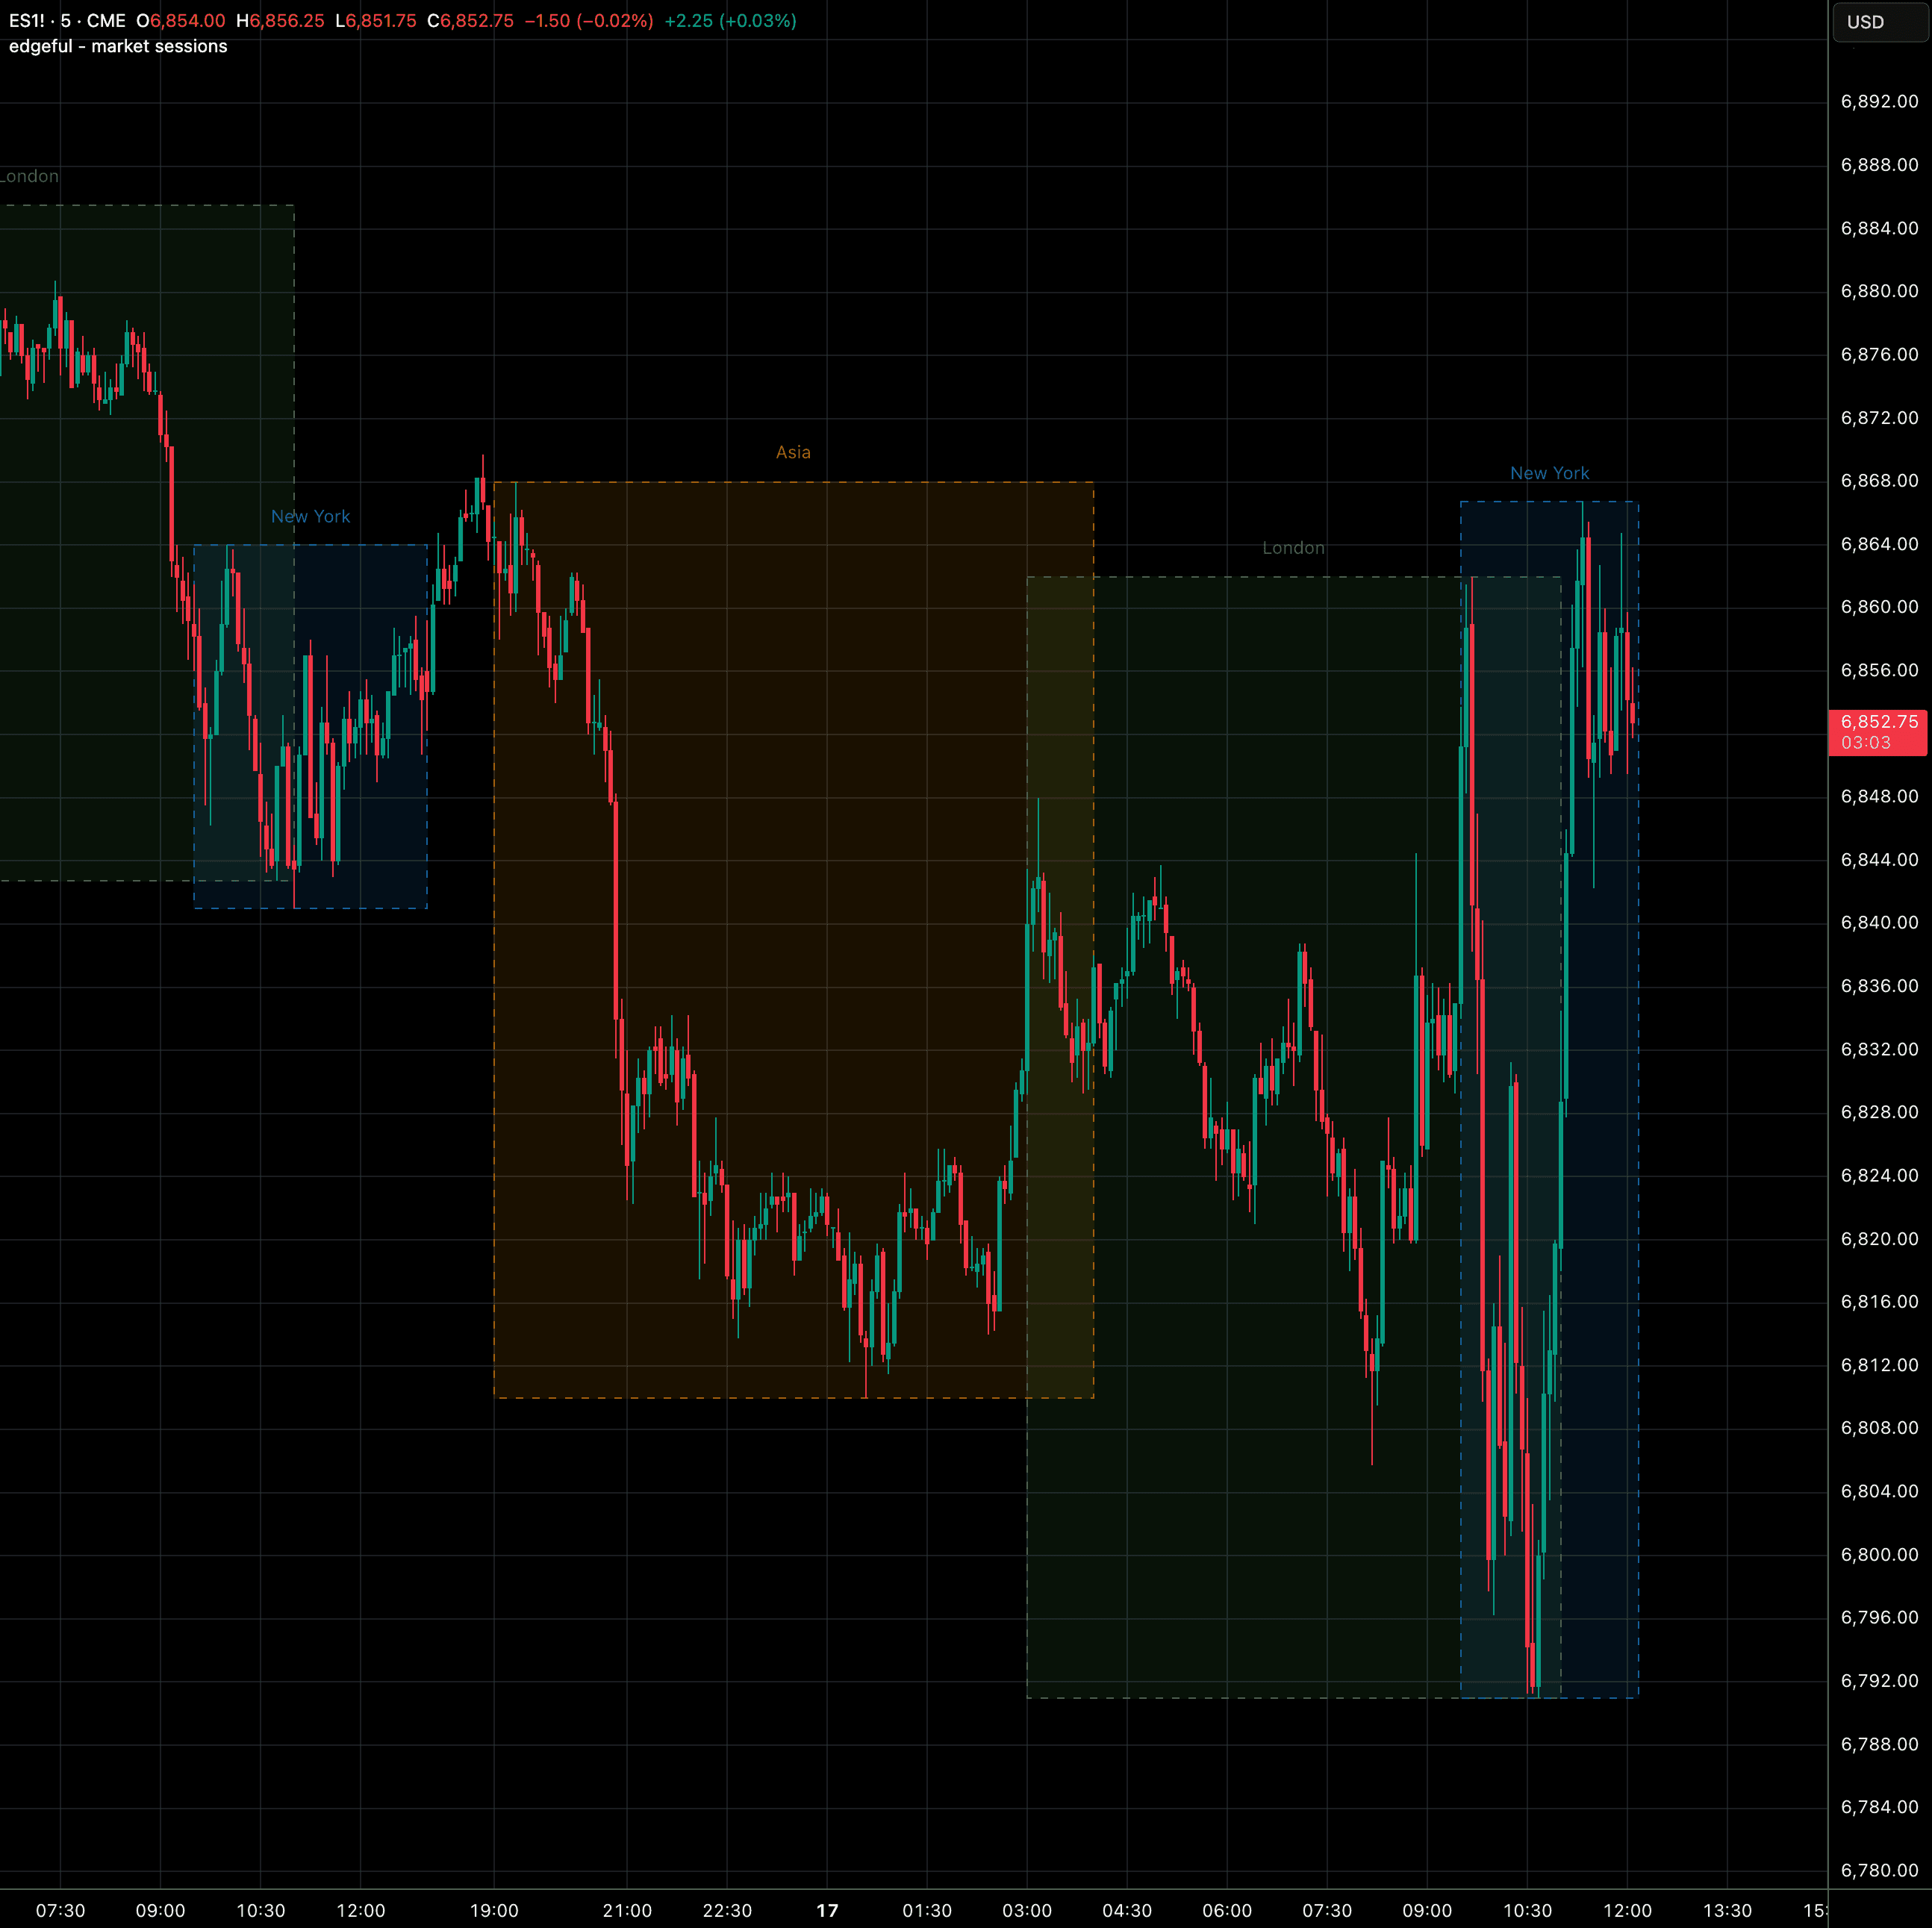
market sessions
popular
auto-plots session boxes for Asia, London, New York, and Sydney so you can easily view price action in each session.
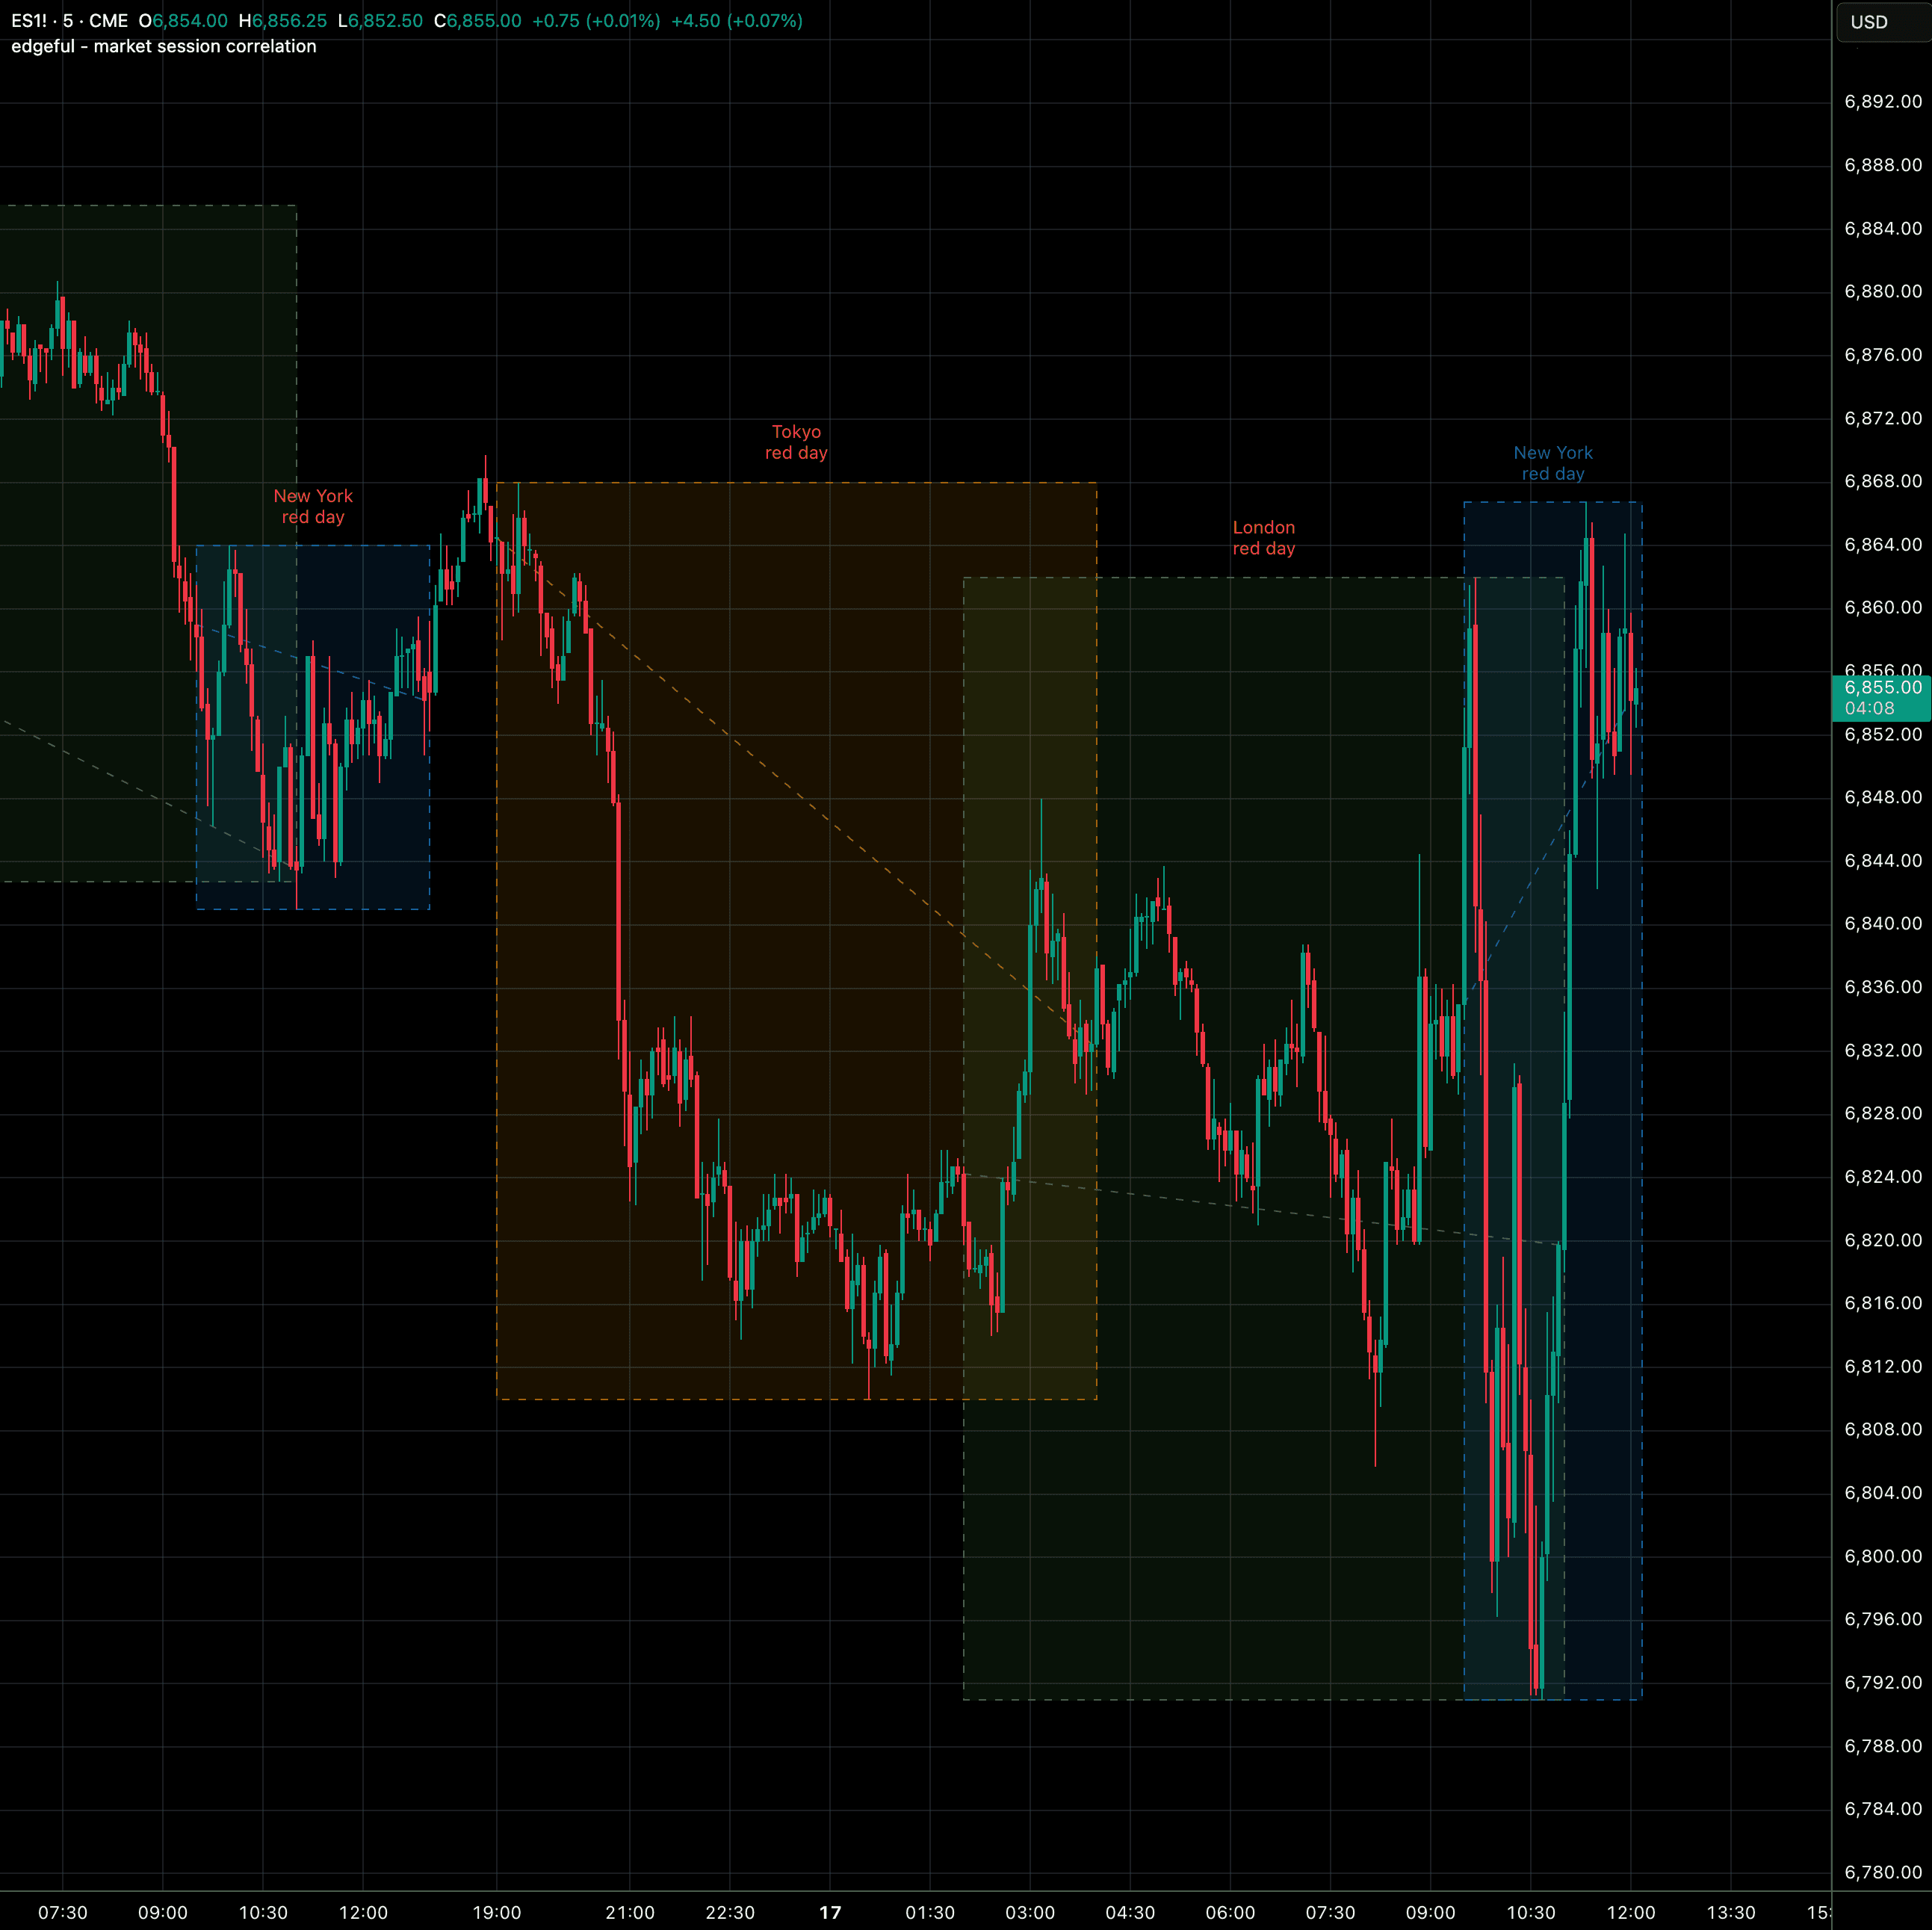
market session correlation
labels each session as green or red at close so you can spot directional patterns across global sessions.
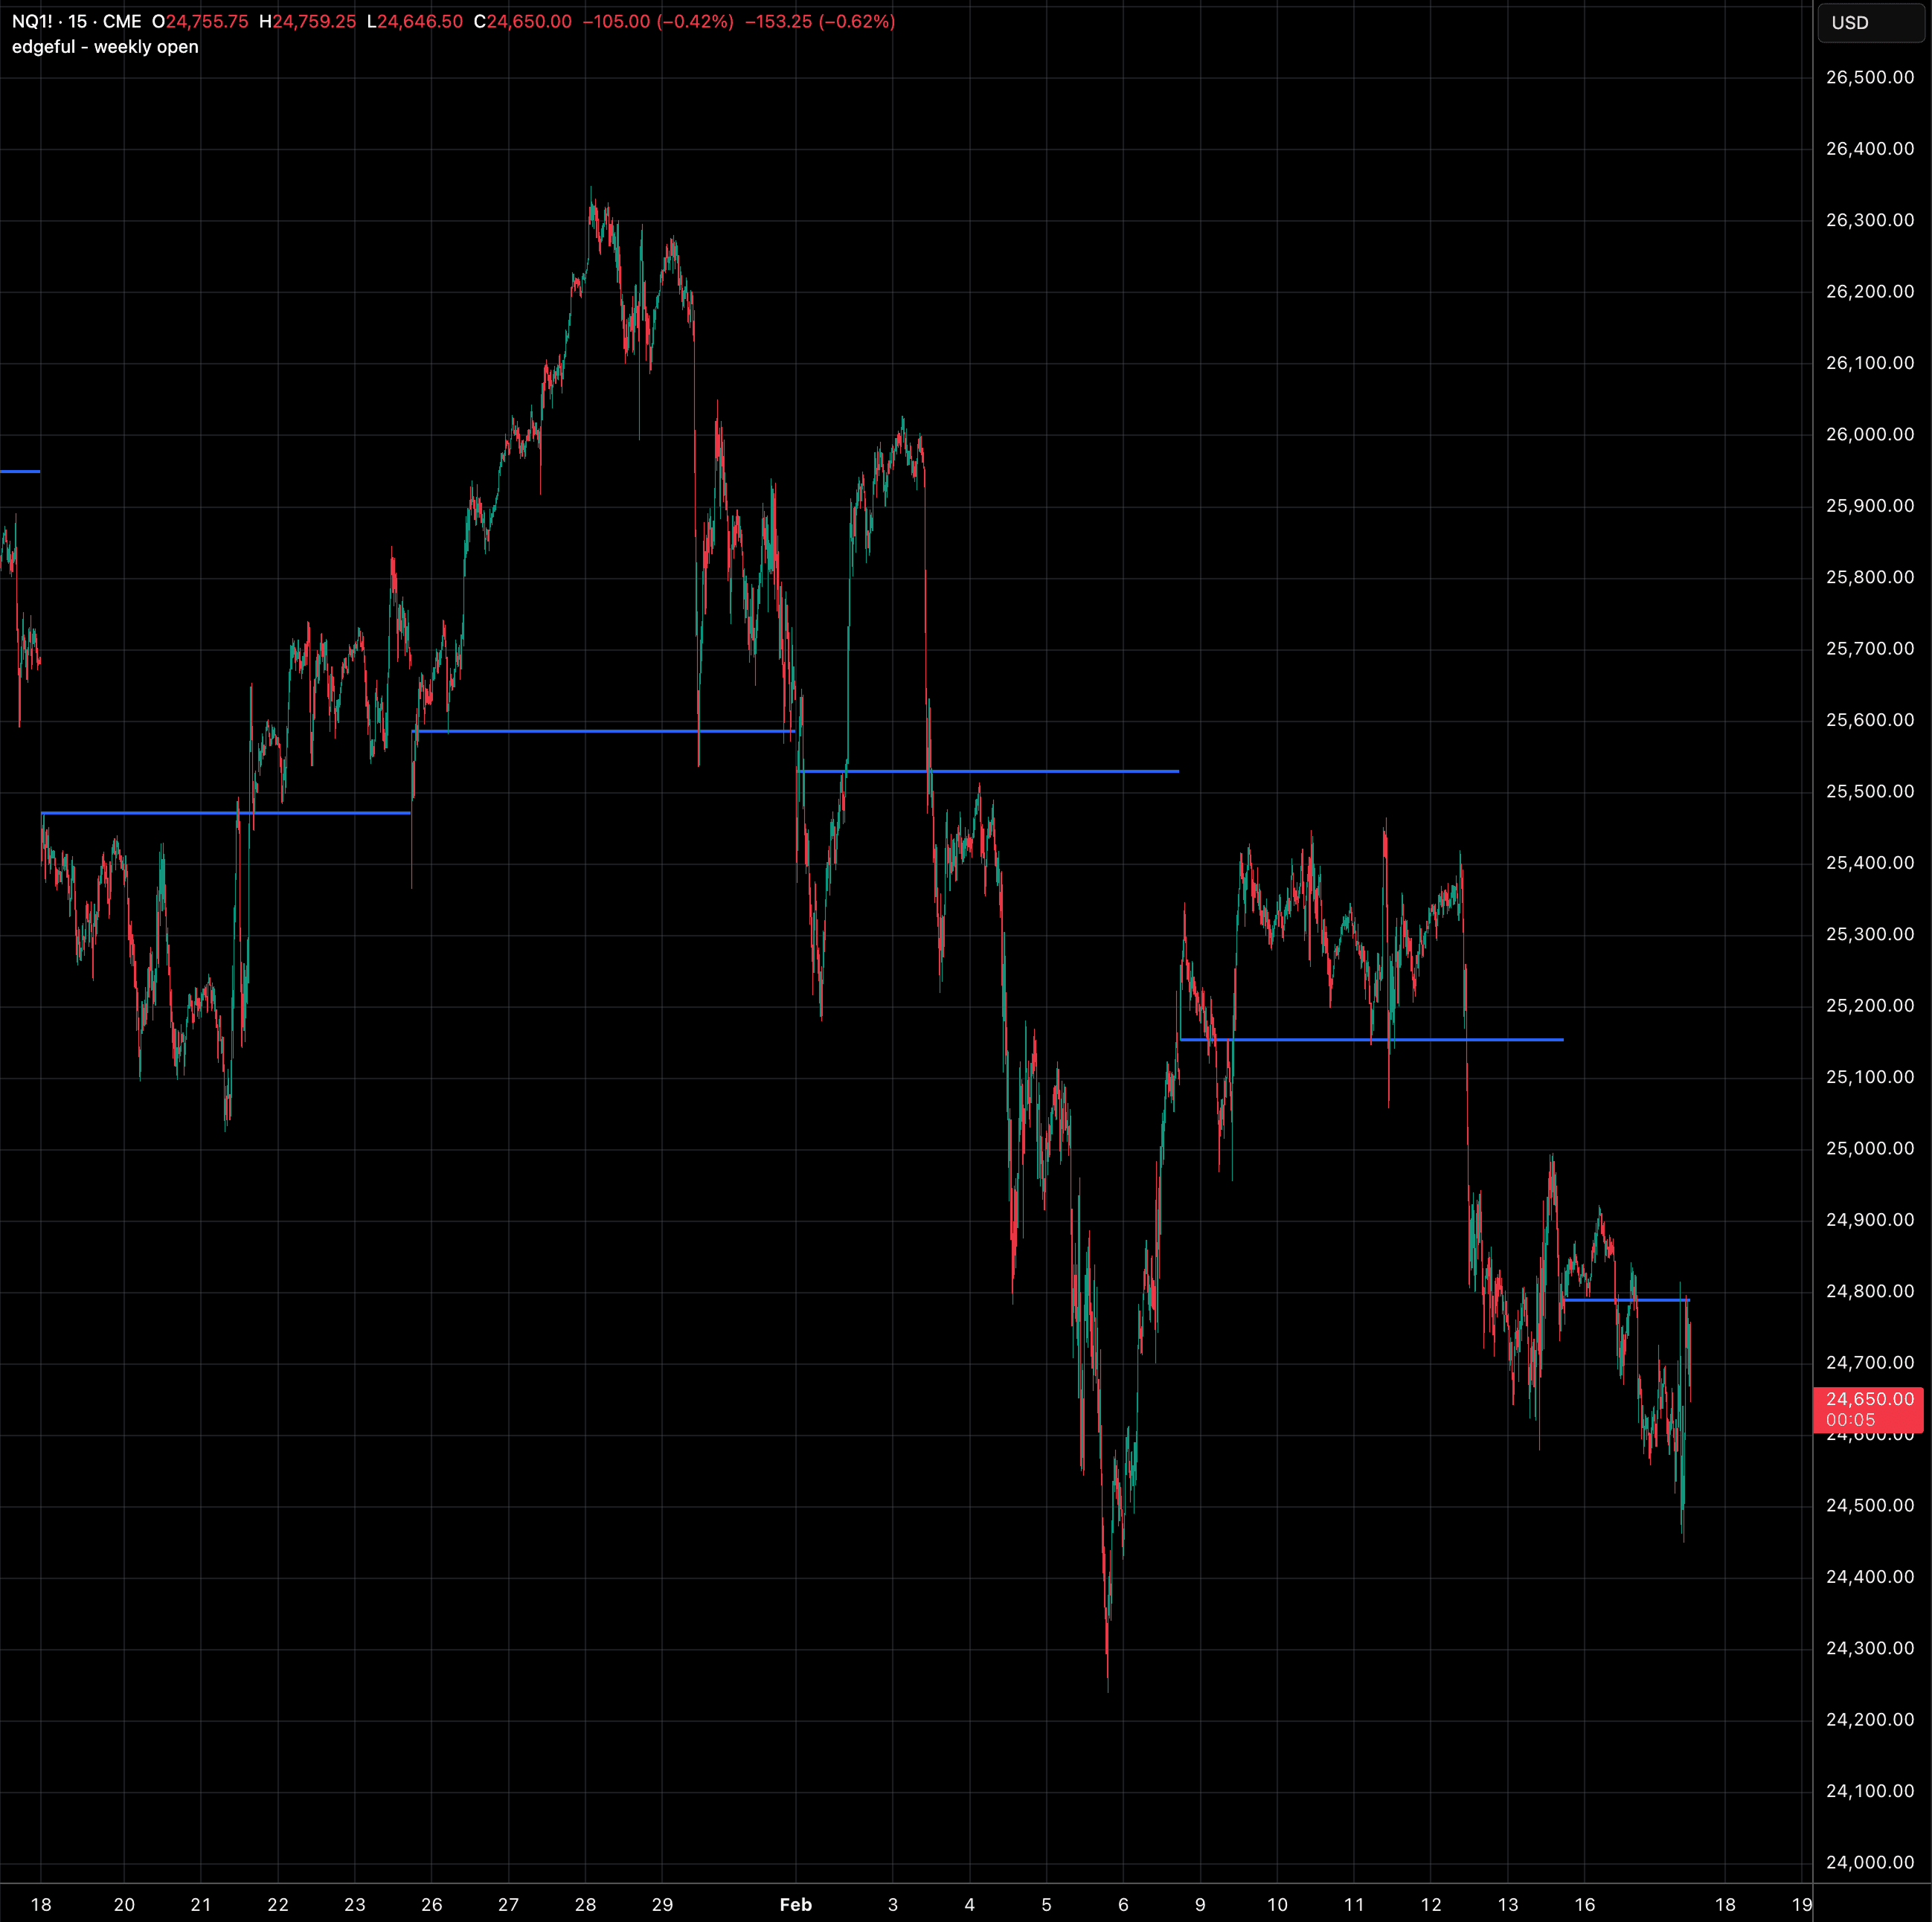
weekly open
auto-plots the weekly opening price as a horizontal line extending all week as a key support and resistance reference.
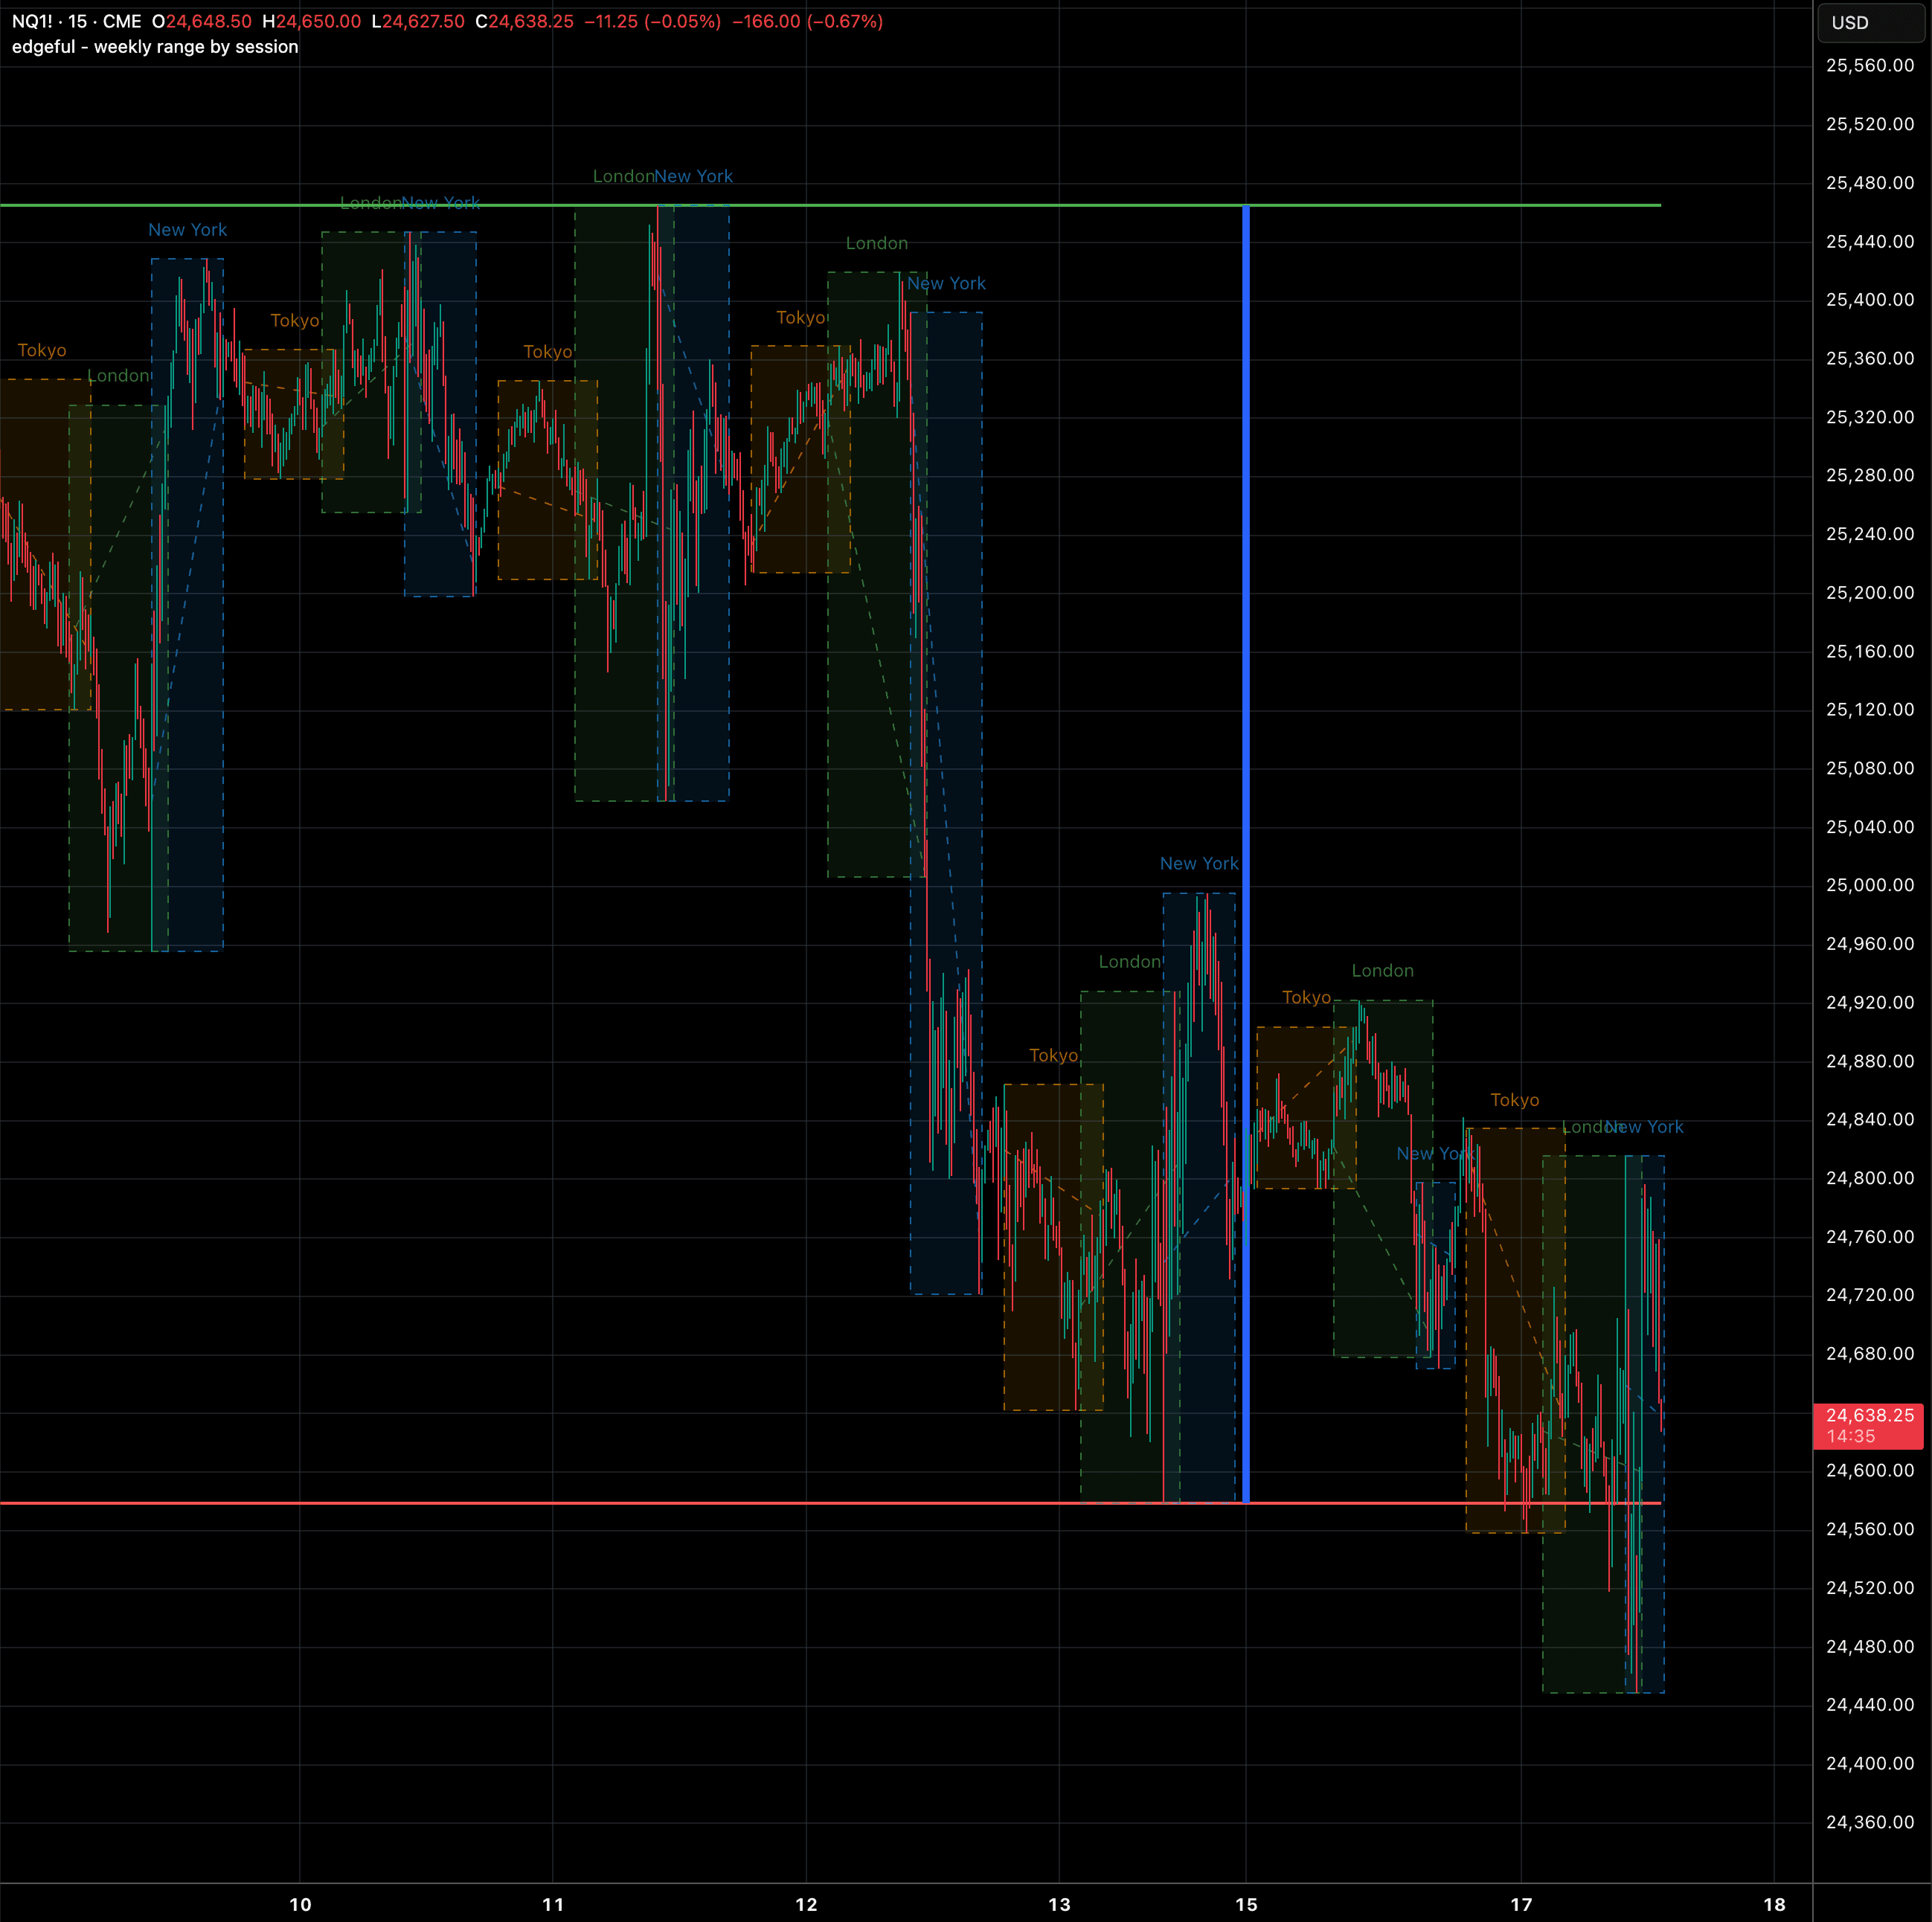
weekly range by session
auto-plots last week's session-specific high and low as reference levels for your current trading week.
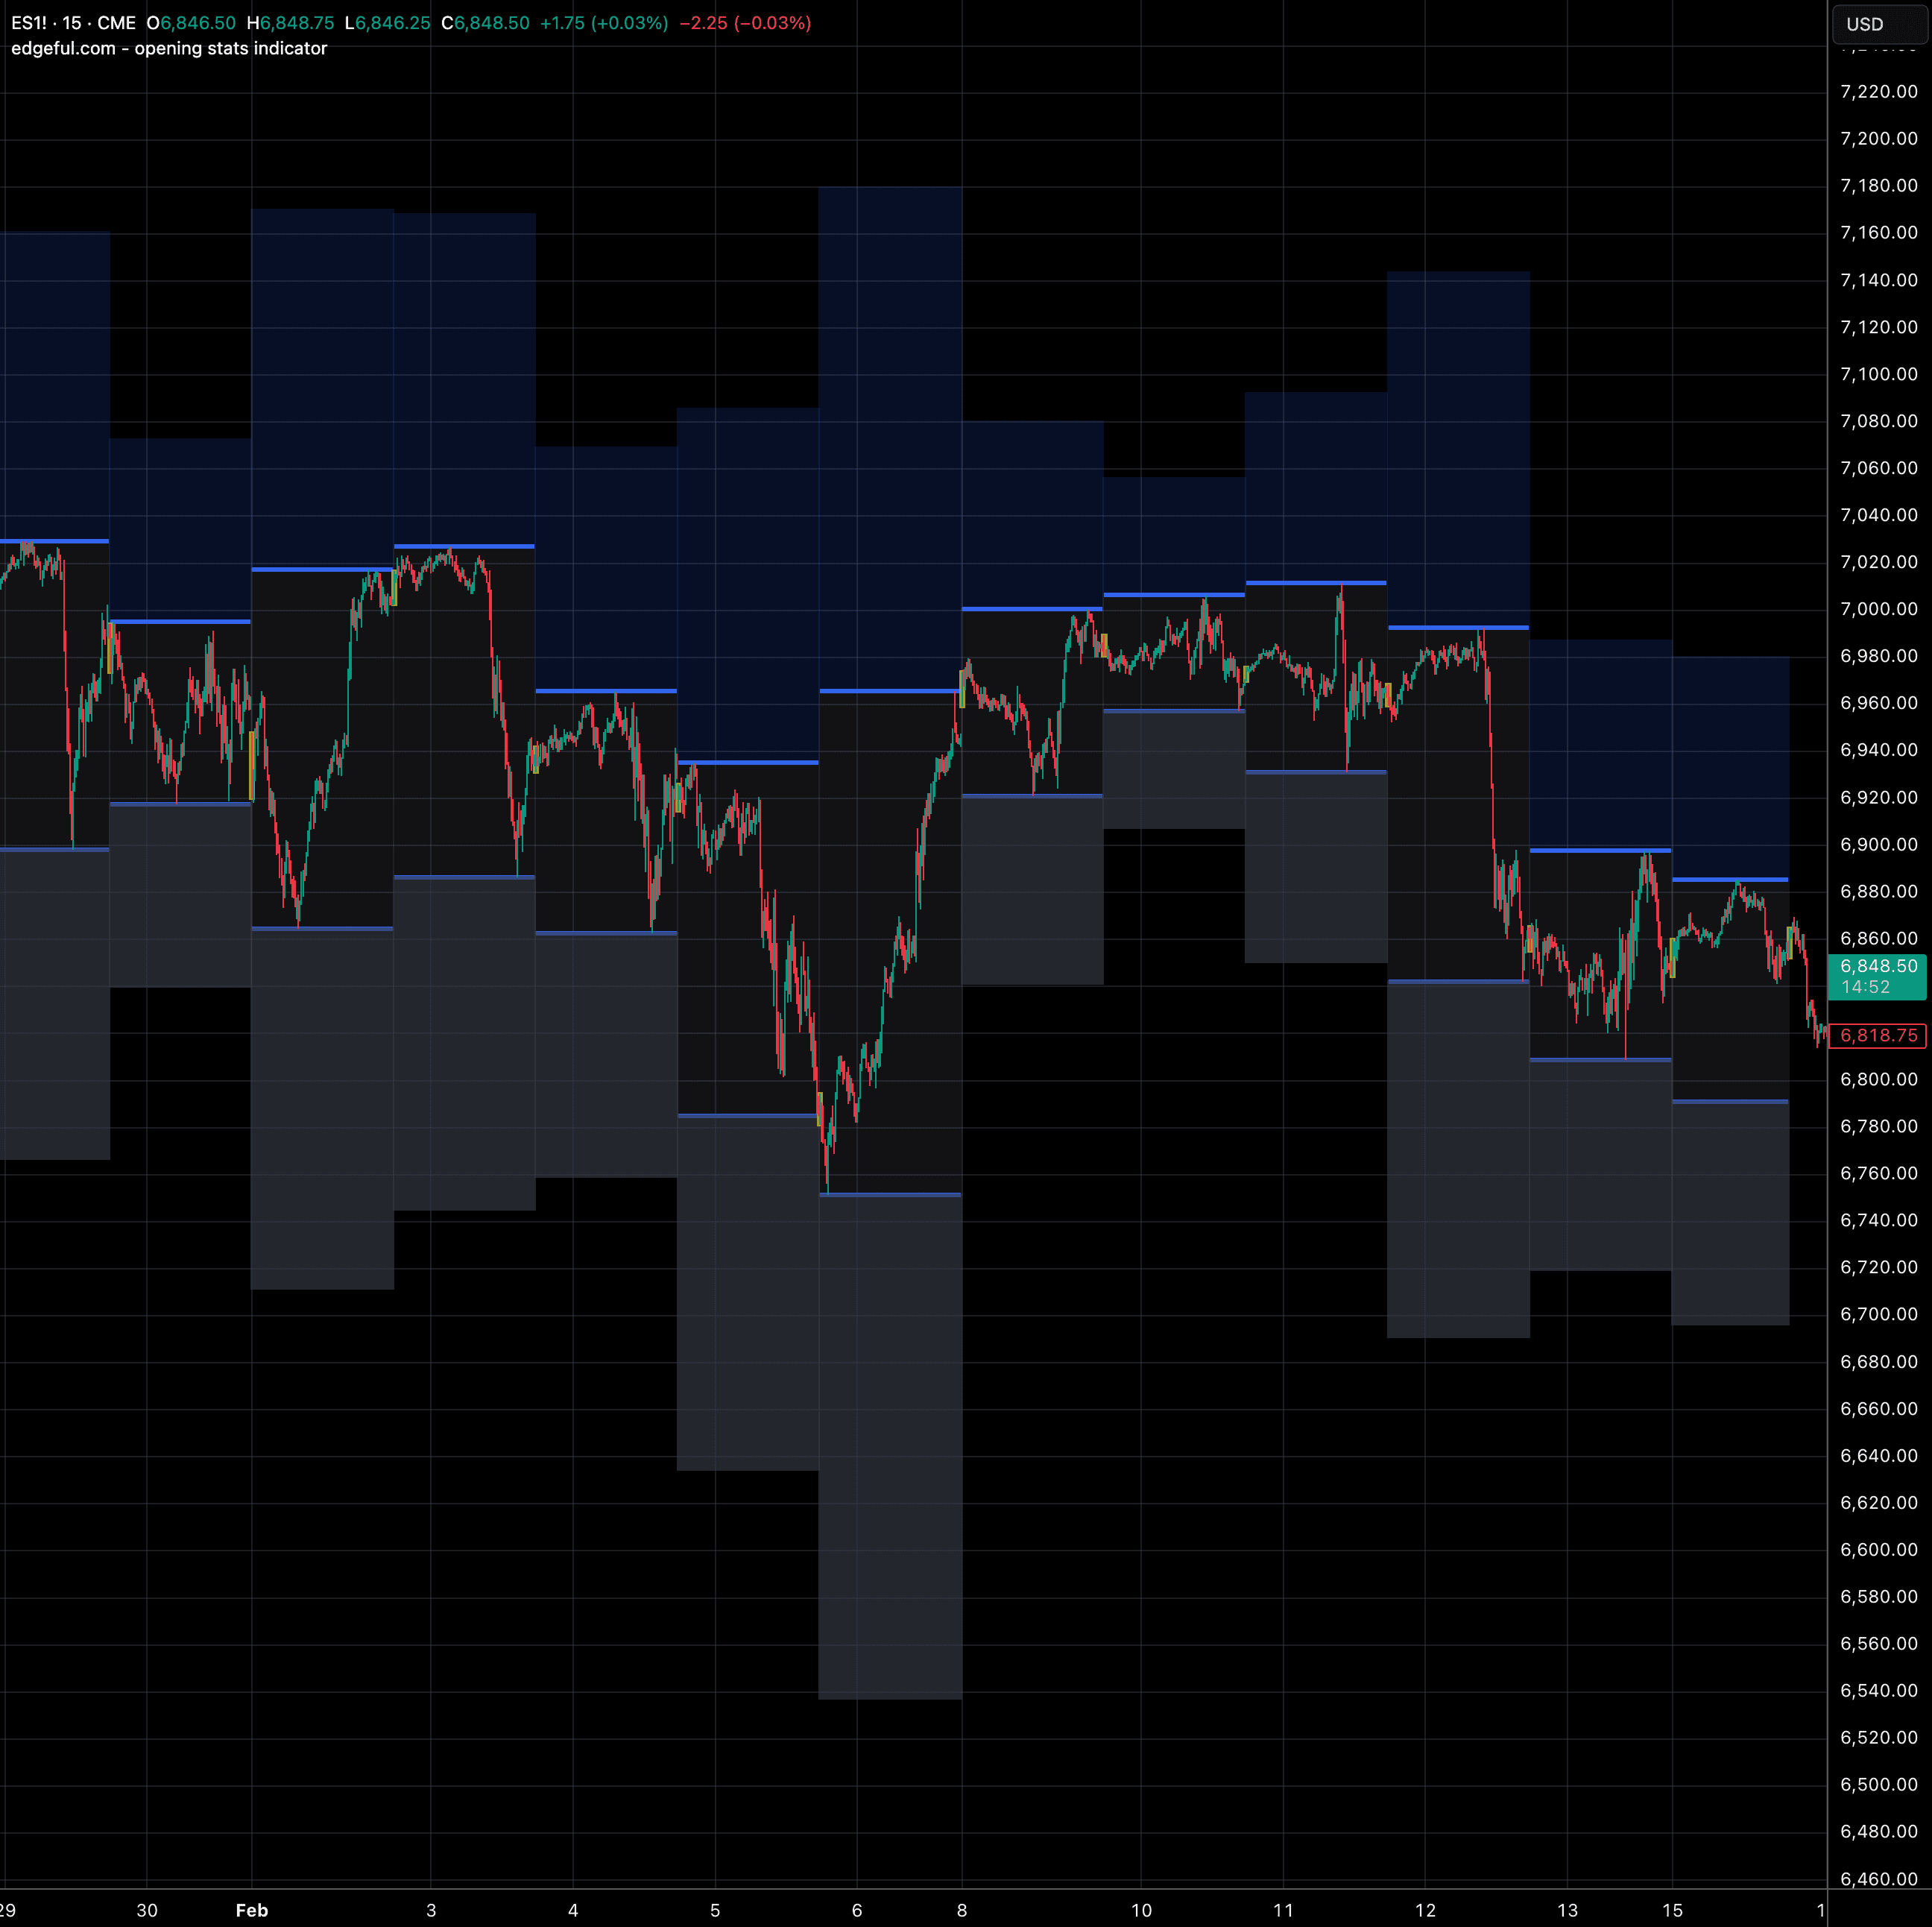
opening stats
auto-plots daily range zones with extension boxes projecting potential price targets above and below the day's range.
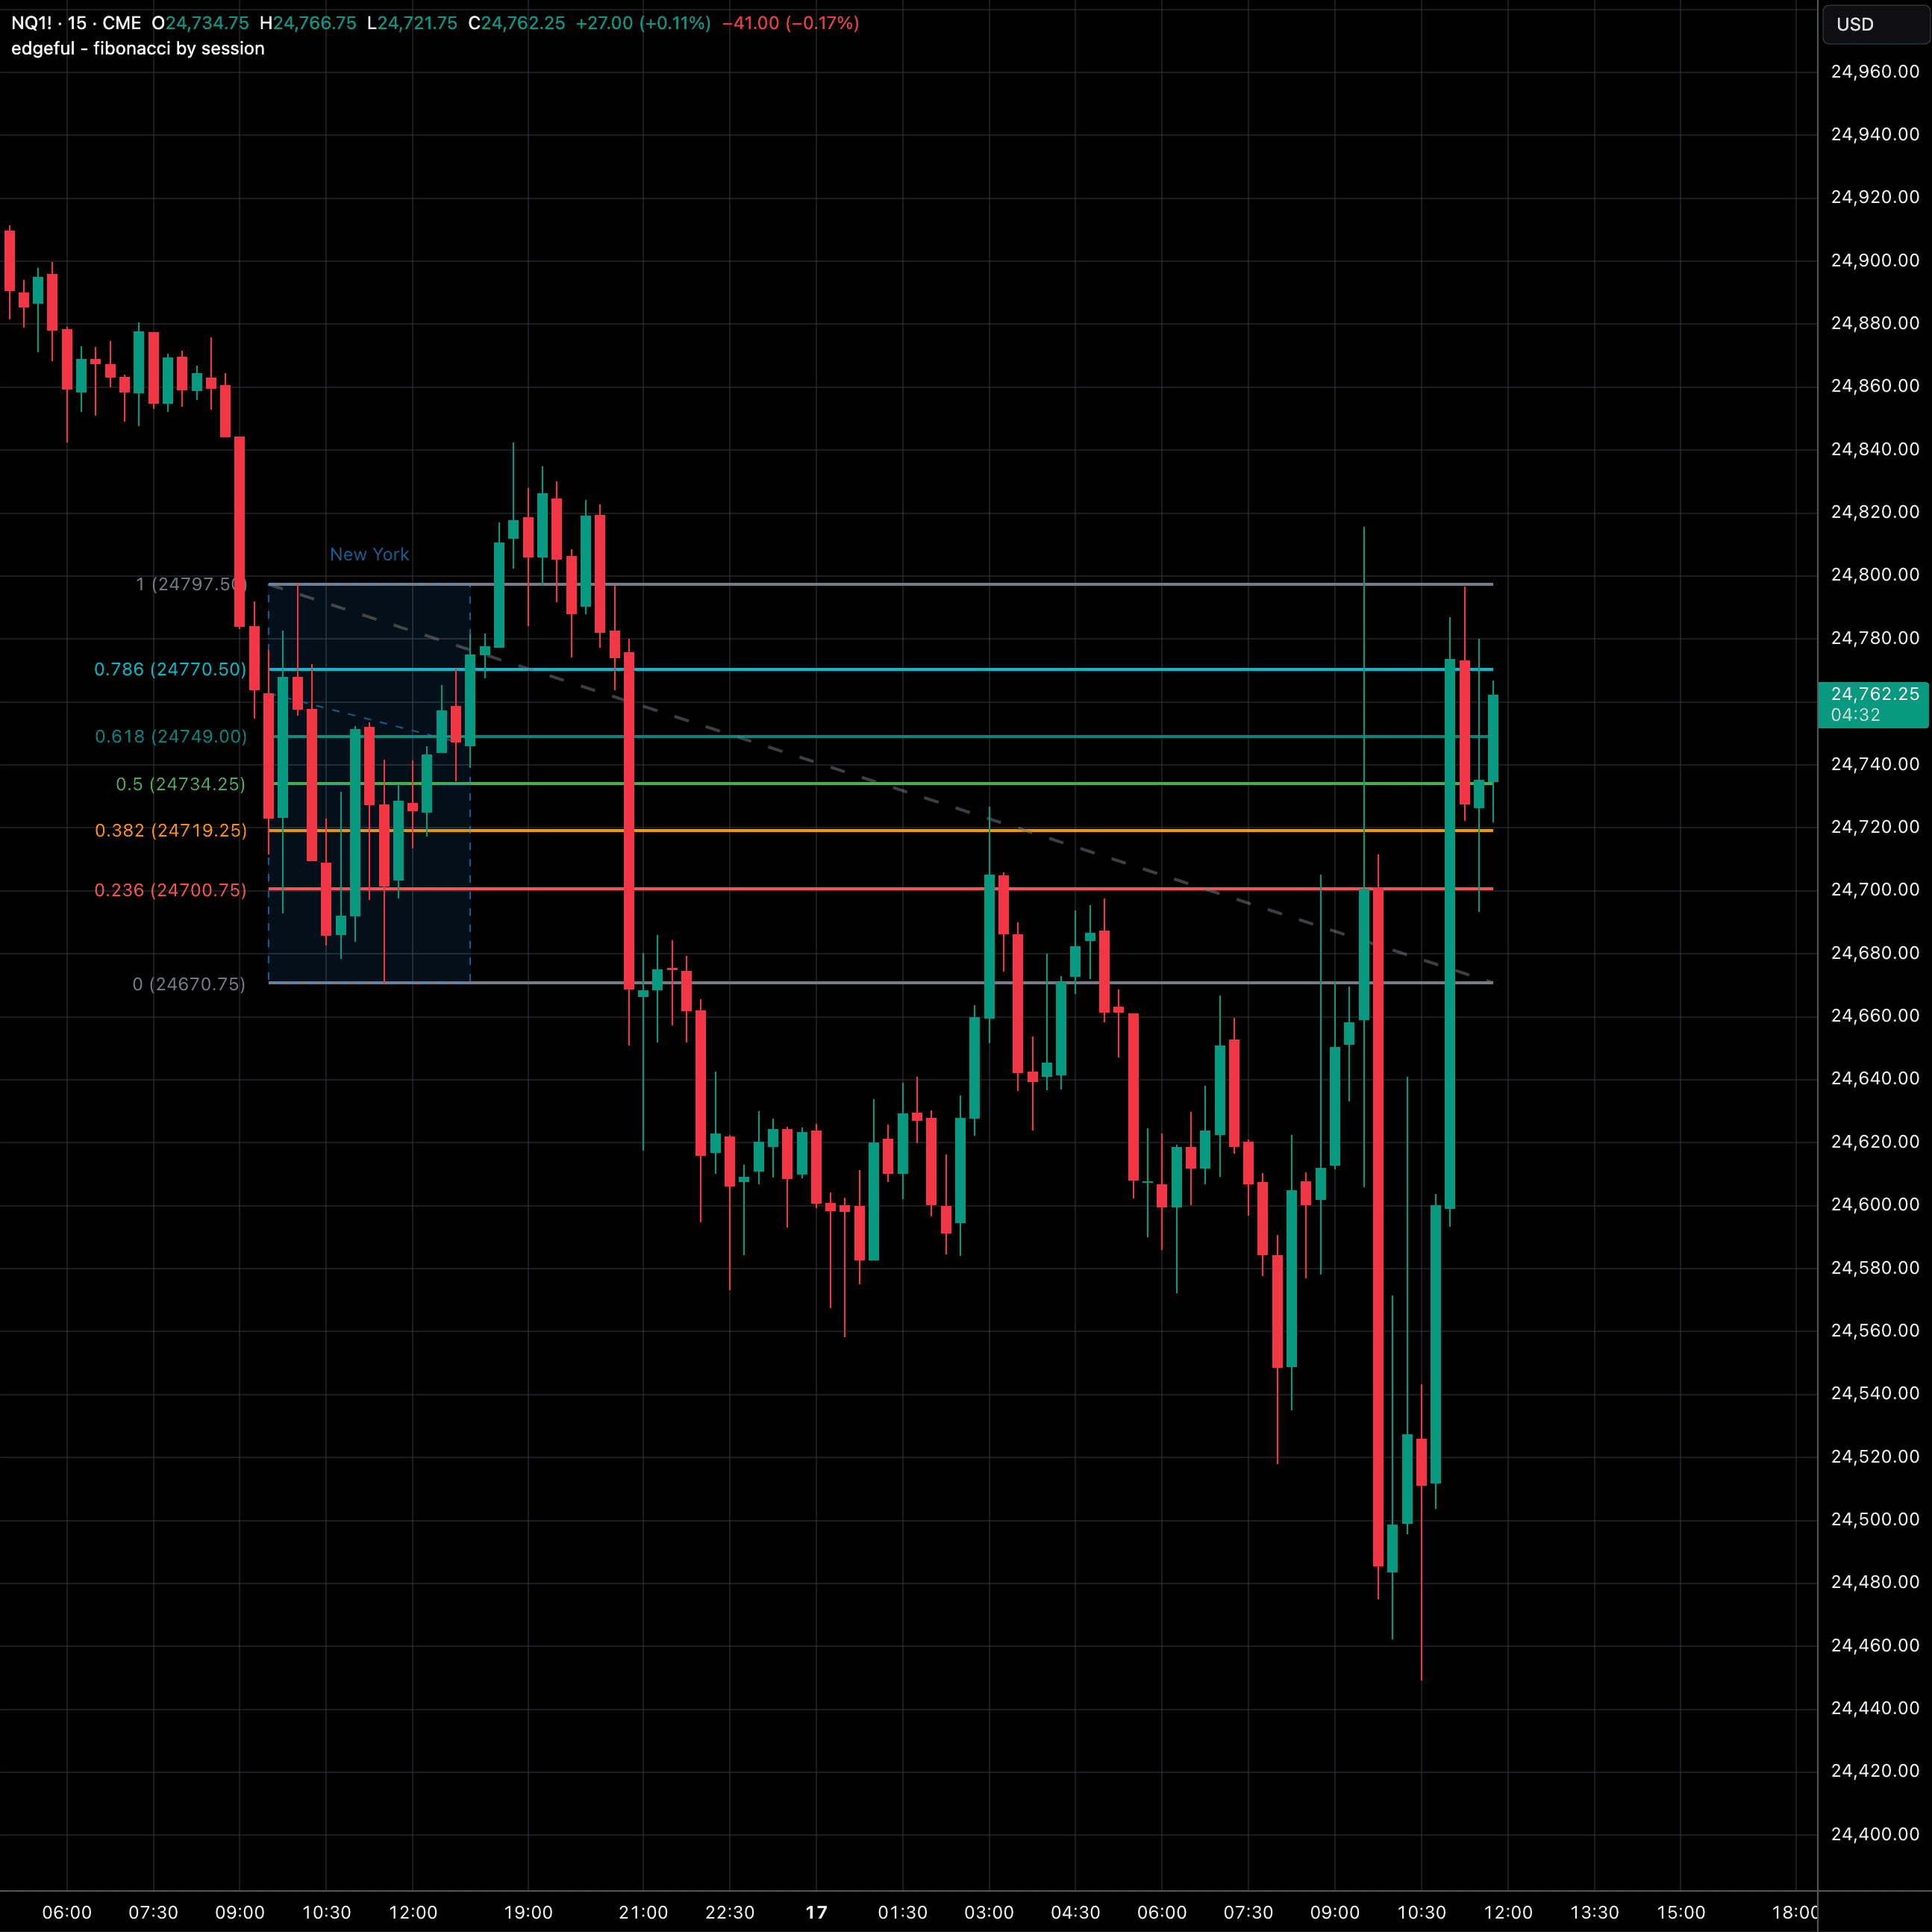
Fibonacci by session
auto-draws 10 Fibonacci retracement levels from your session's high and low for Tokyo, London, NY, or Sydney.
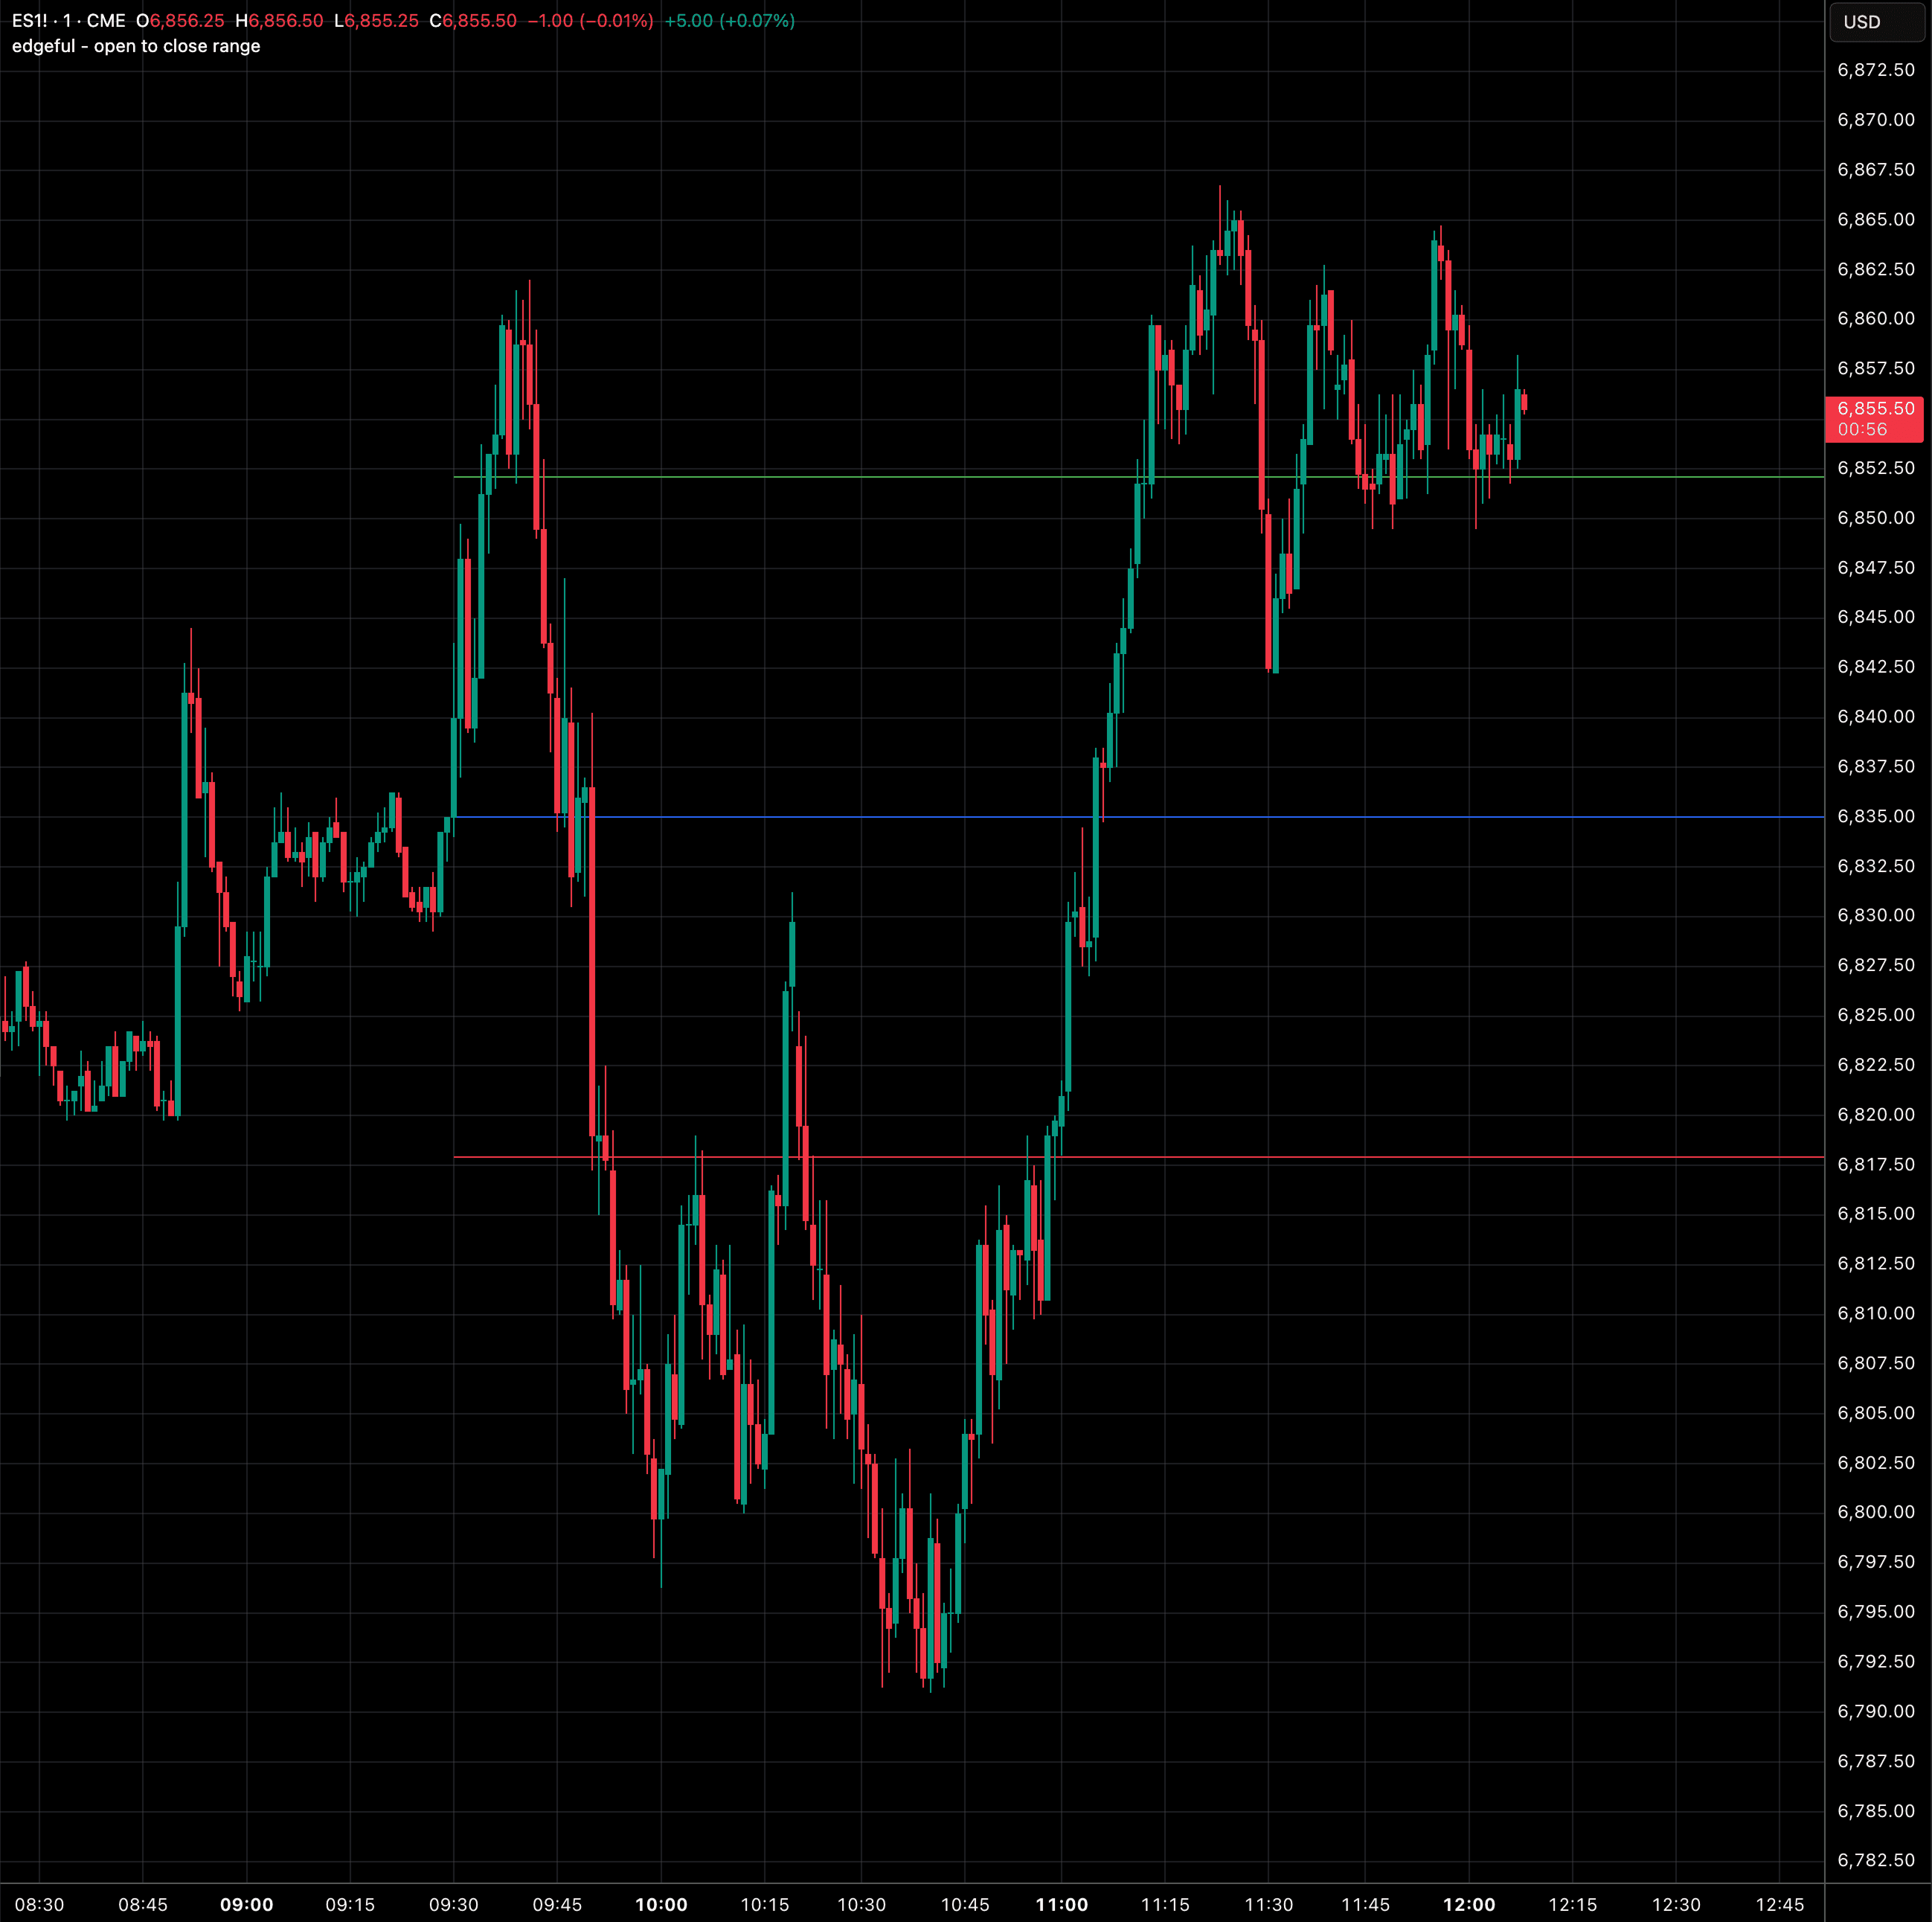
open to close range
auto-plots the session open with percentage-based extension levels above and below for intraday range targets.
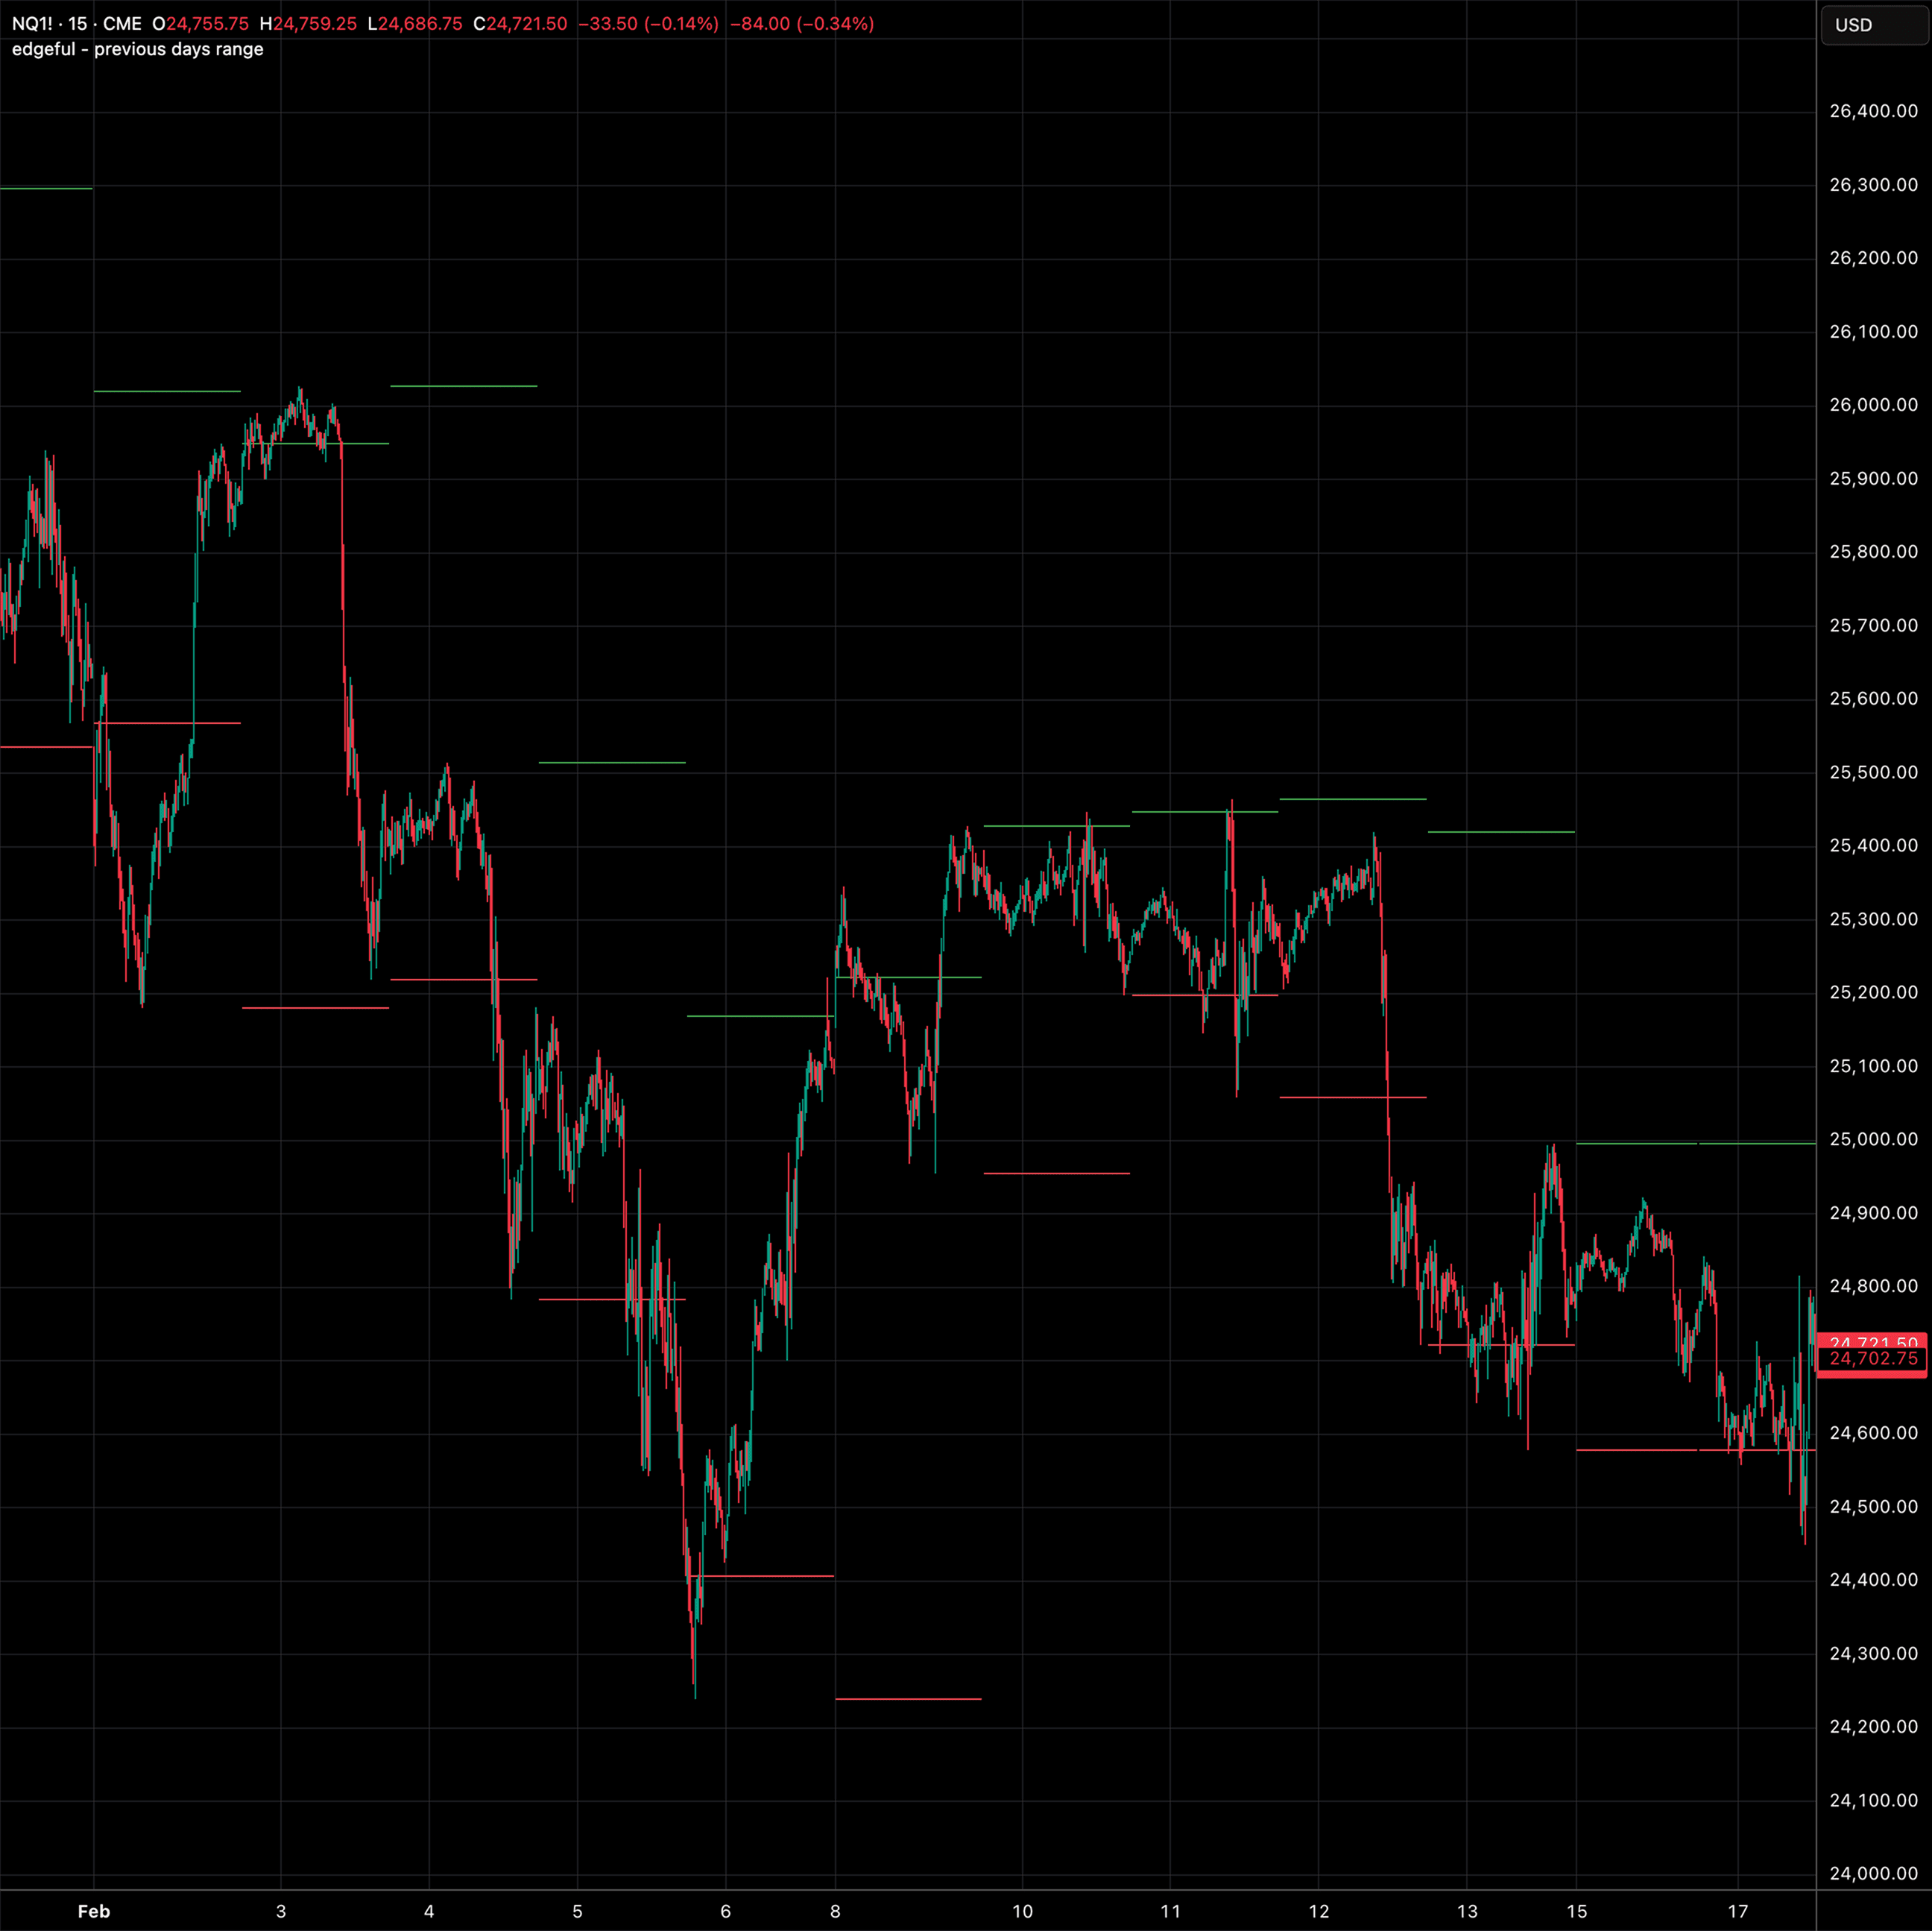
previous range
previous day's range
auto-plots the prior day's high, low, and midpoint as intraday support and resistance levels for any asset class.
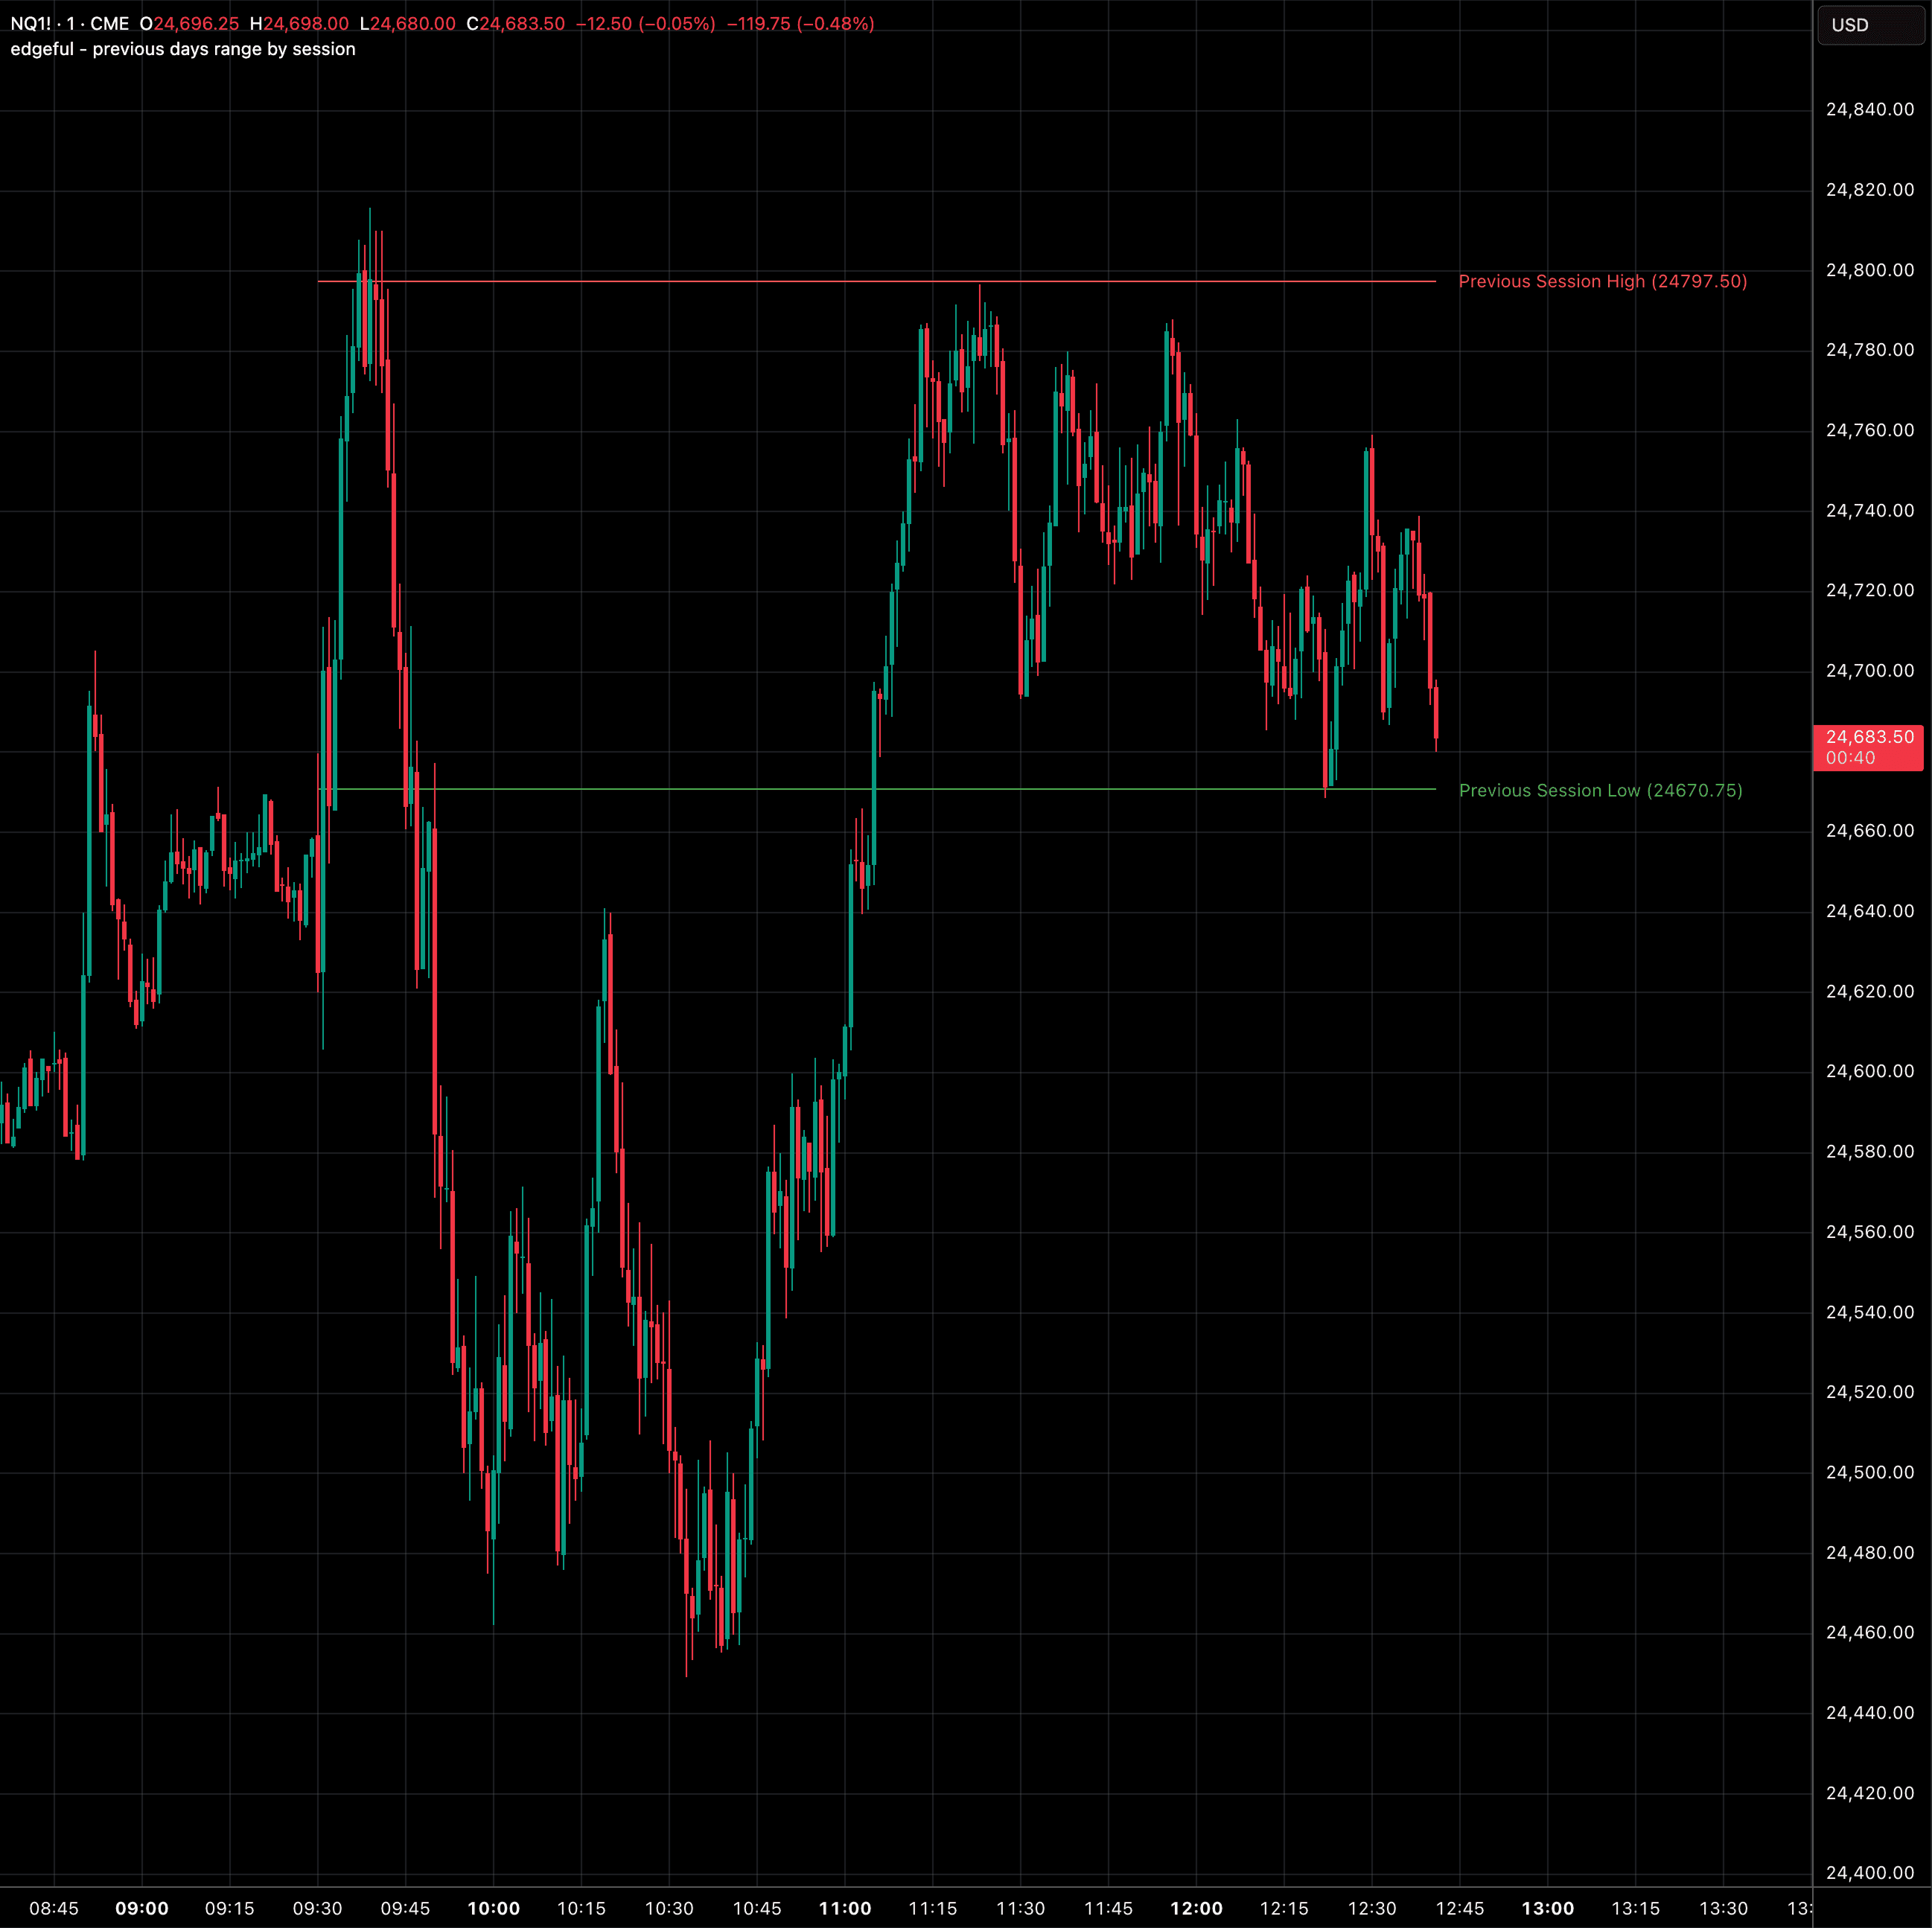
previous day's range by session
auto-plots the prior session's high, low, and midpoint for Tokyo, London, NY, or Sydney sessions.
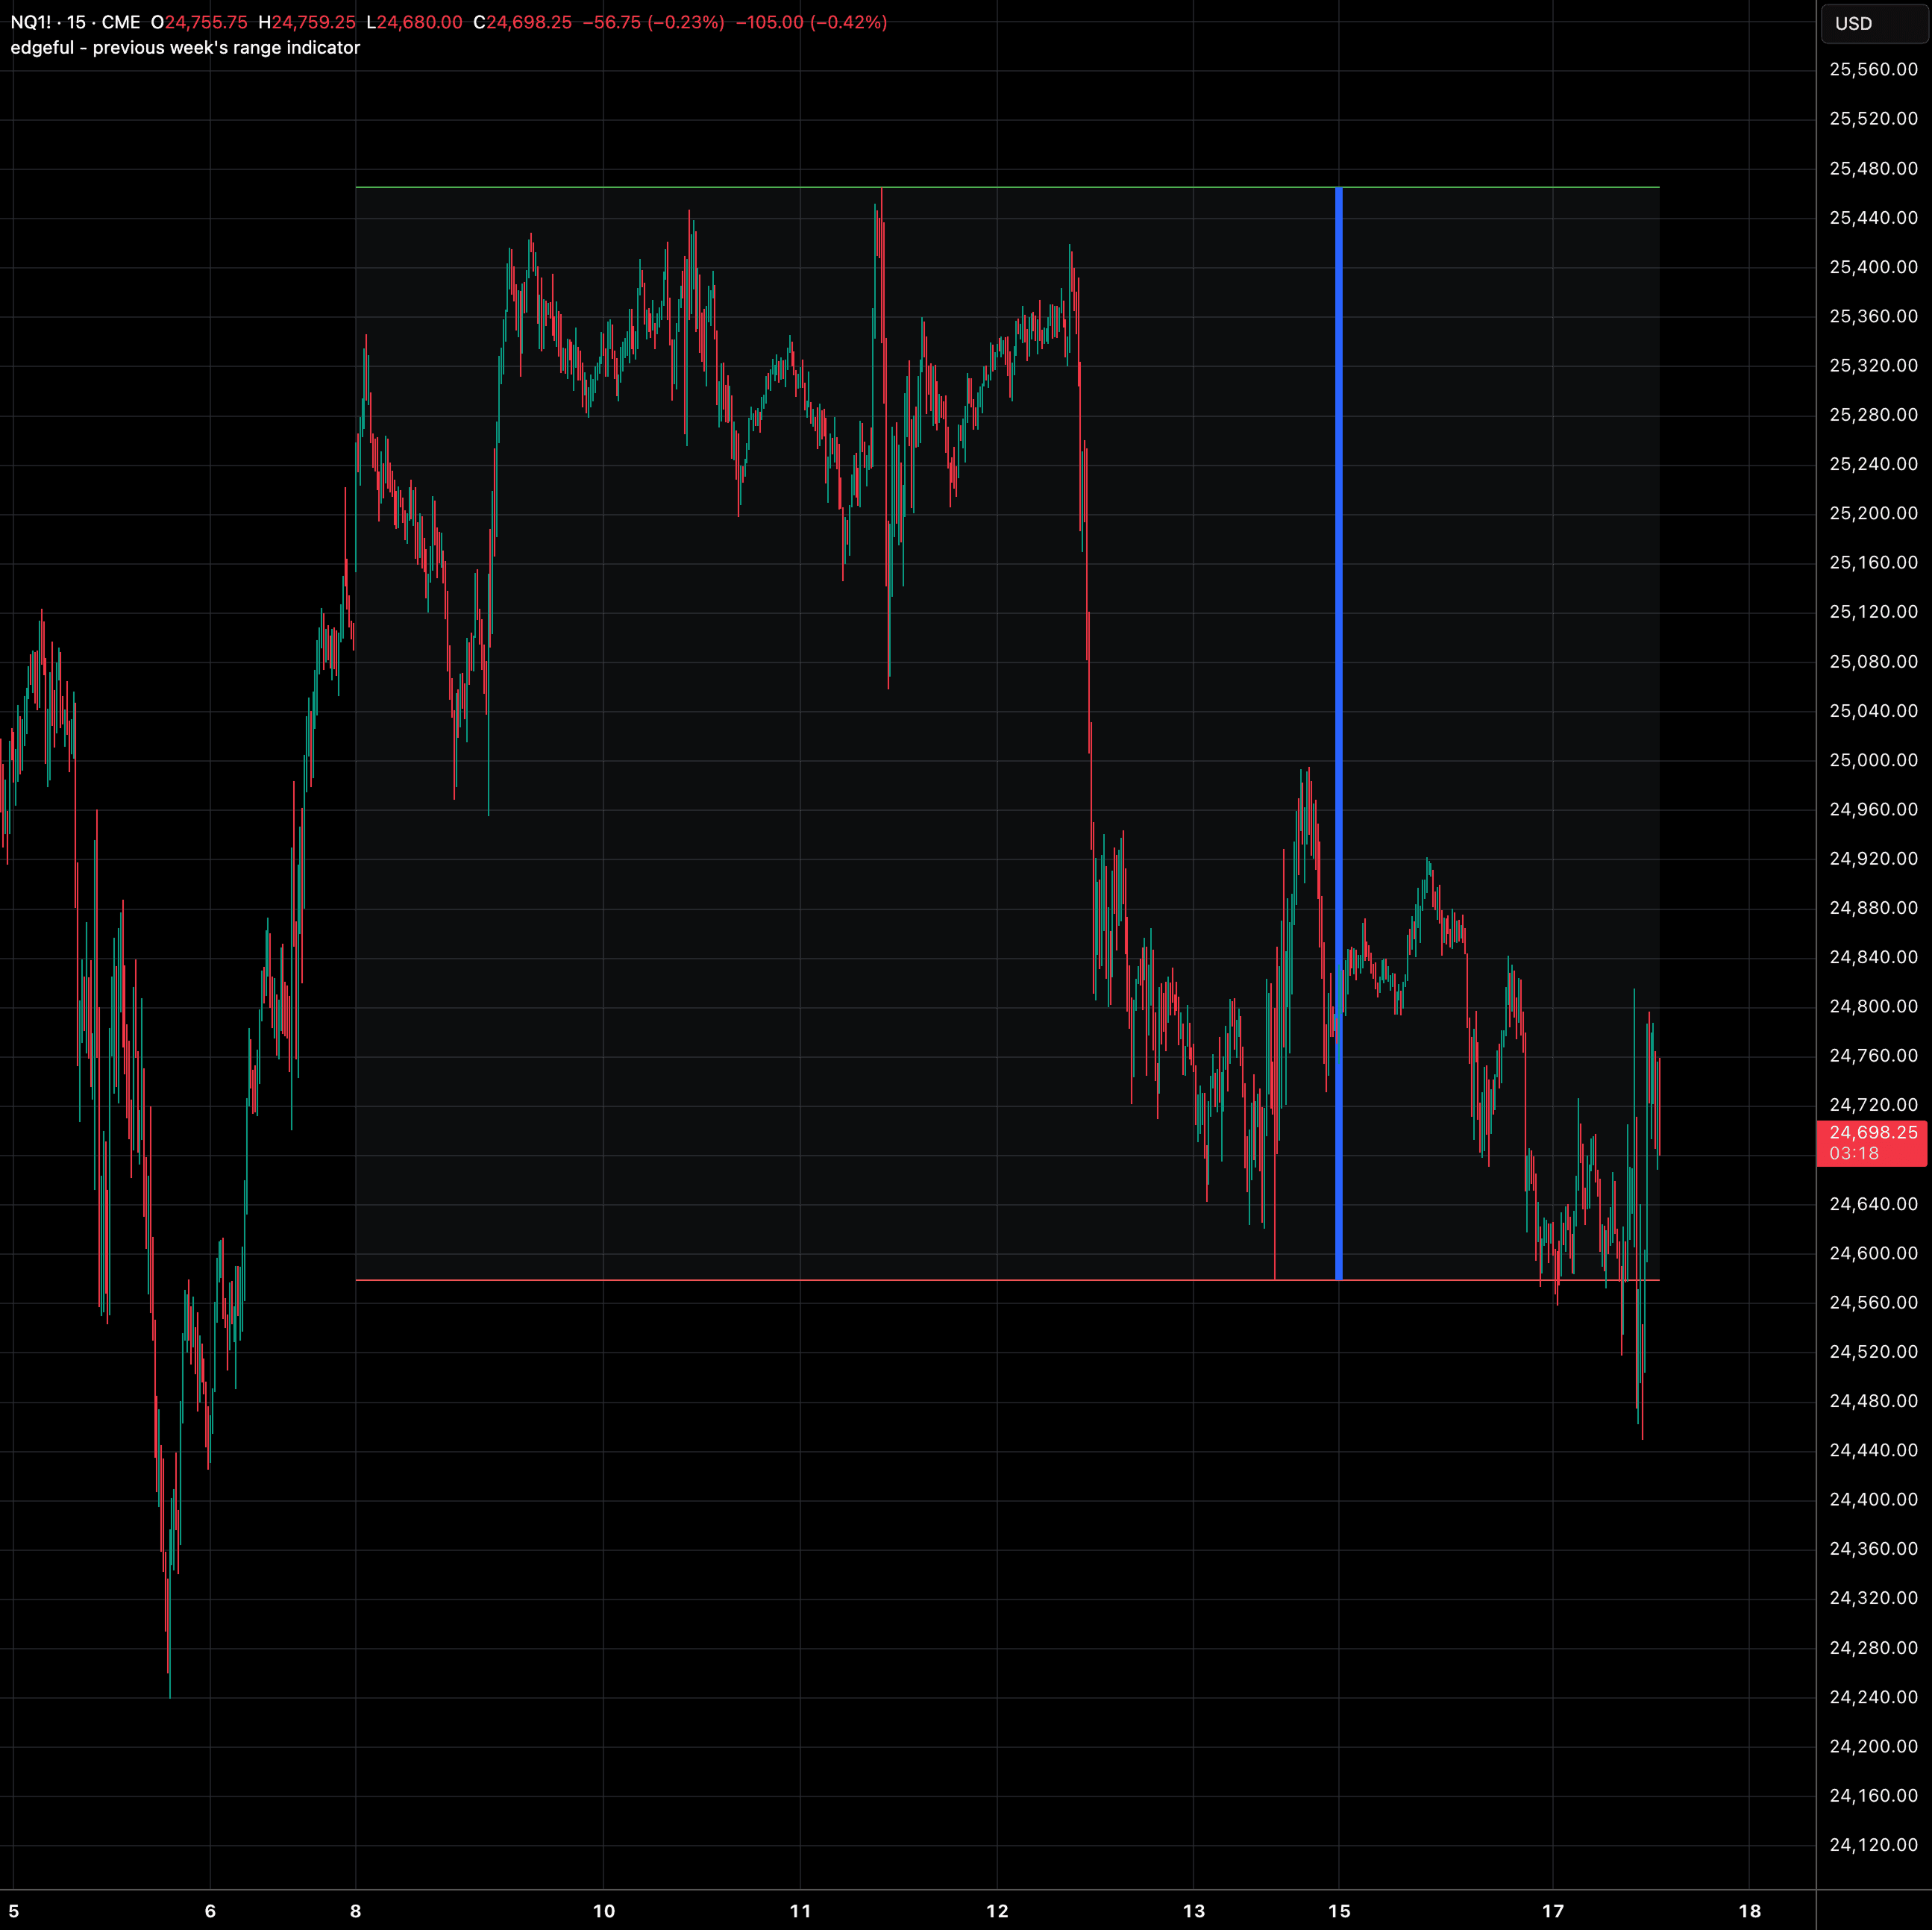
previous week's range
auto-plots last week's high and low with a shaded zone between them for weekly support and resistance context.
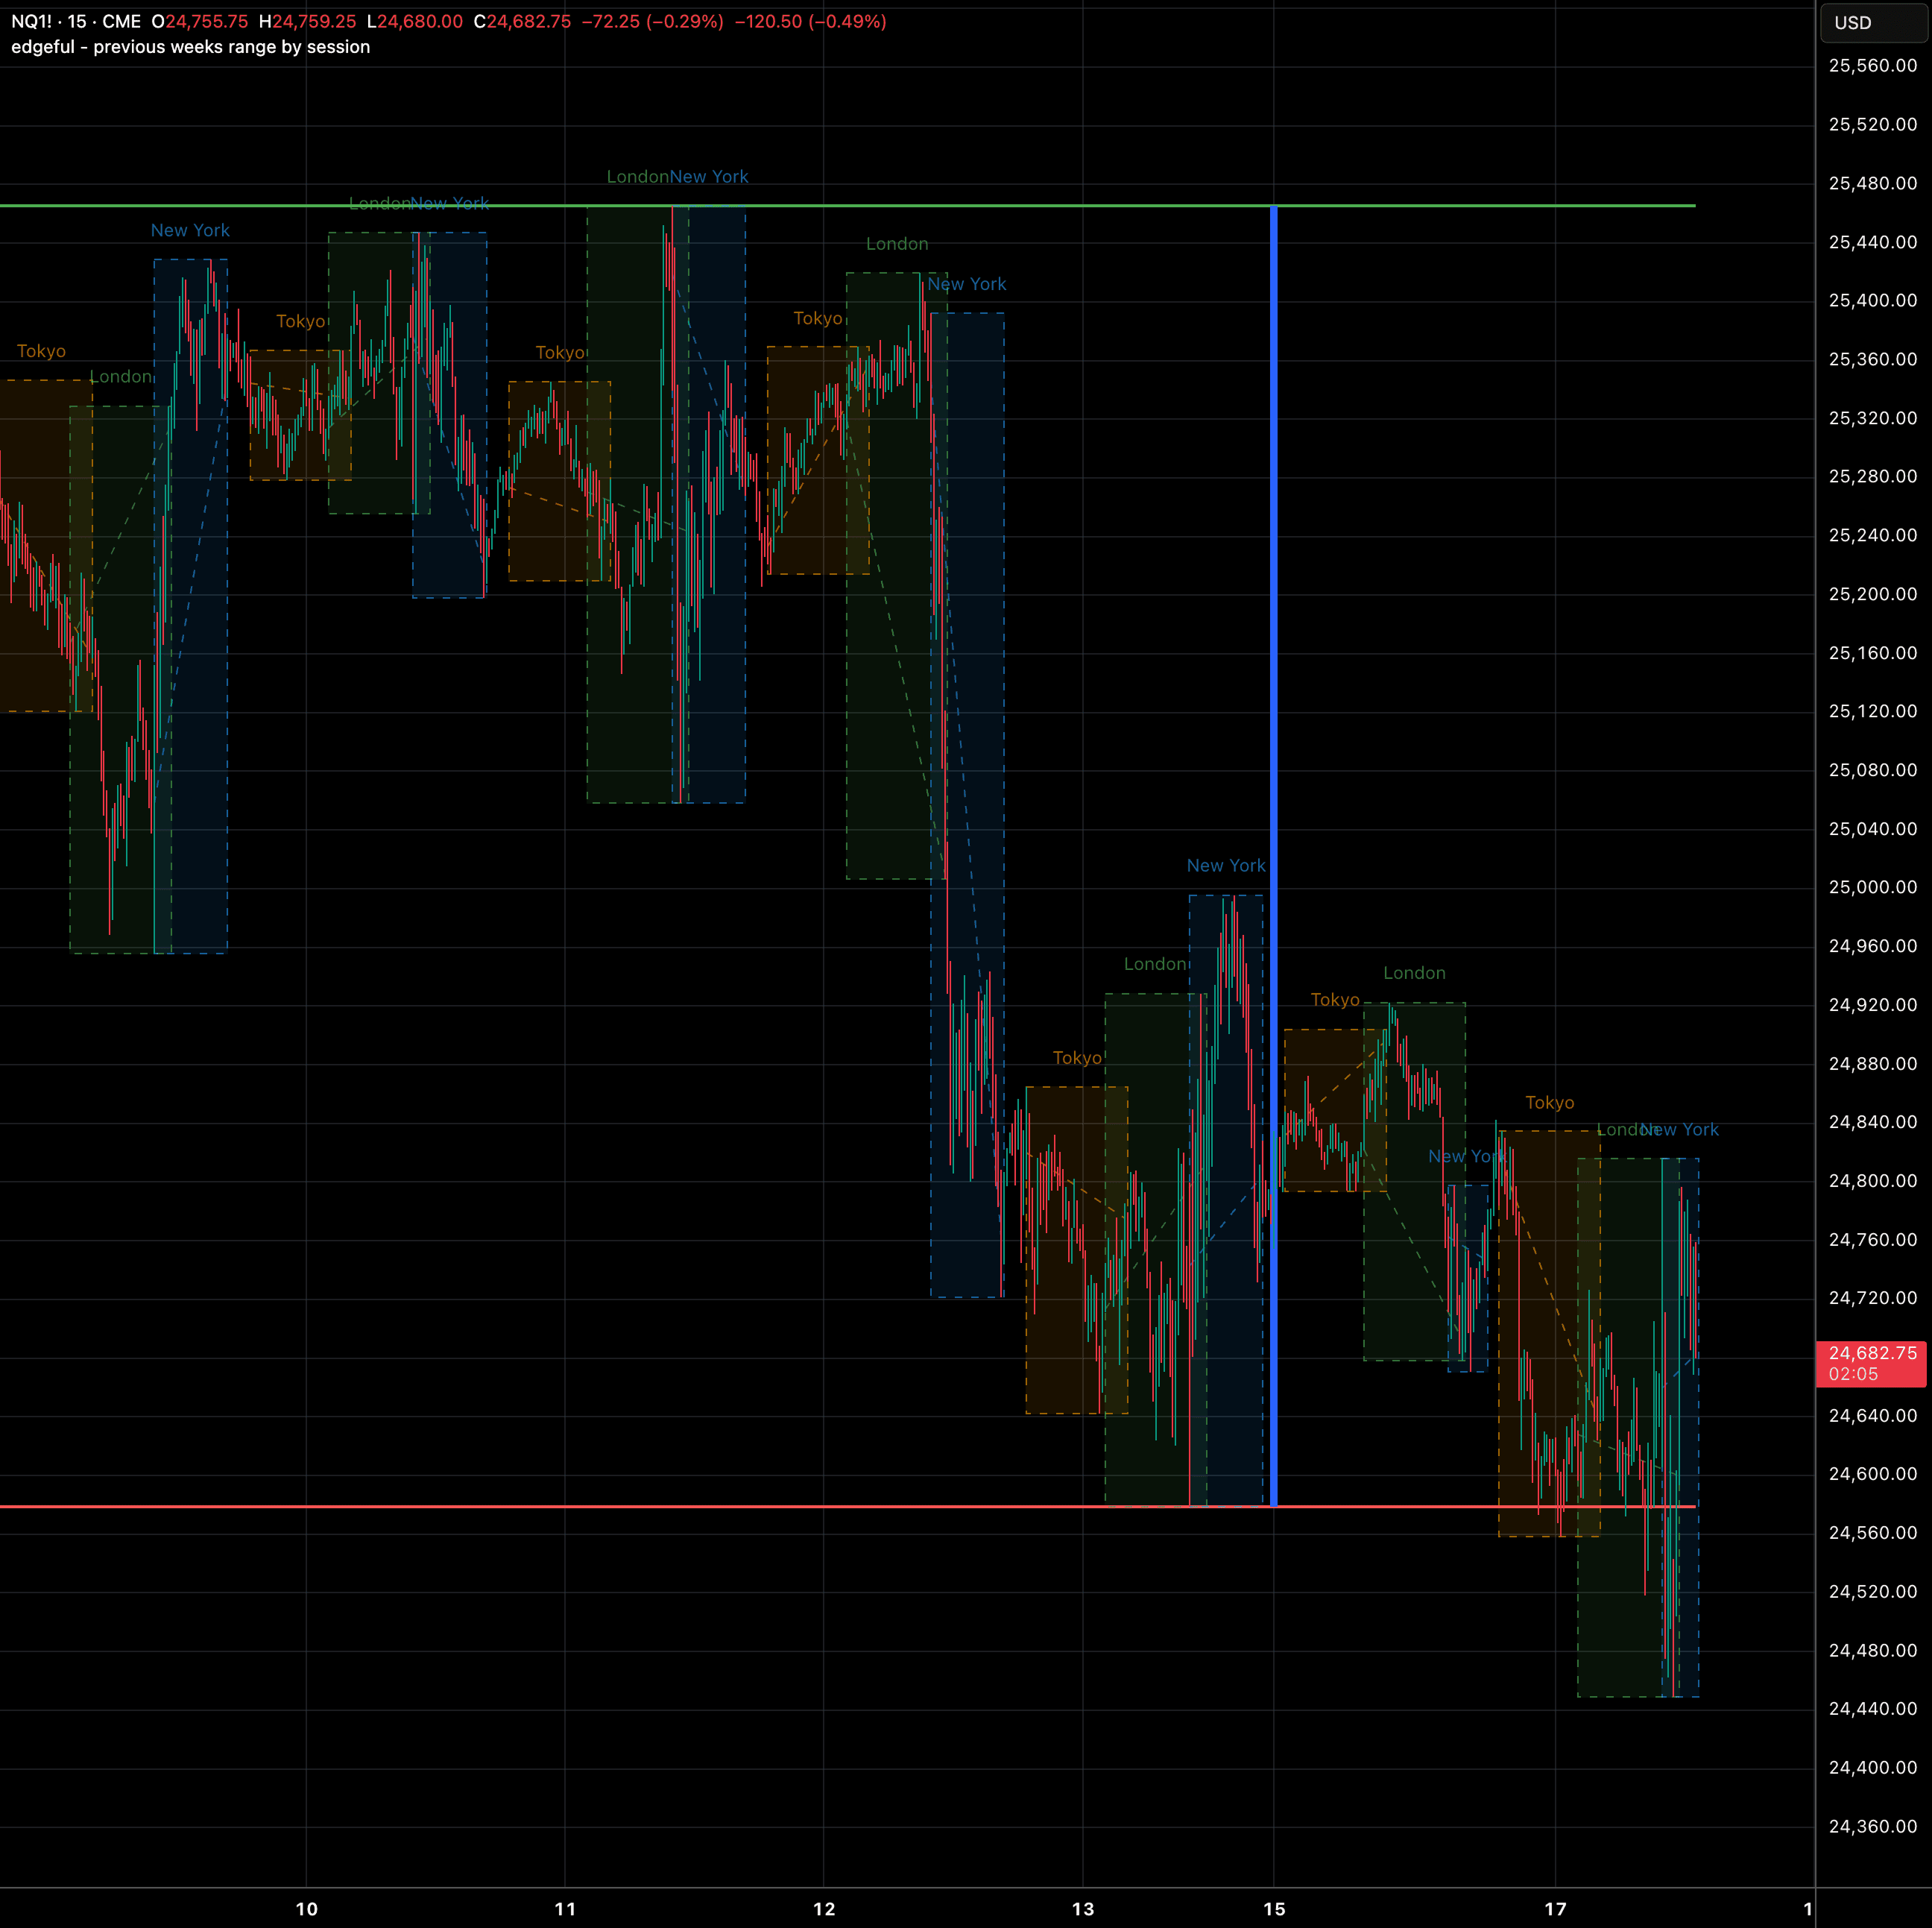
previous week's range by session
auto-plots last week's session-specific high and low alongside session boxes for seamless support and resistance context.
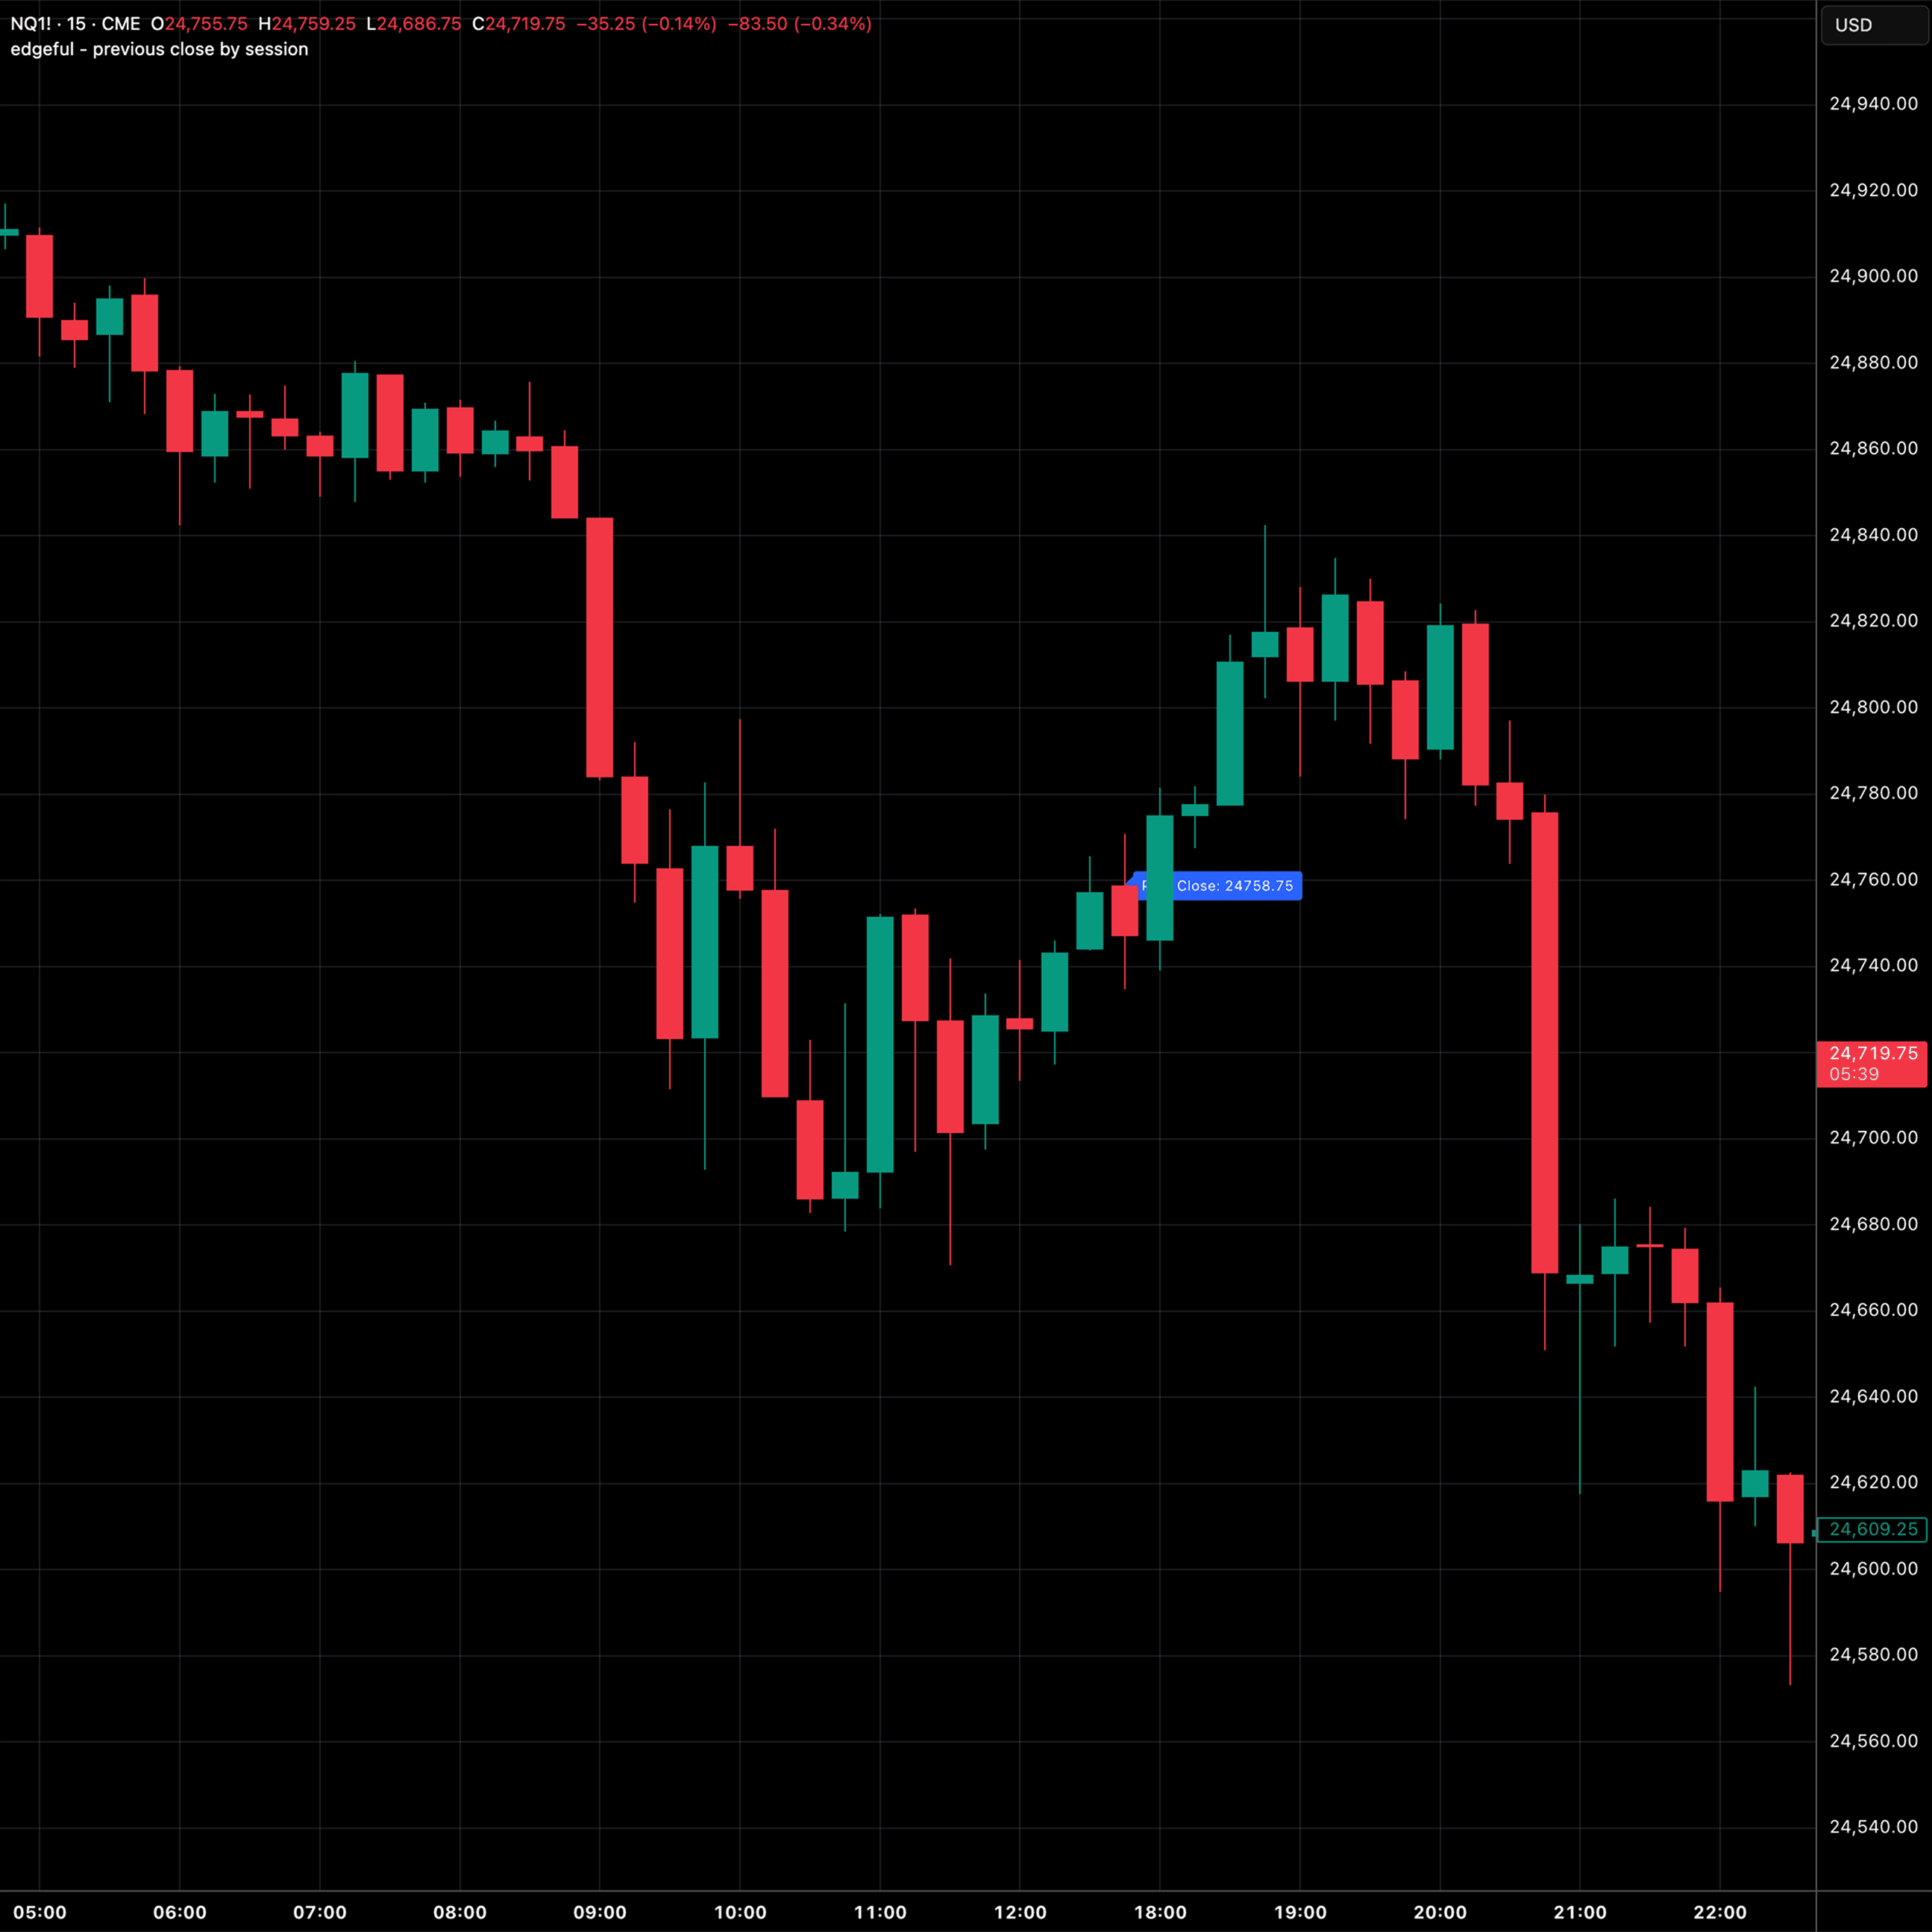
previous close by session
auto-plots the prior session's close (default NY 4 PM) as a forward-extending reference level to easily view and analyze gaps.
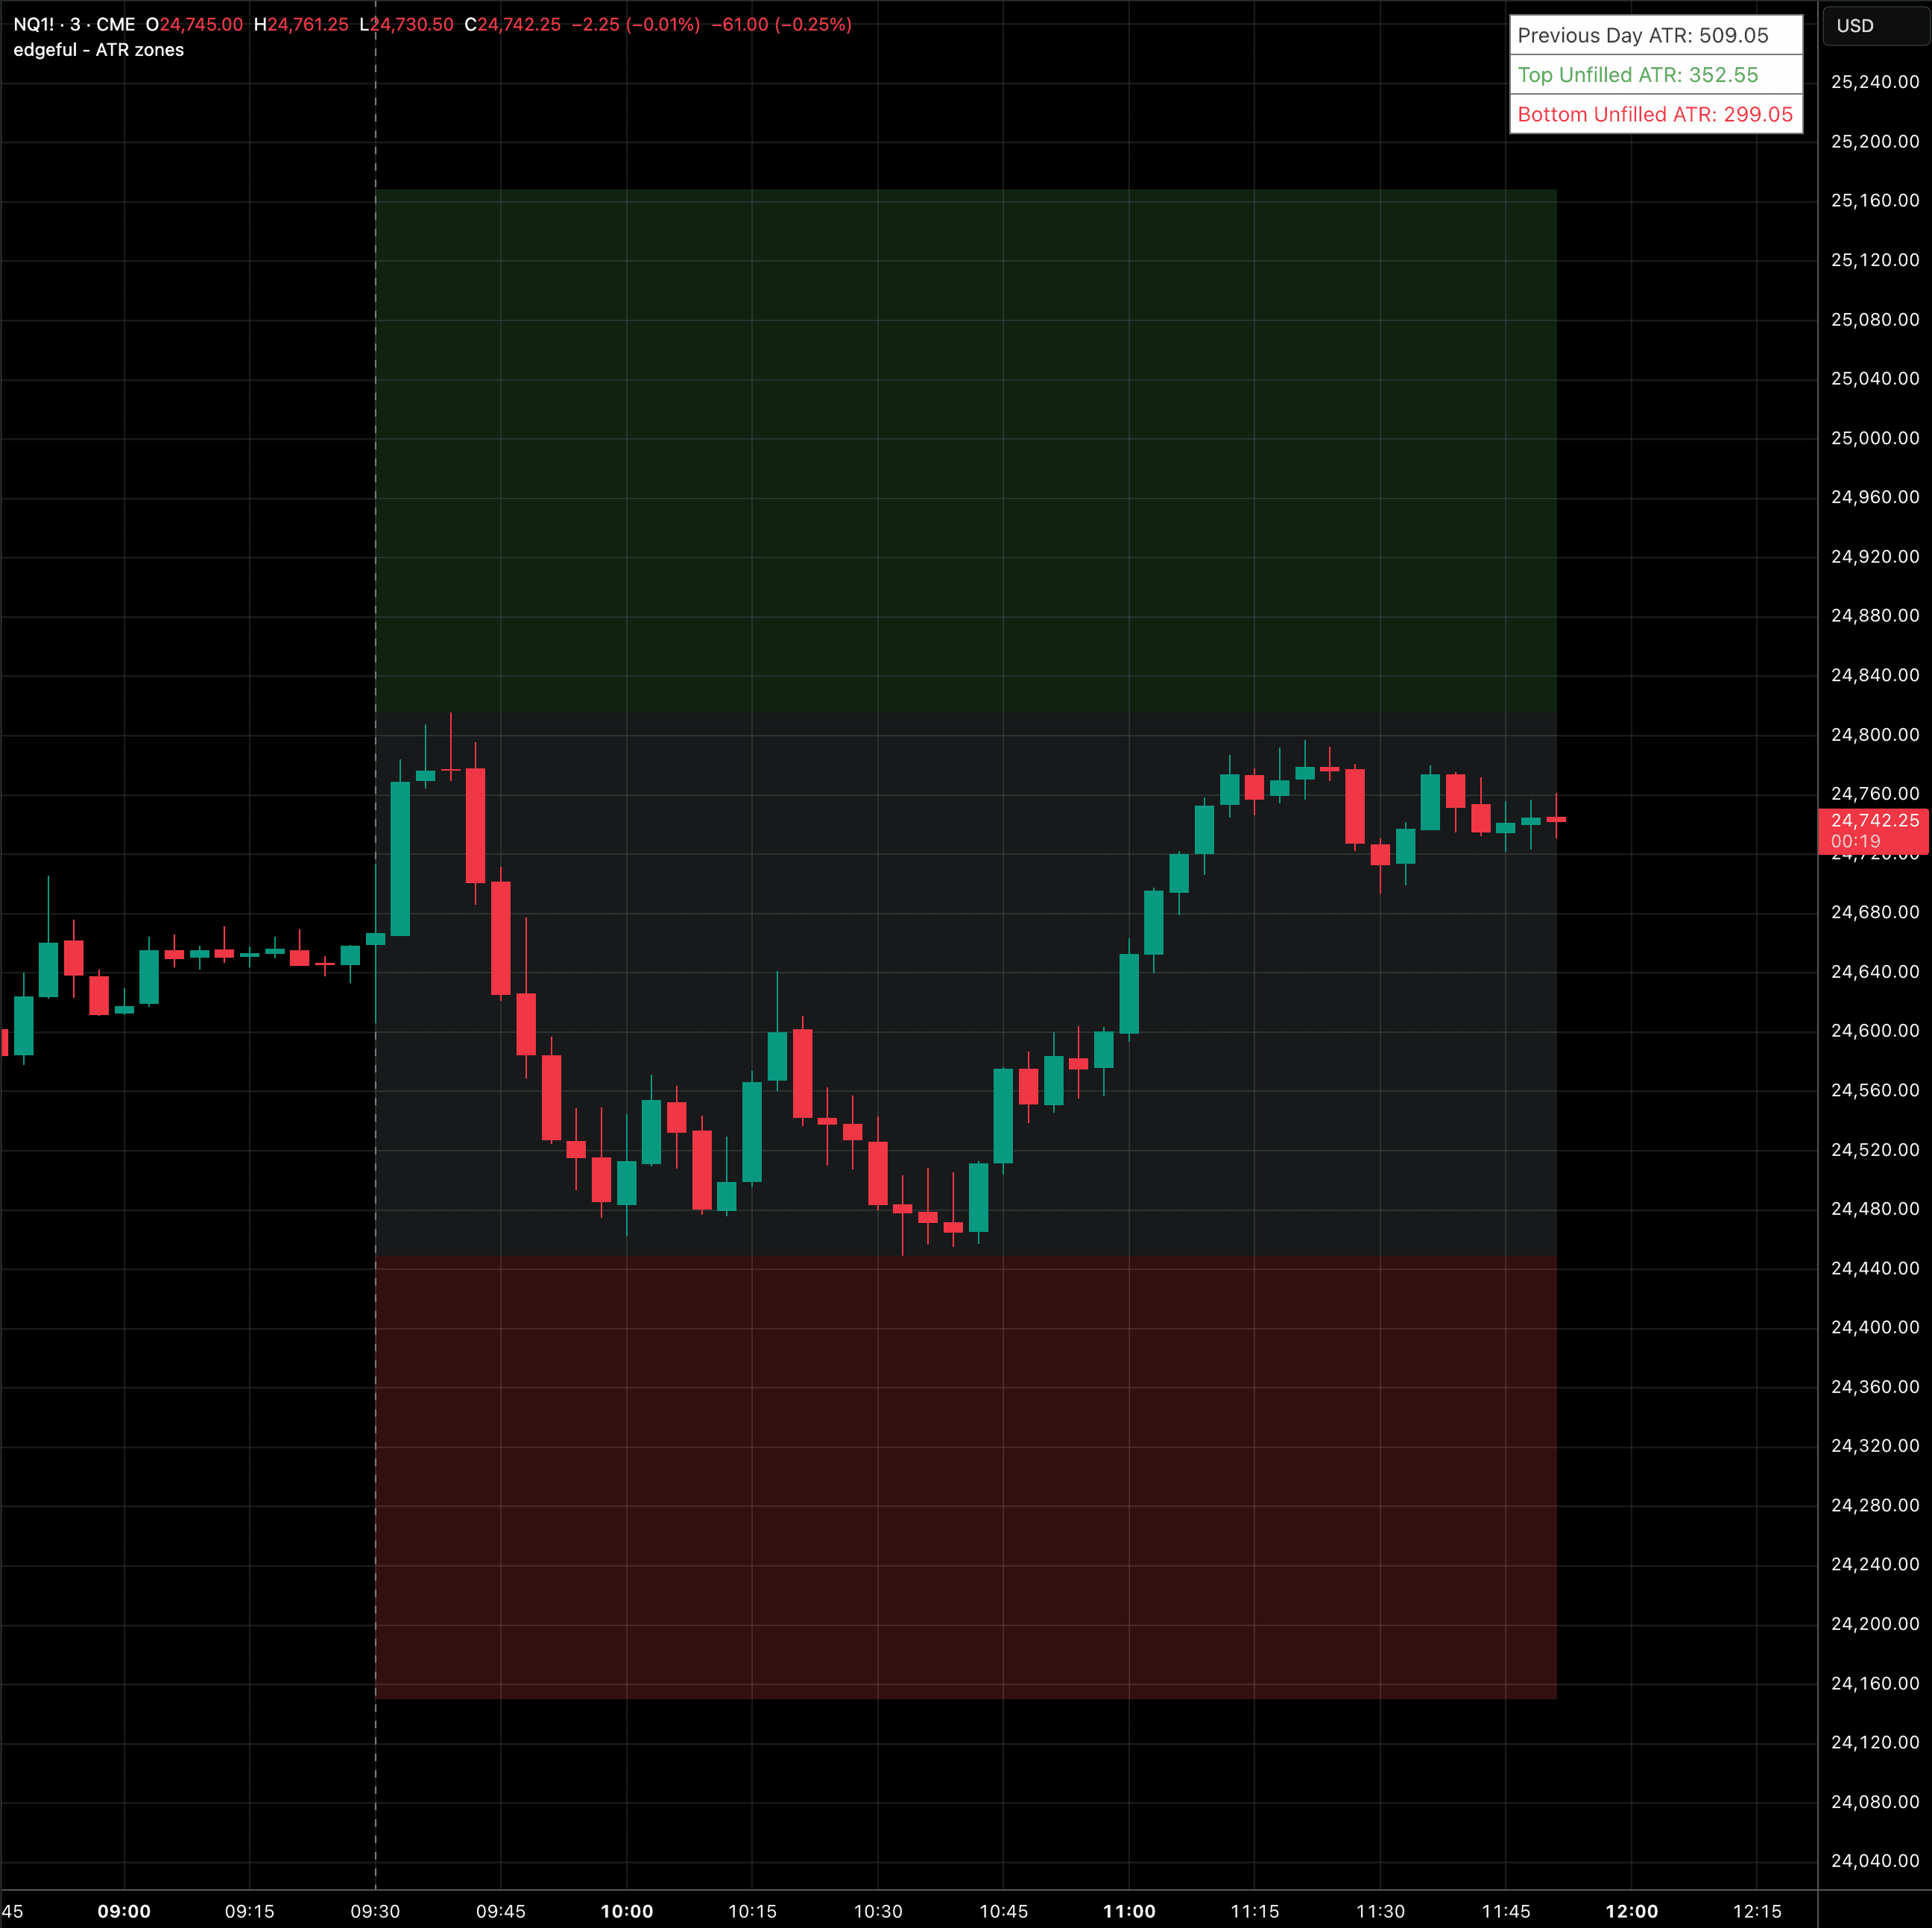
ATR zones
auto-plots the expected daily range using ATR with real-time zones showing how much potential upside and downside remains unfilled.
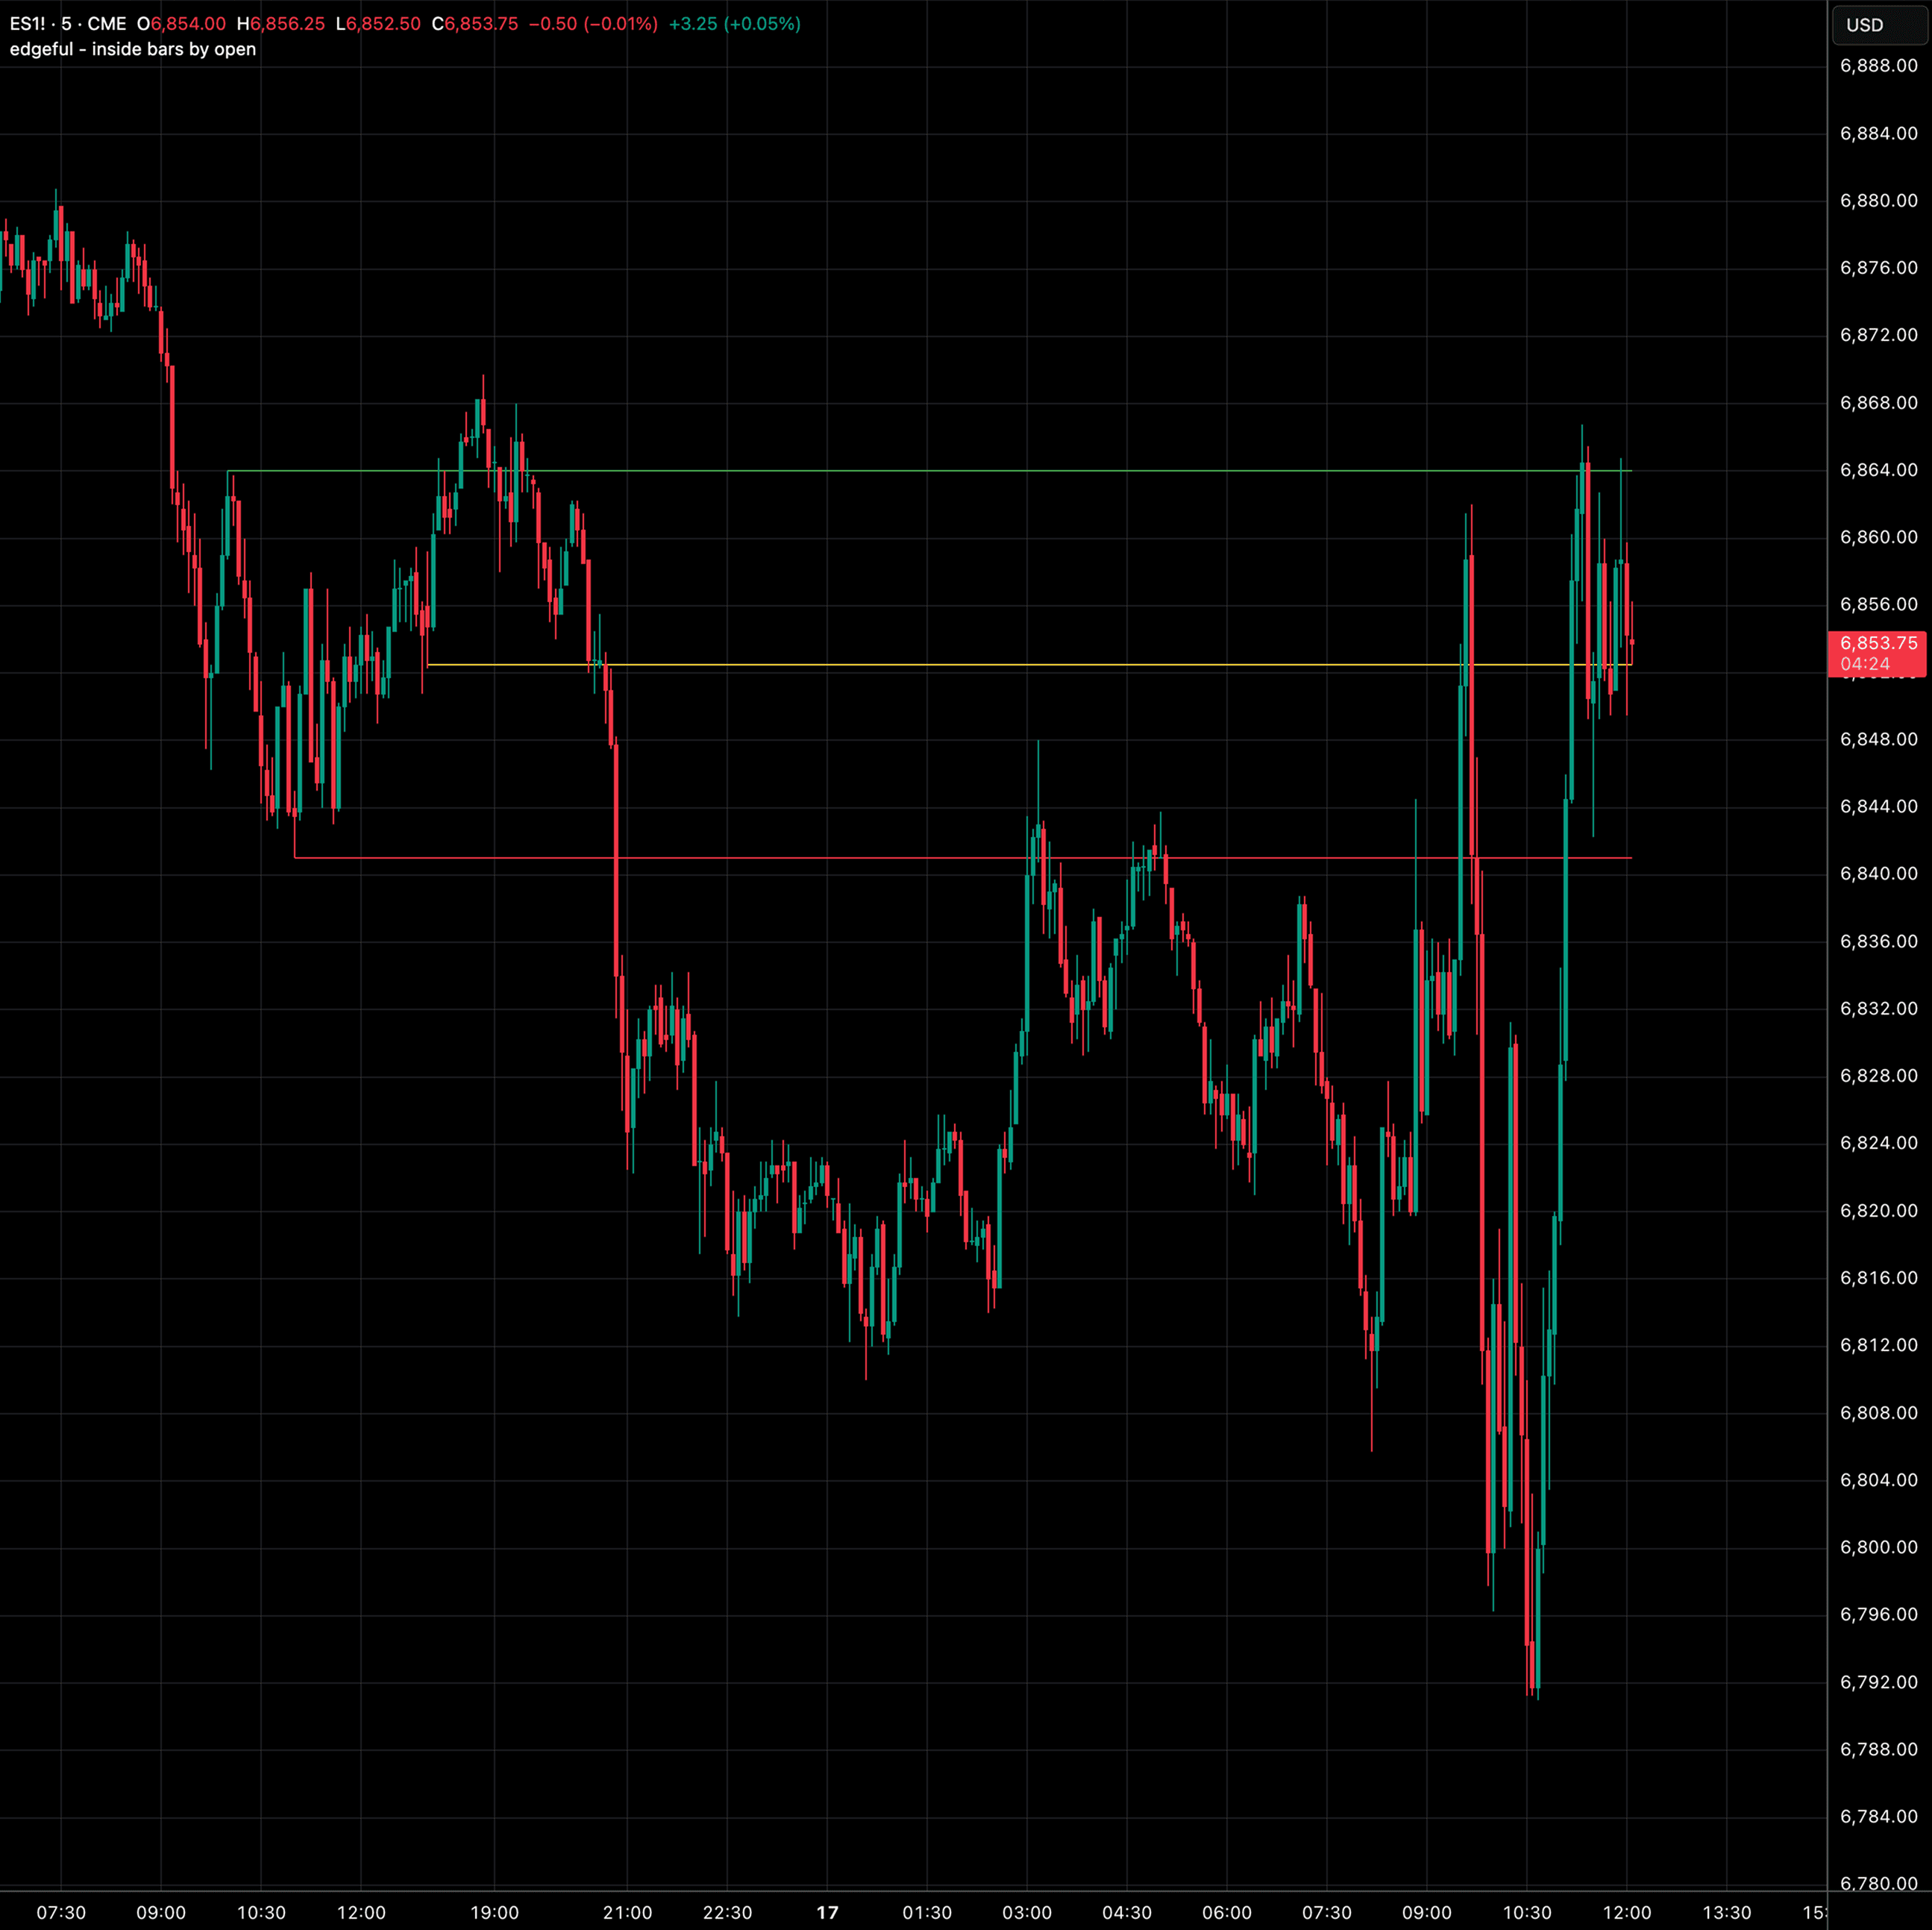
inside bars by open
auto-plots the previous session's high, low, and midpoint as forward-extending reference levels for the next session.
price action
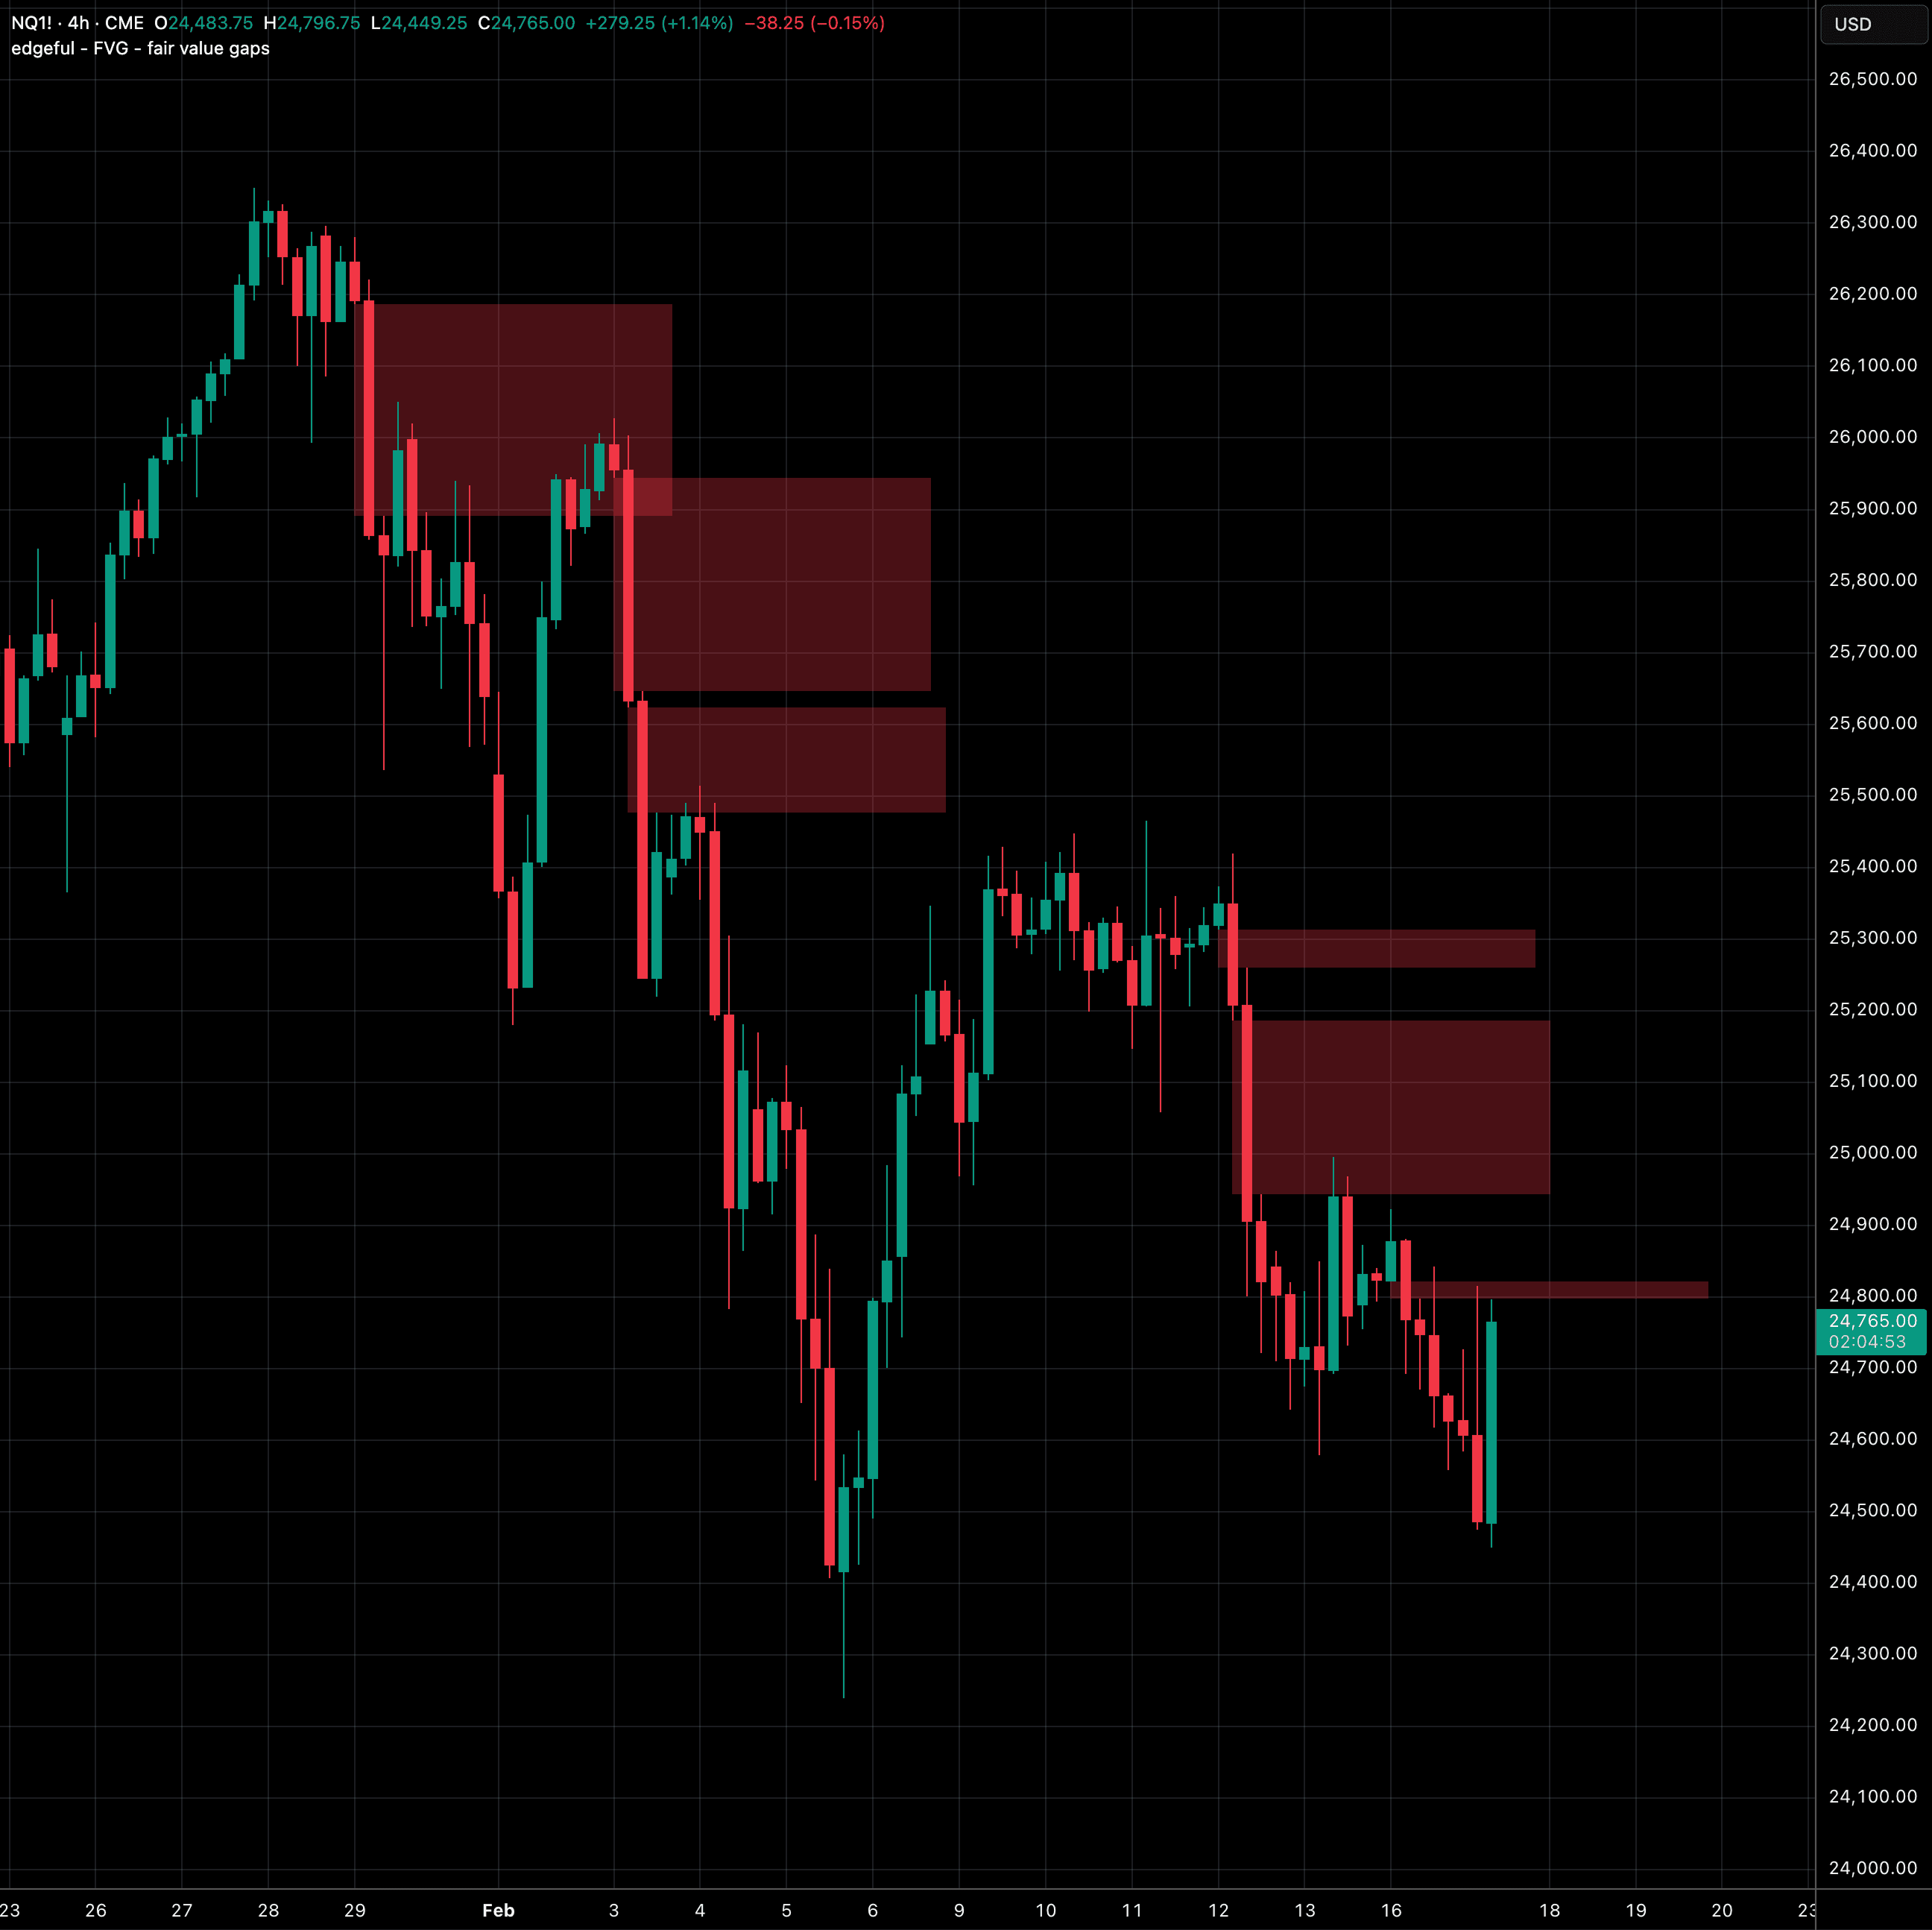
fair value gaps (FVG)
popular
auto-detects FVGs and plots them as boxes, tracking mitigation when price returns to fill each gap.
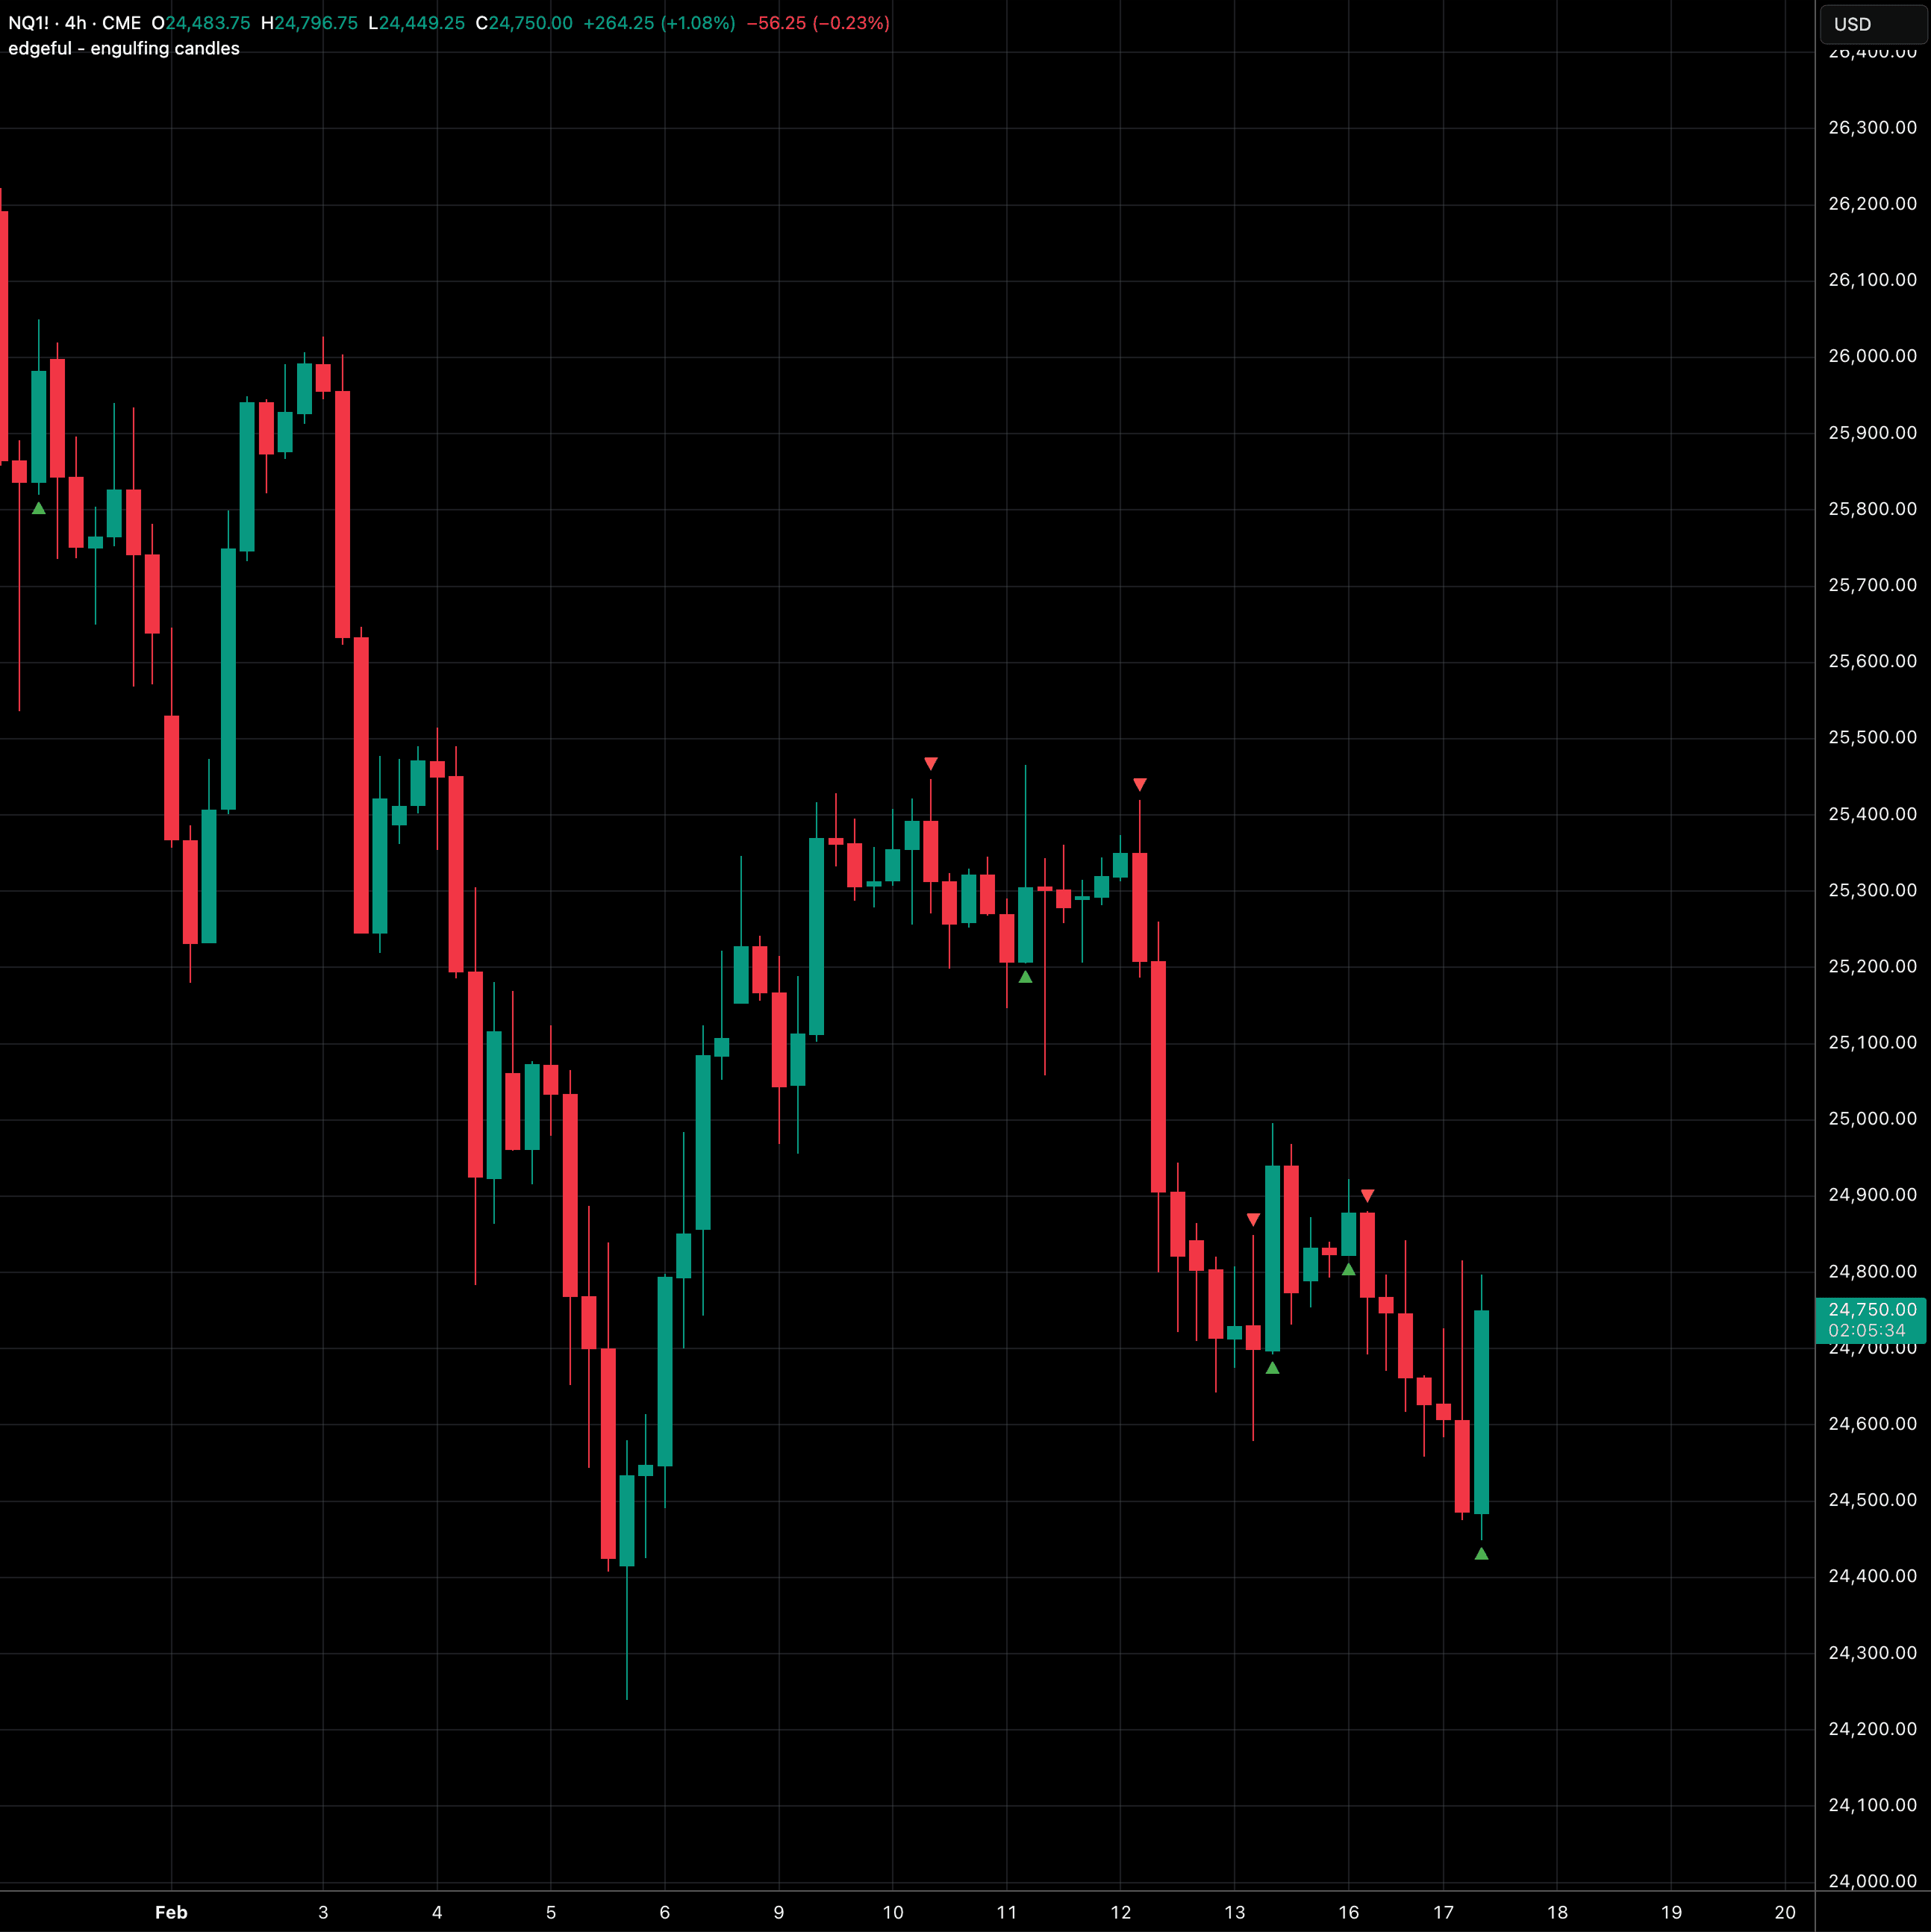
engulfing candles
auto-detects bullish and bearish engulfing patterns with on-chart triangle markers and real-time alert conditions.
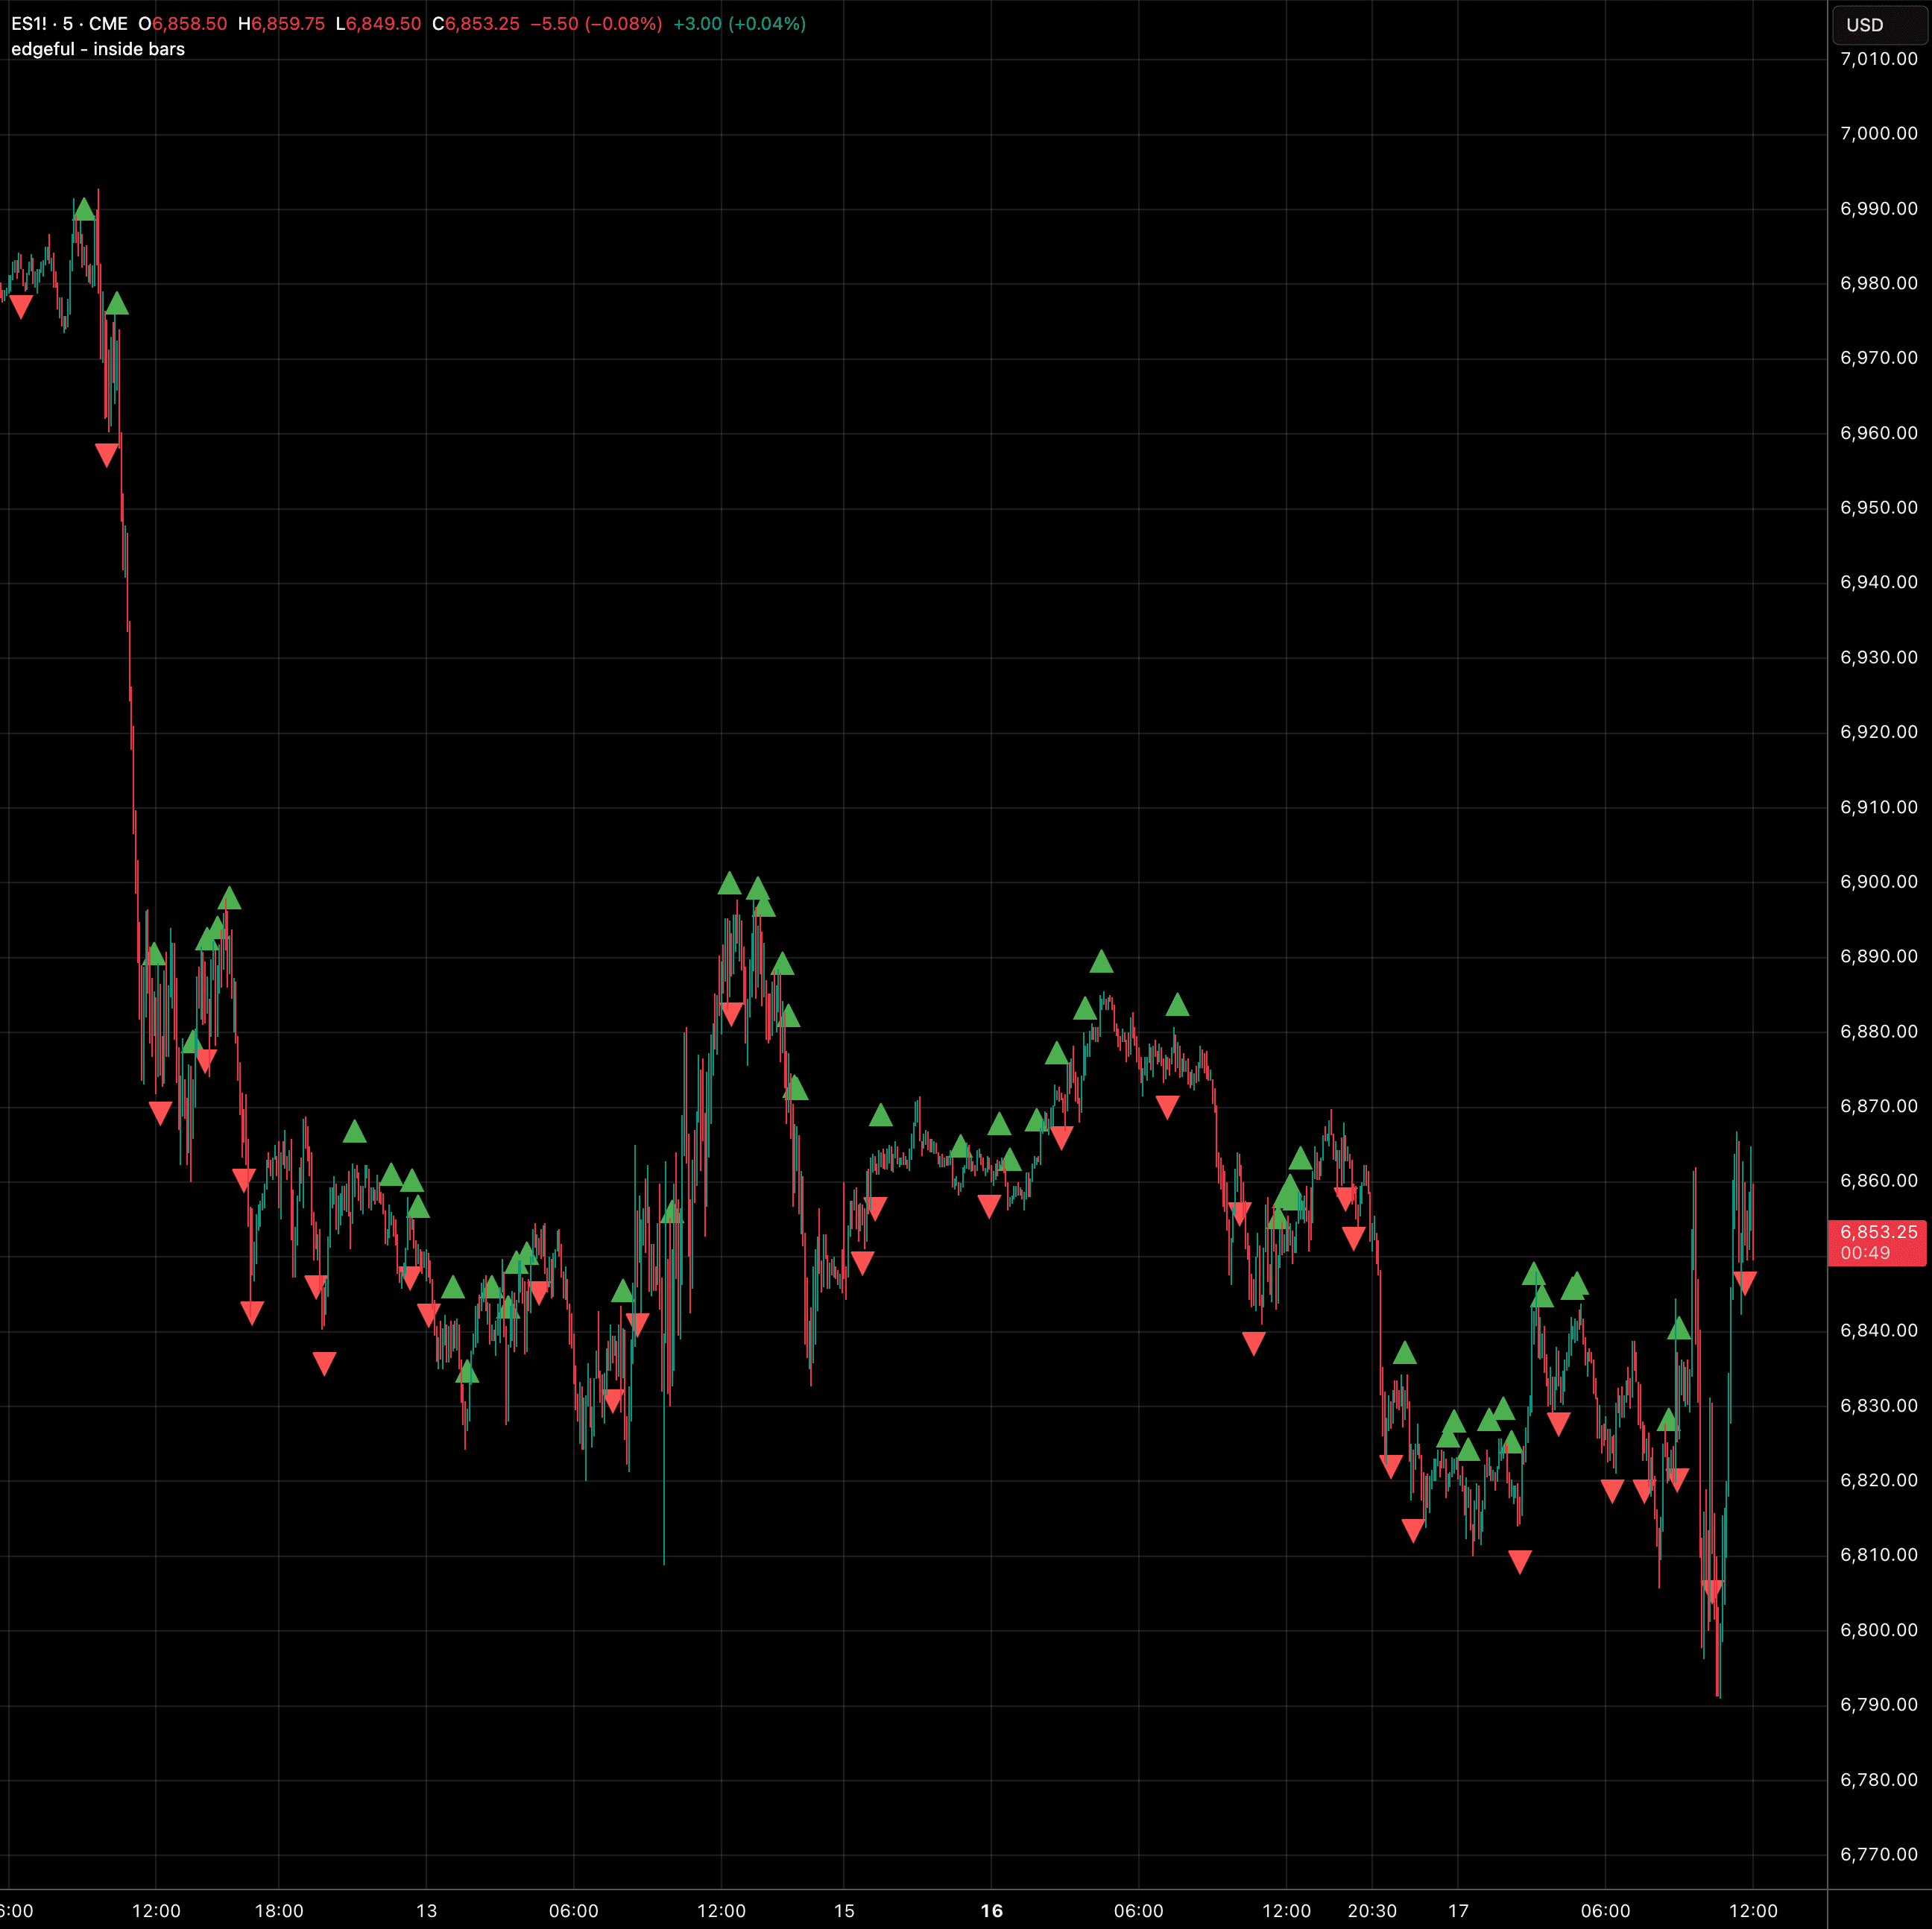
inside bars
auto-detects inside bar patterns and classifies them as bullish or bearish, signaling potential breakout setups ahead.
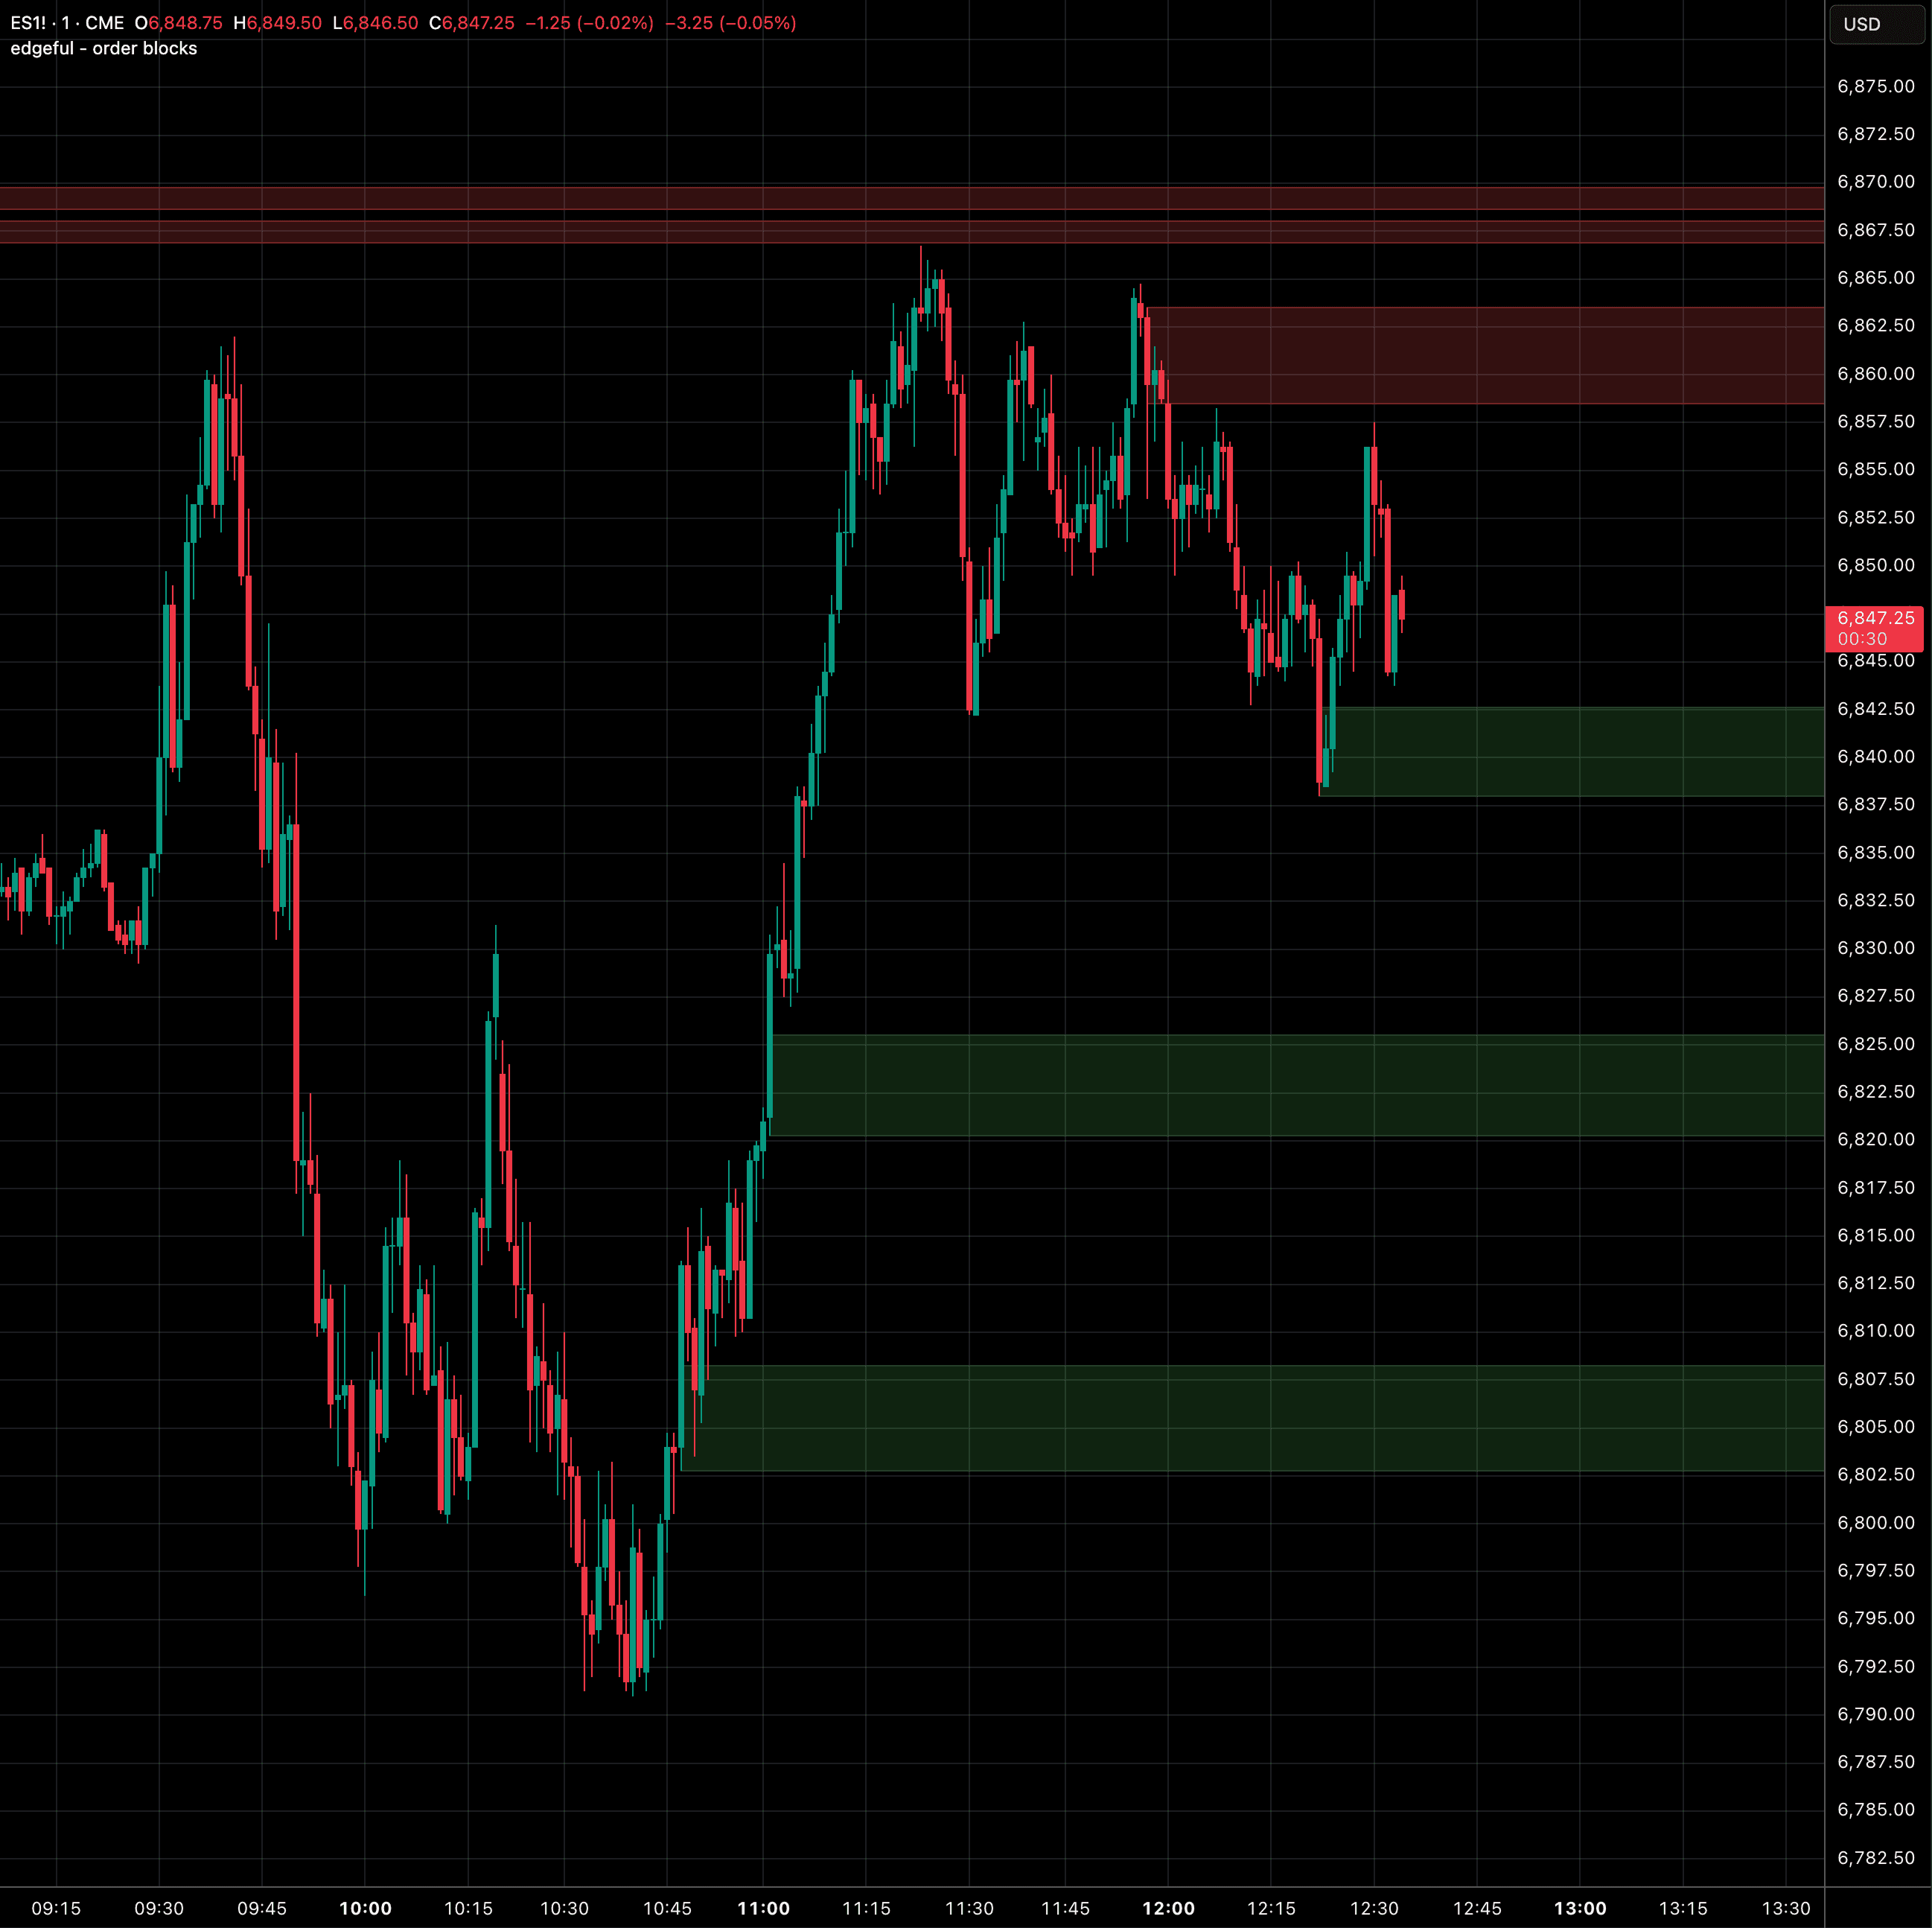
order blocks
auto-detects institutional order blocks using volume pivot analysis and tracks them until price mitigates the zone.
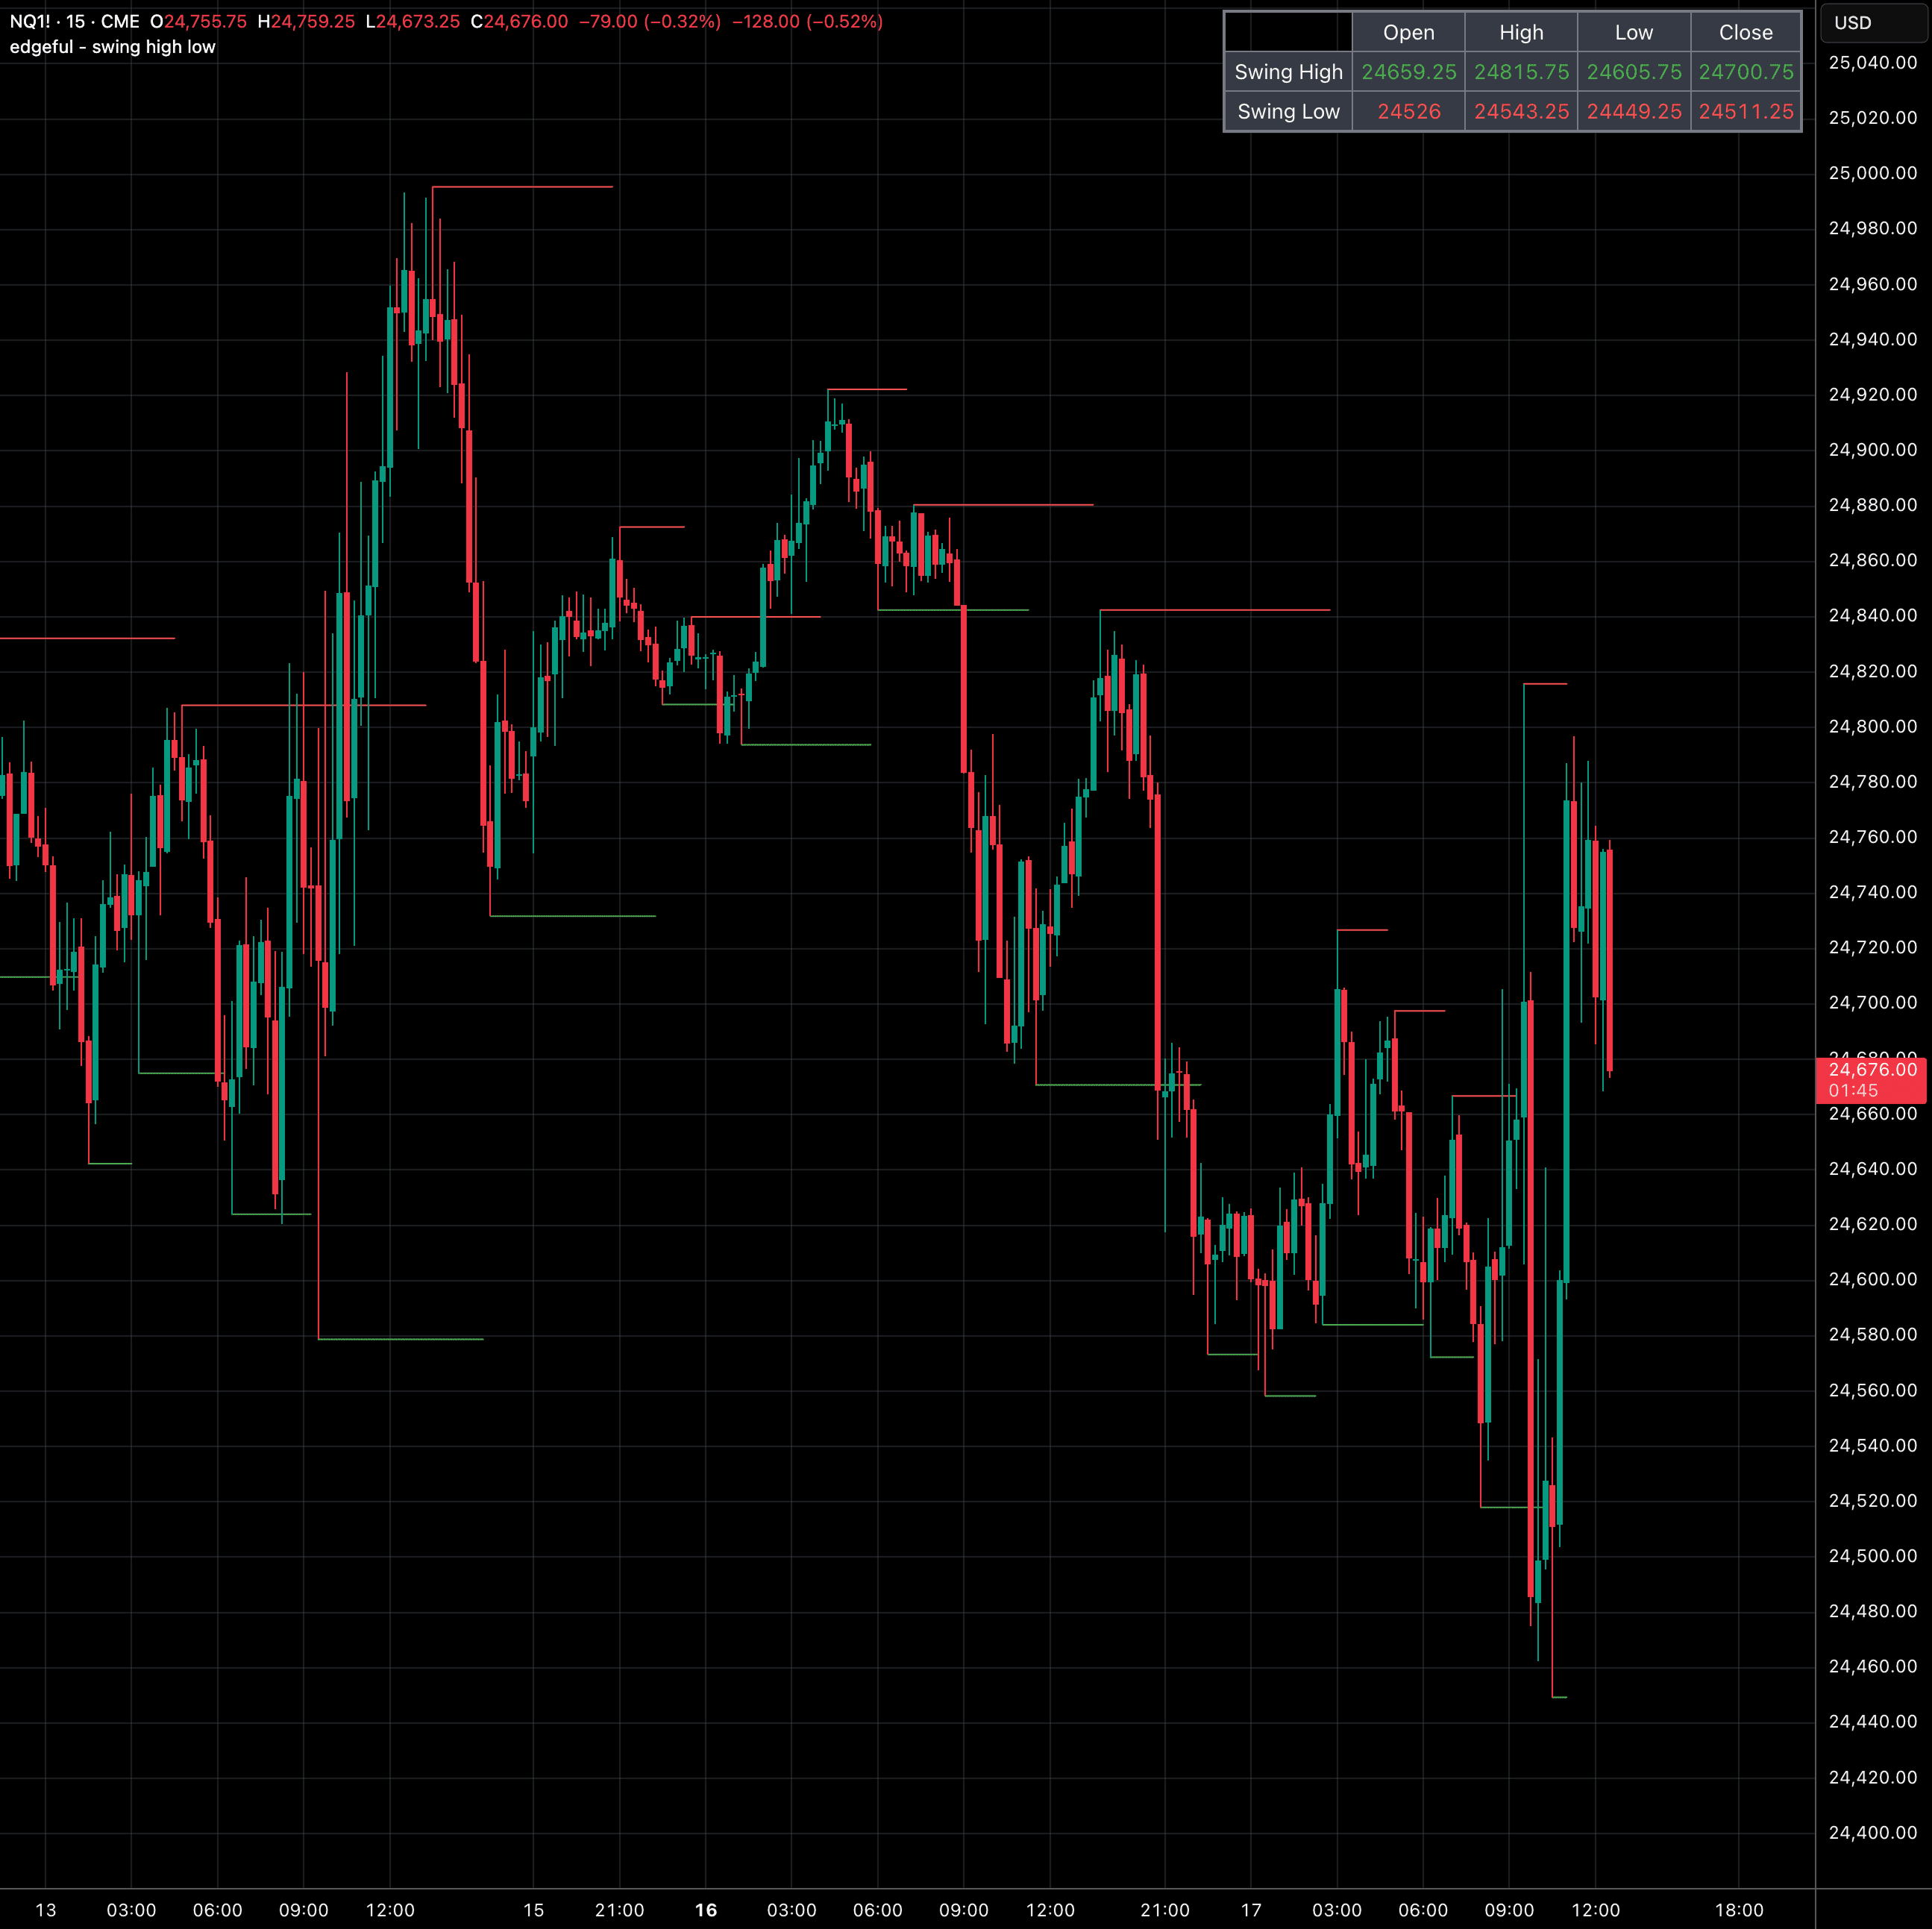
swing high low
auto-identifies swing highs and lows with HH, LH, HL, and LL labels so you can read market structure at a glance.
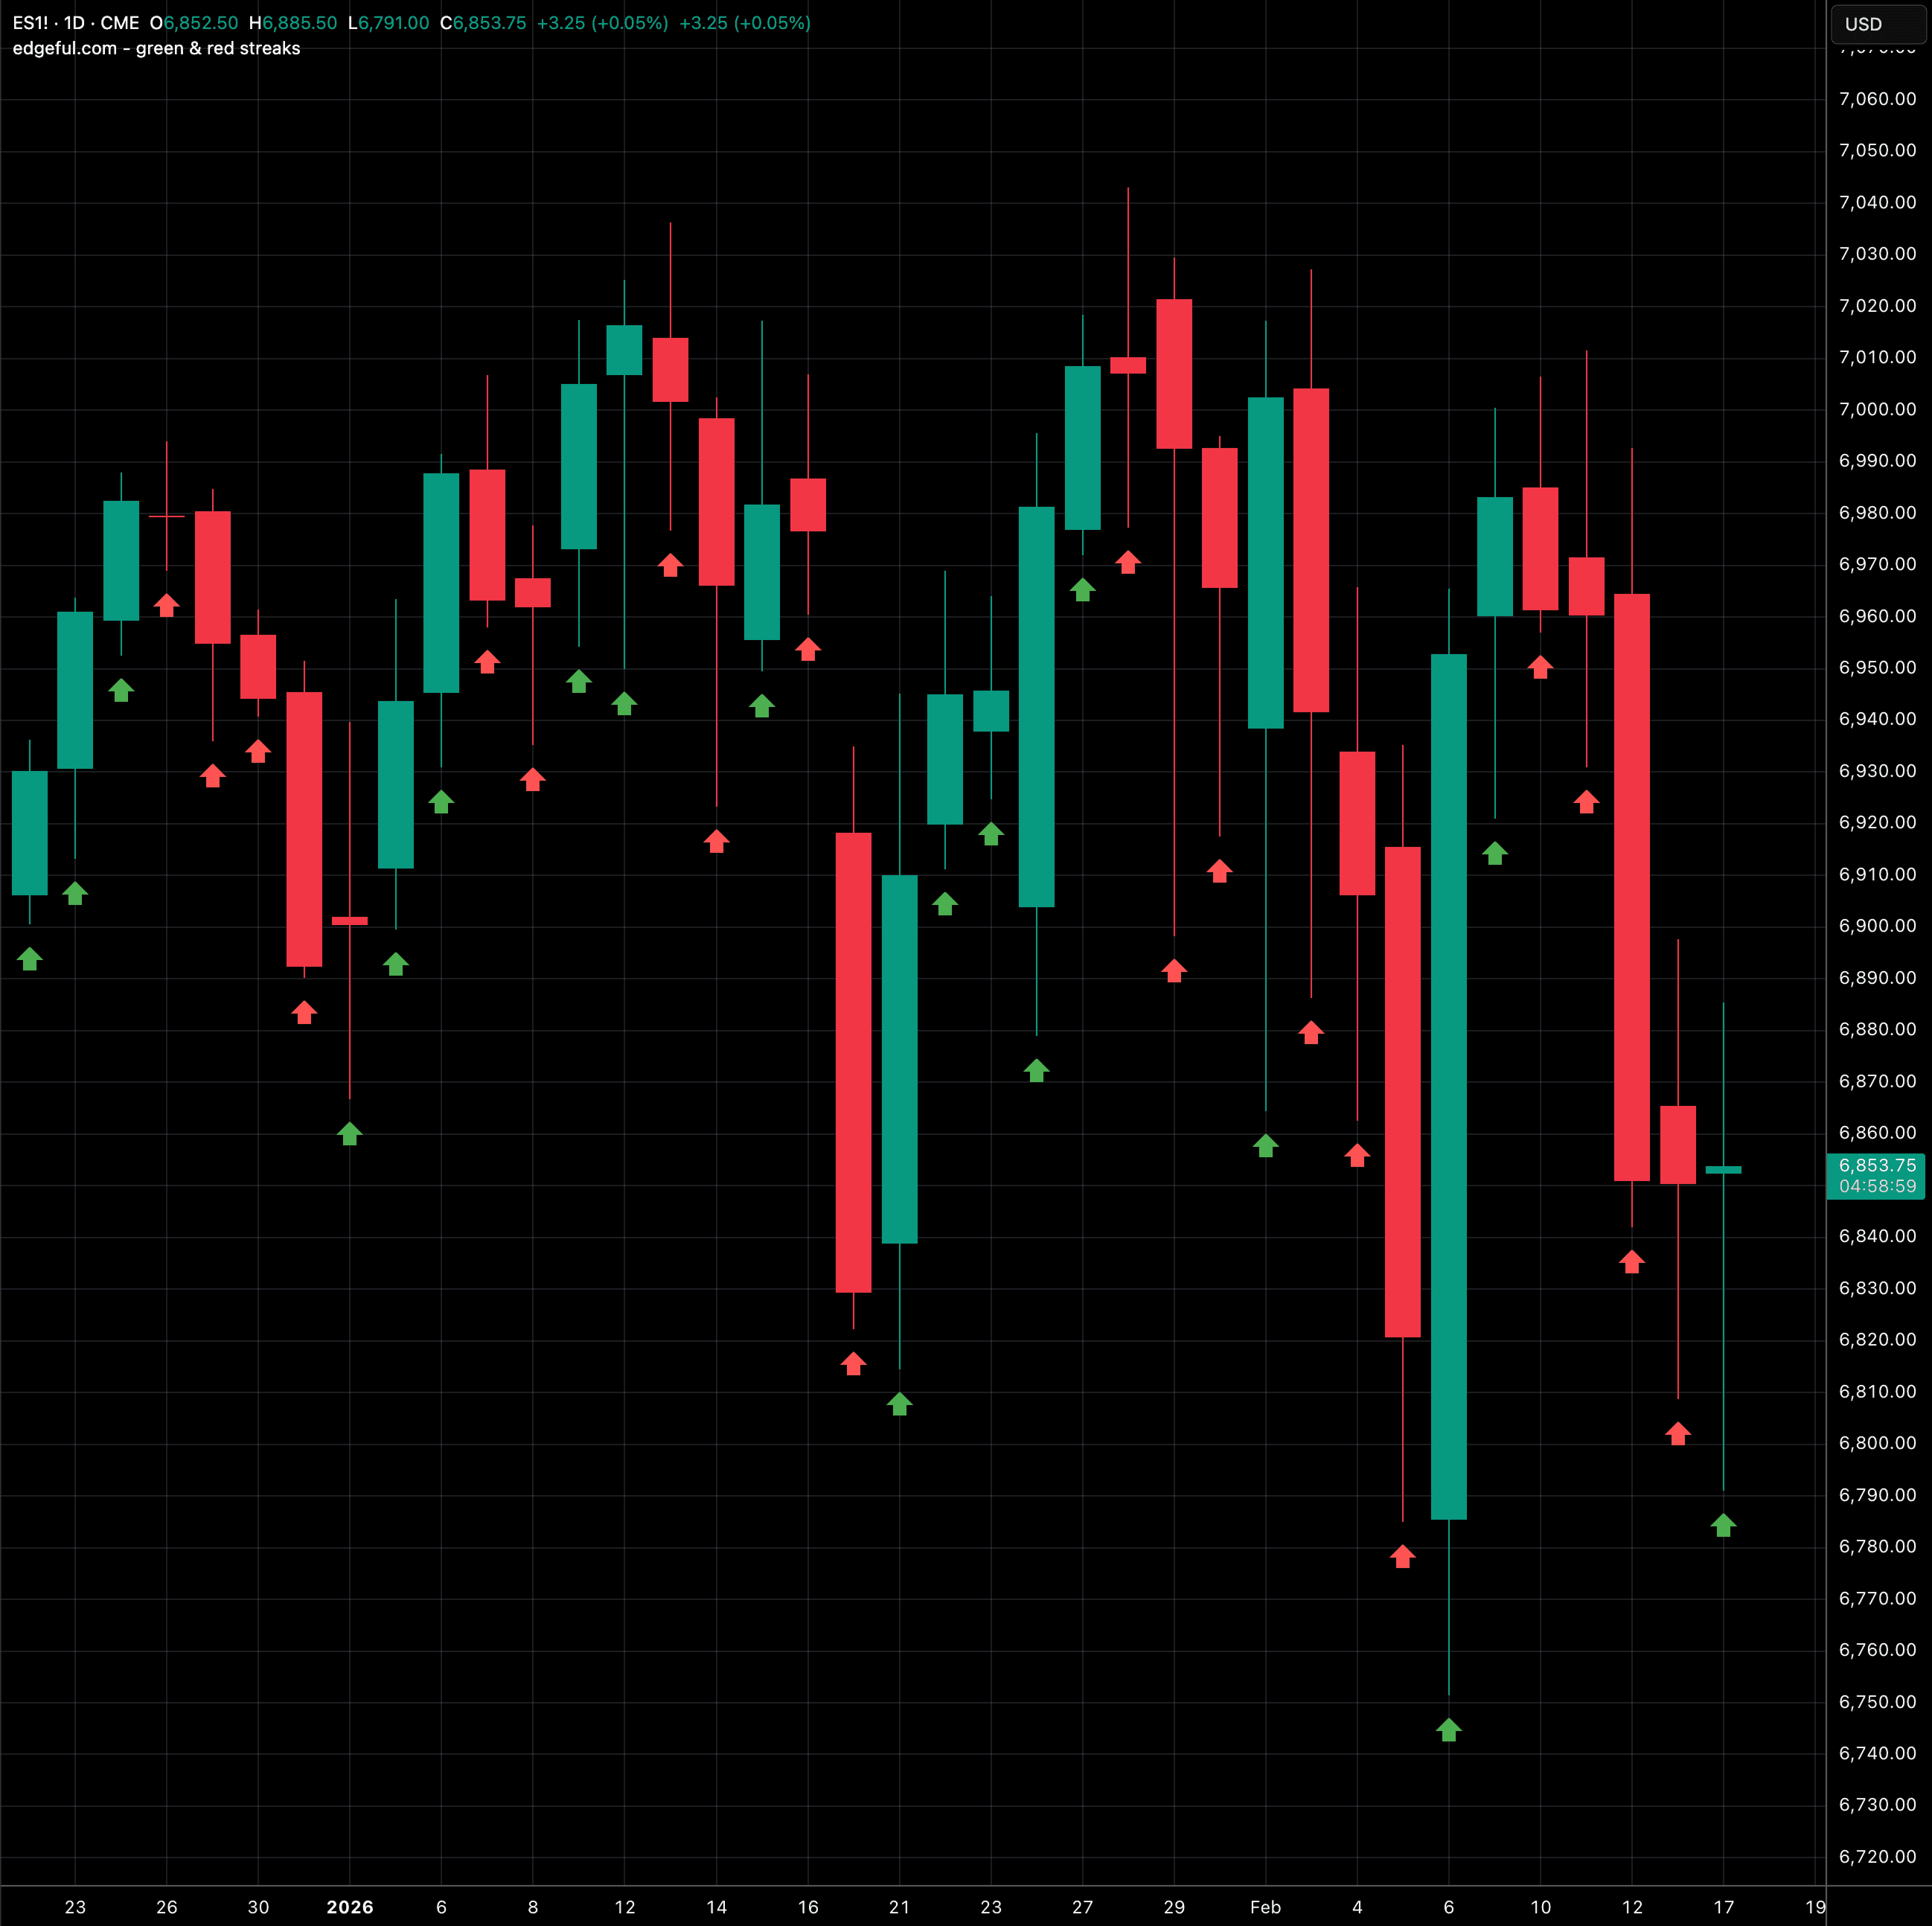
green & red streaks
auto-plots consecutive up and down closes on daily, weekly, or monthly timeframes to spot momentum and exhaustion.
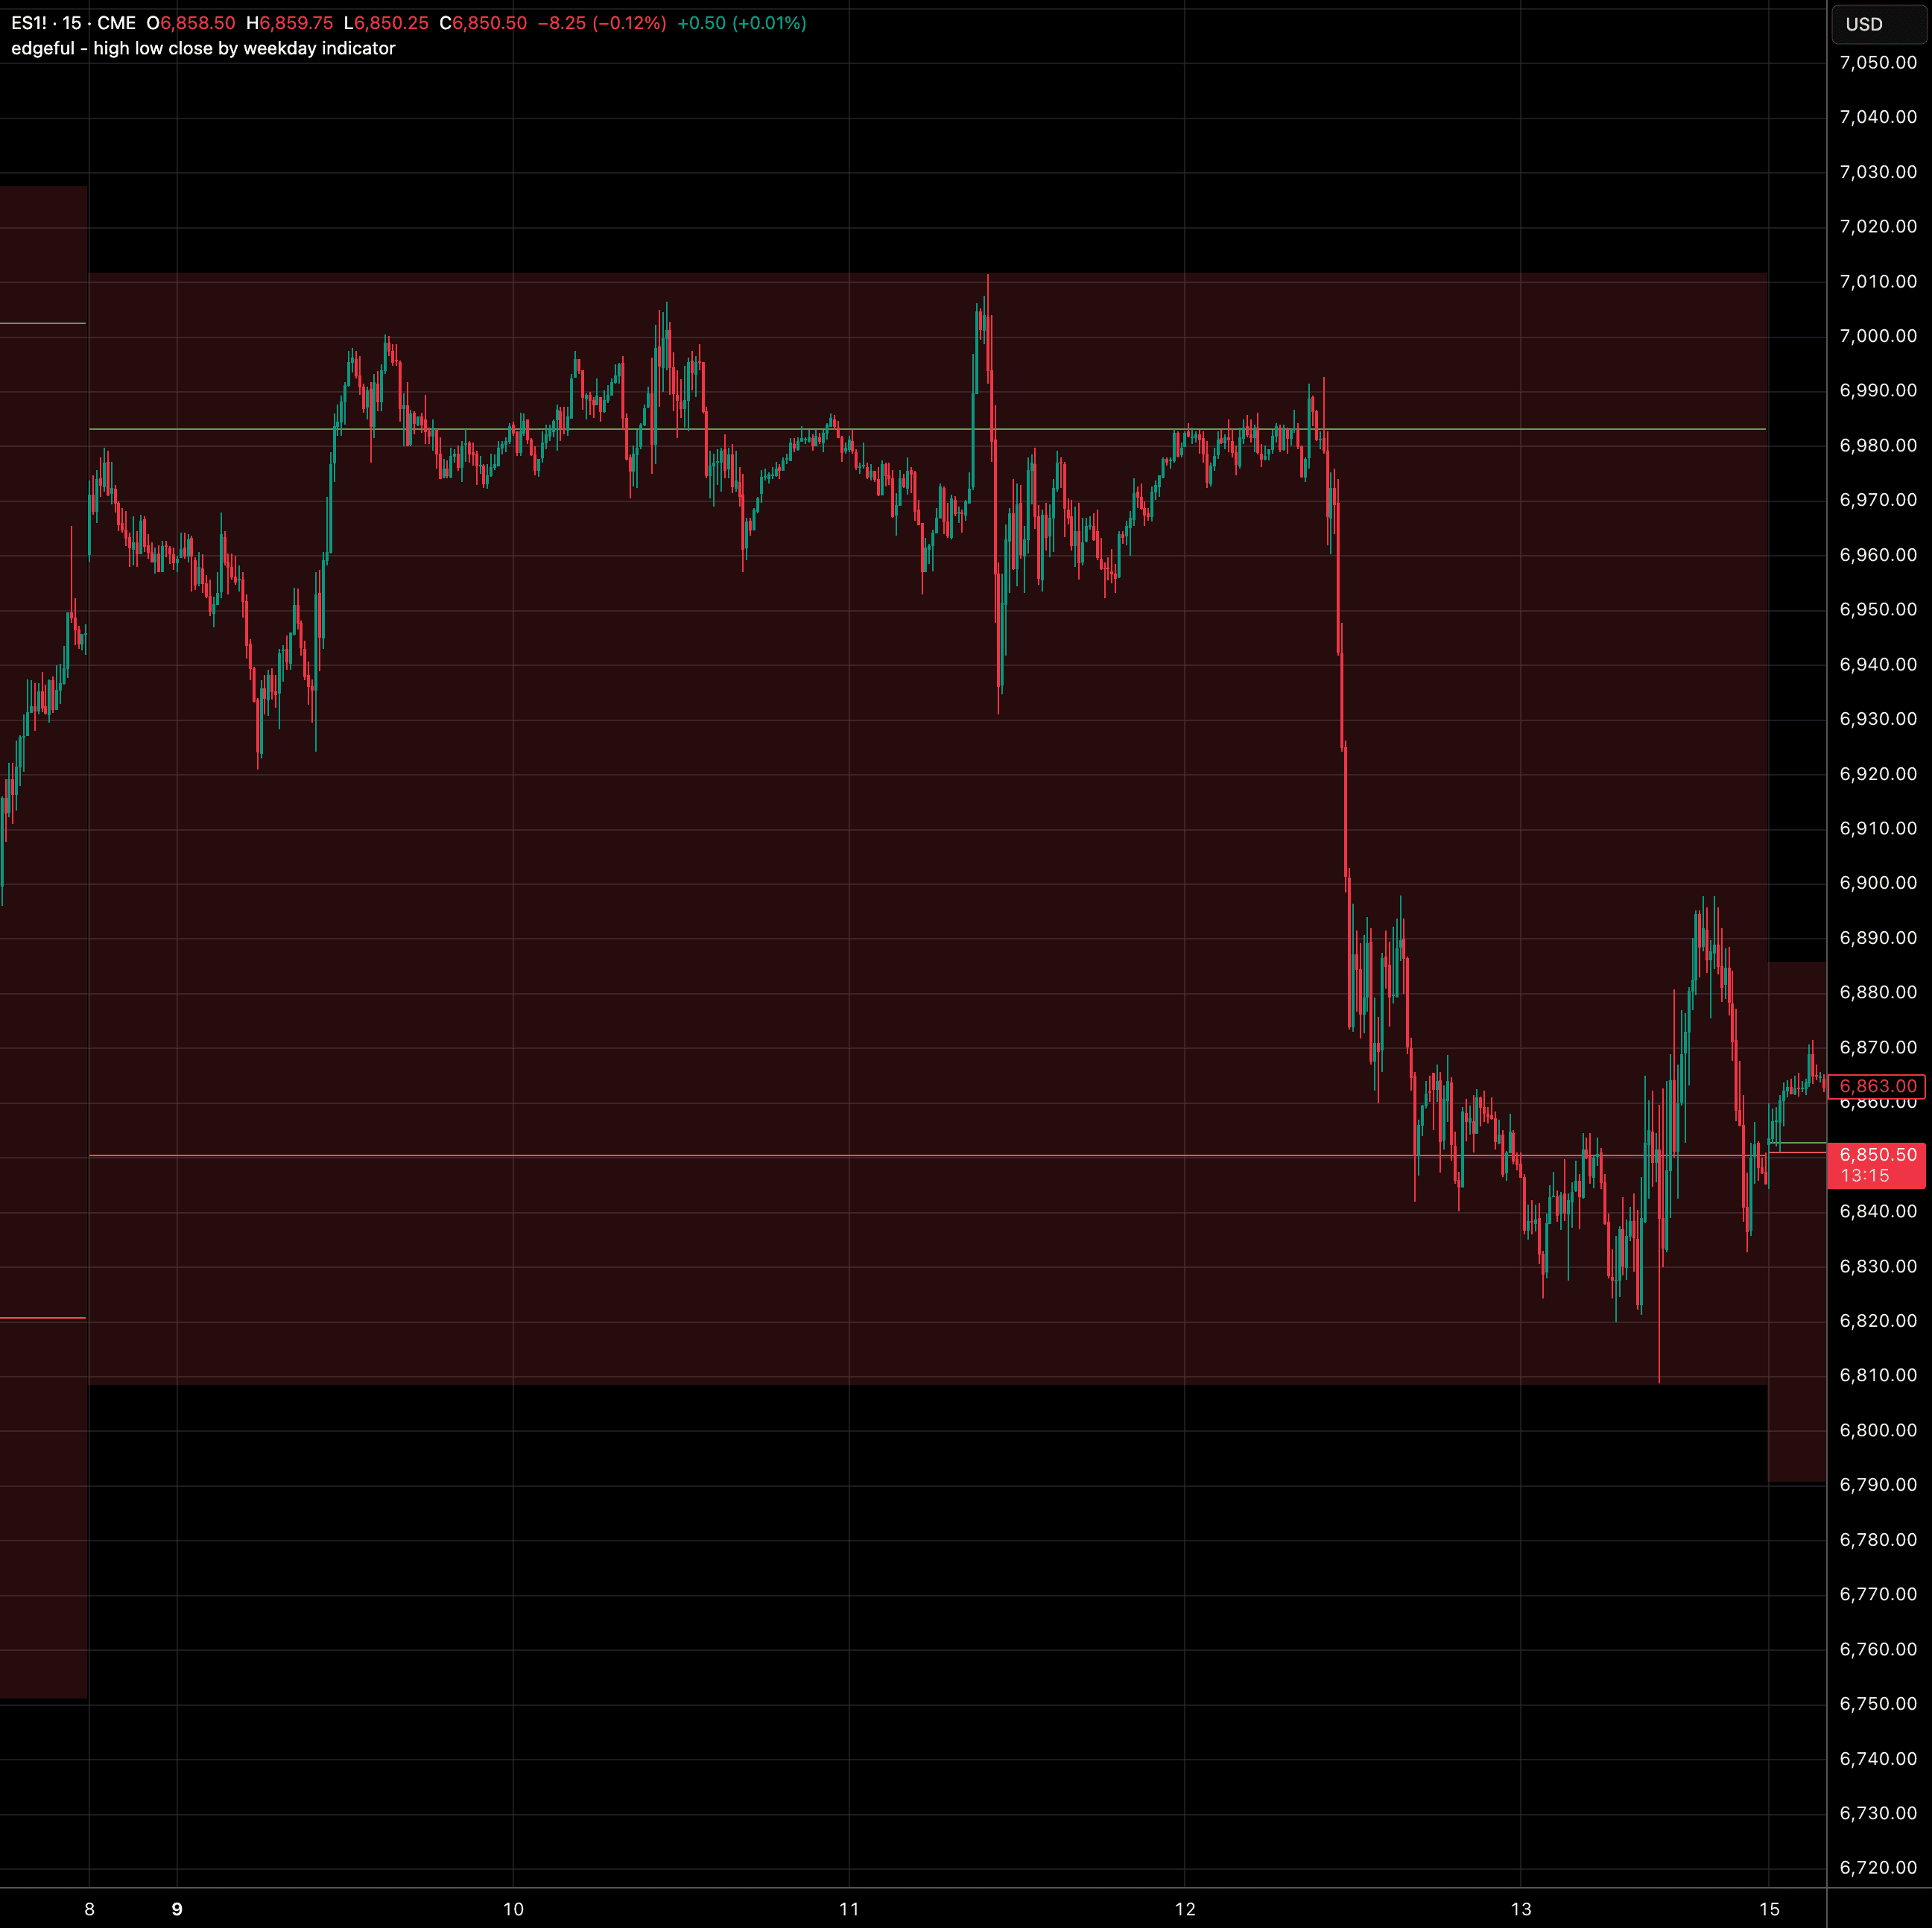
high low close by weekday
auto-plots weekly range boxes color-coded by direction with lines marking each week's highest and lowest closes.
specialty & dashboards
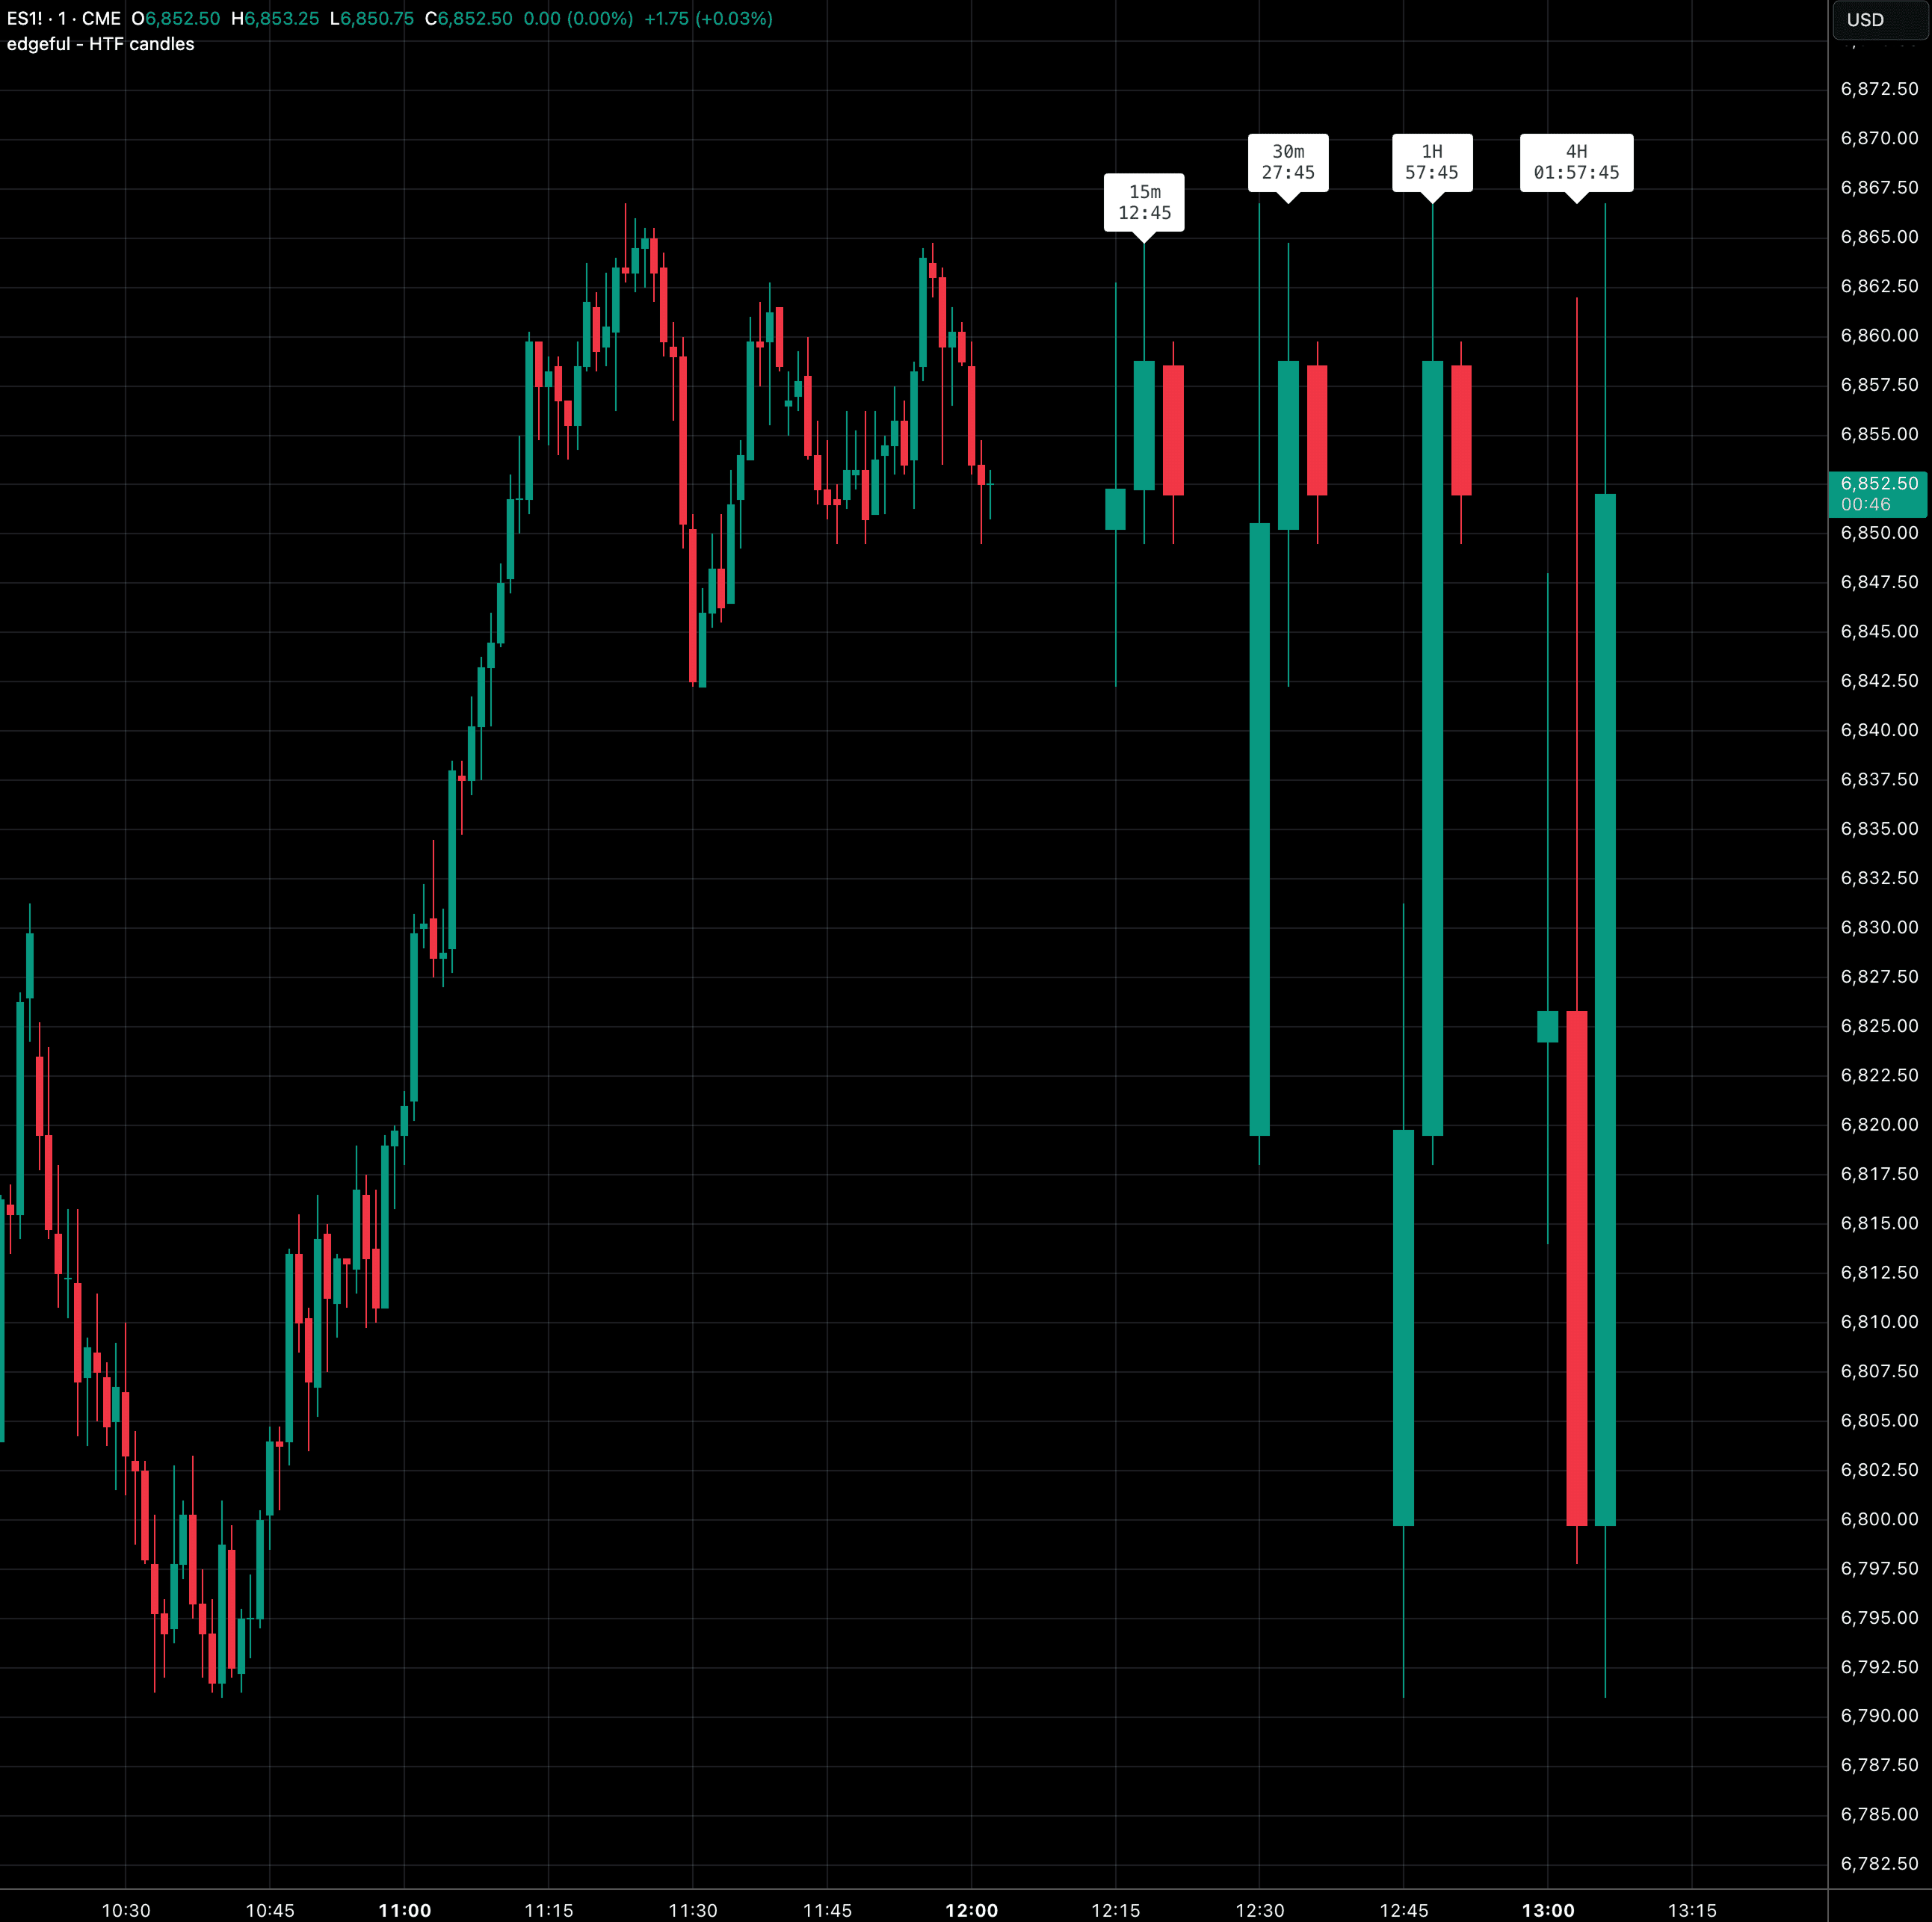
HTF candles
popular
overlays up to four higher timeframe candle sets on your chart with countdown timers for instant multi-timeframe context.
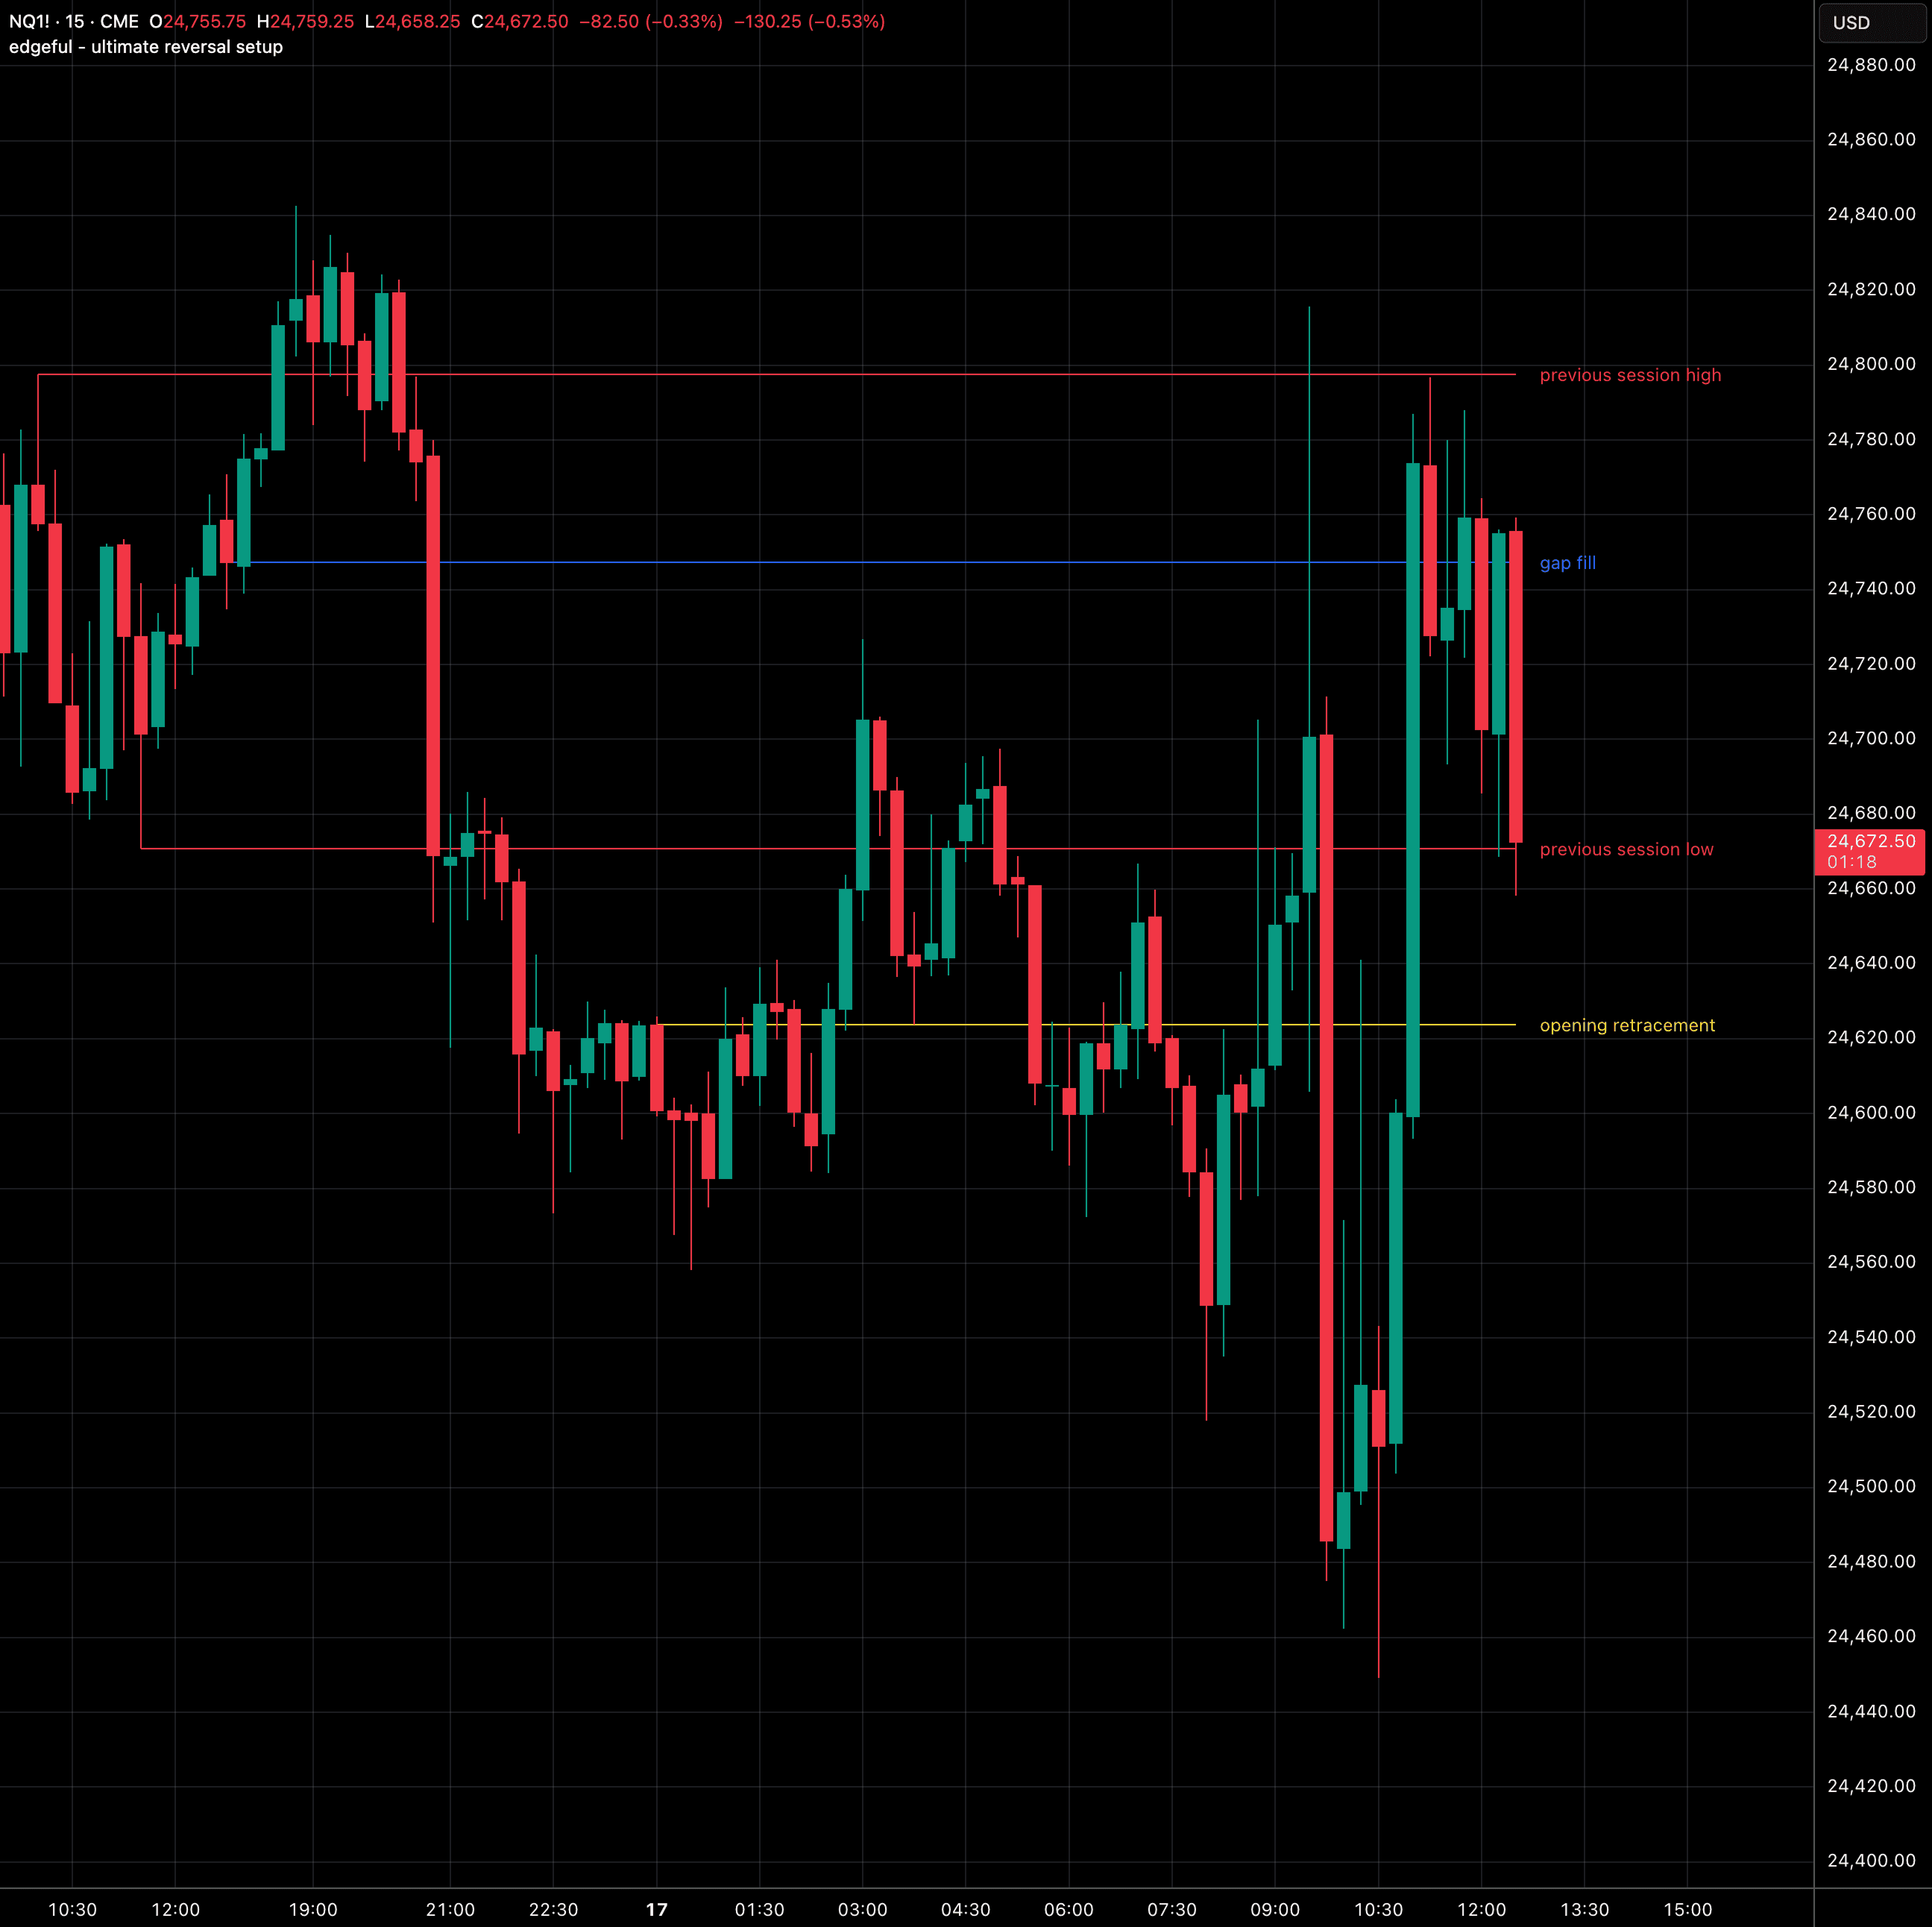
ultimate reversal setup
popular
auto-plots prior session high, low, close, and midnight open — the key levels for ICT-style reversal setups.
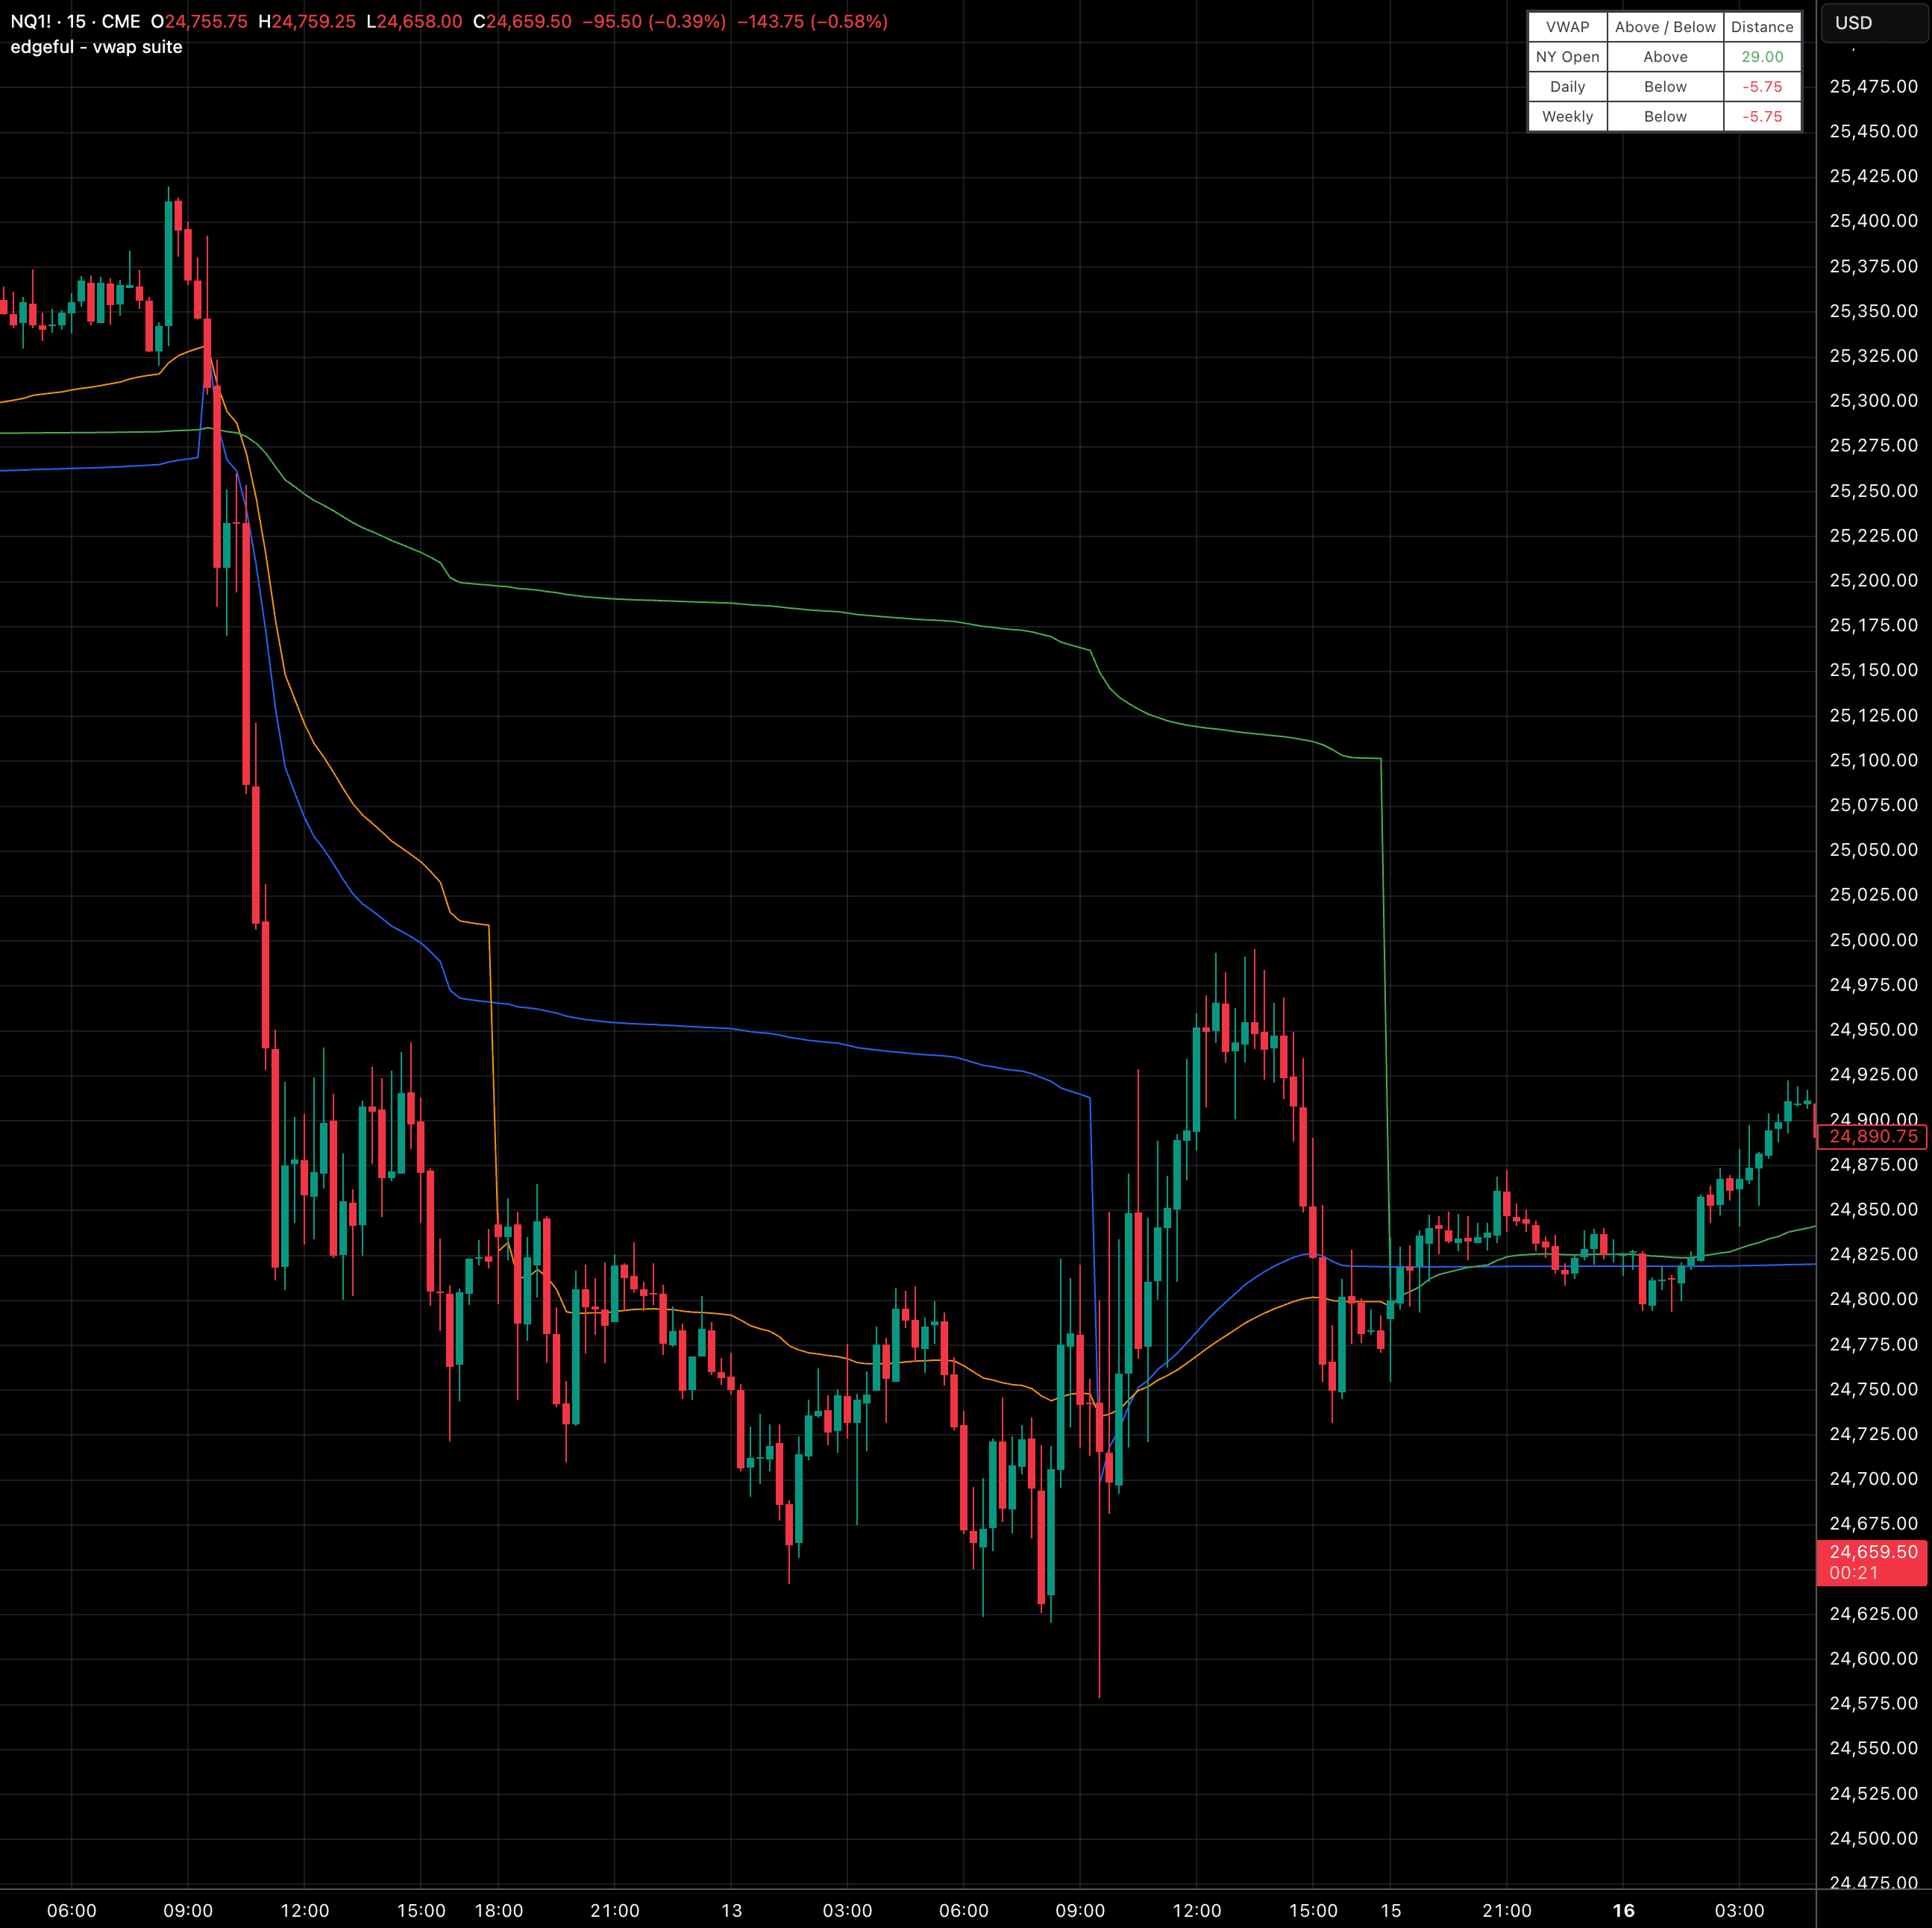
VWAP suite
popular
auto-plots NY open, daily, weekly, and custom VWAP lines with a dashboard showing price position and distance from each.
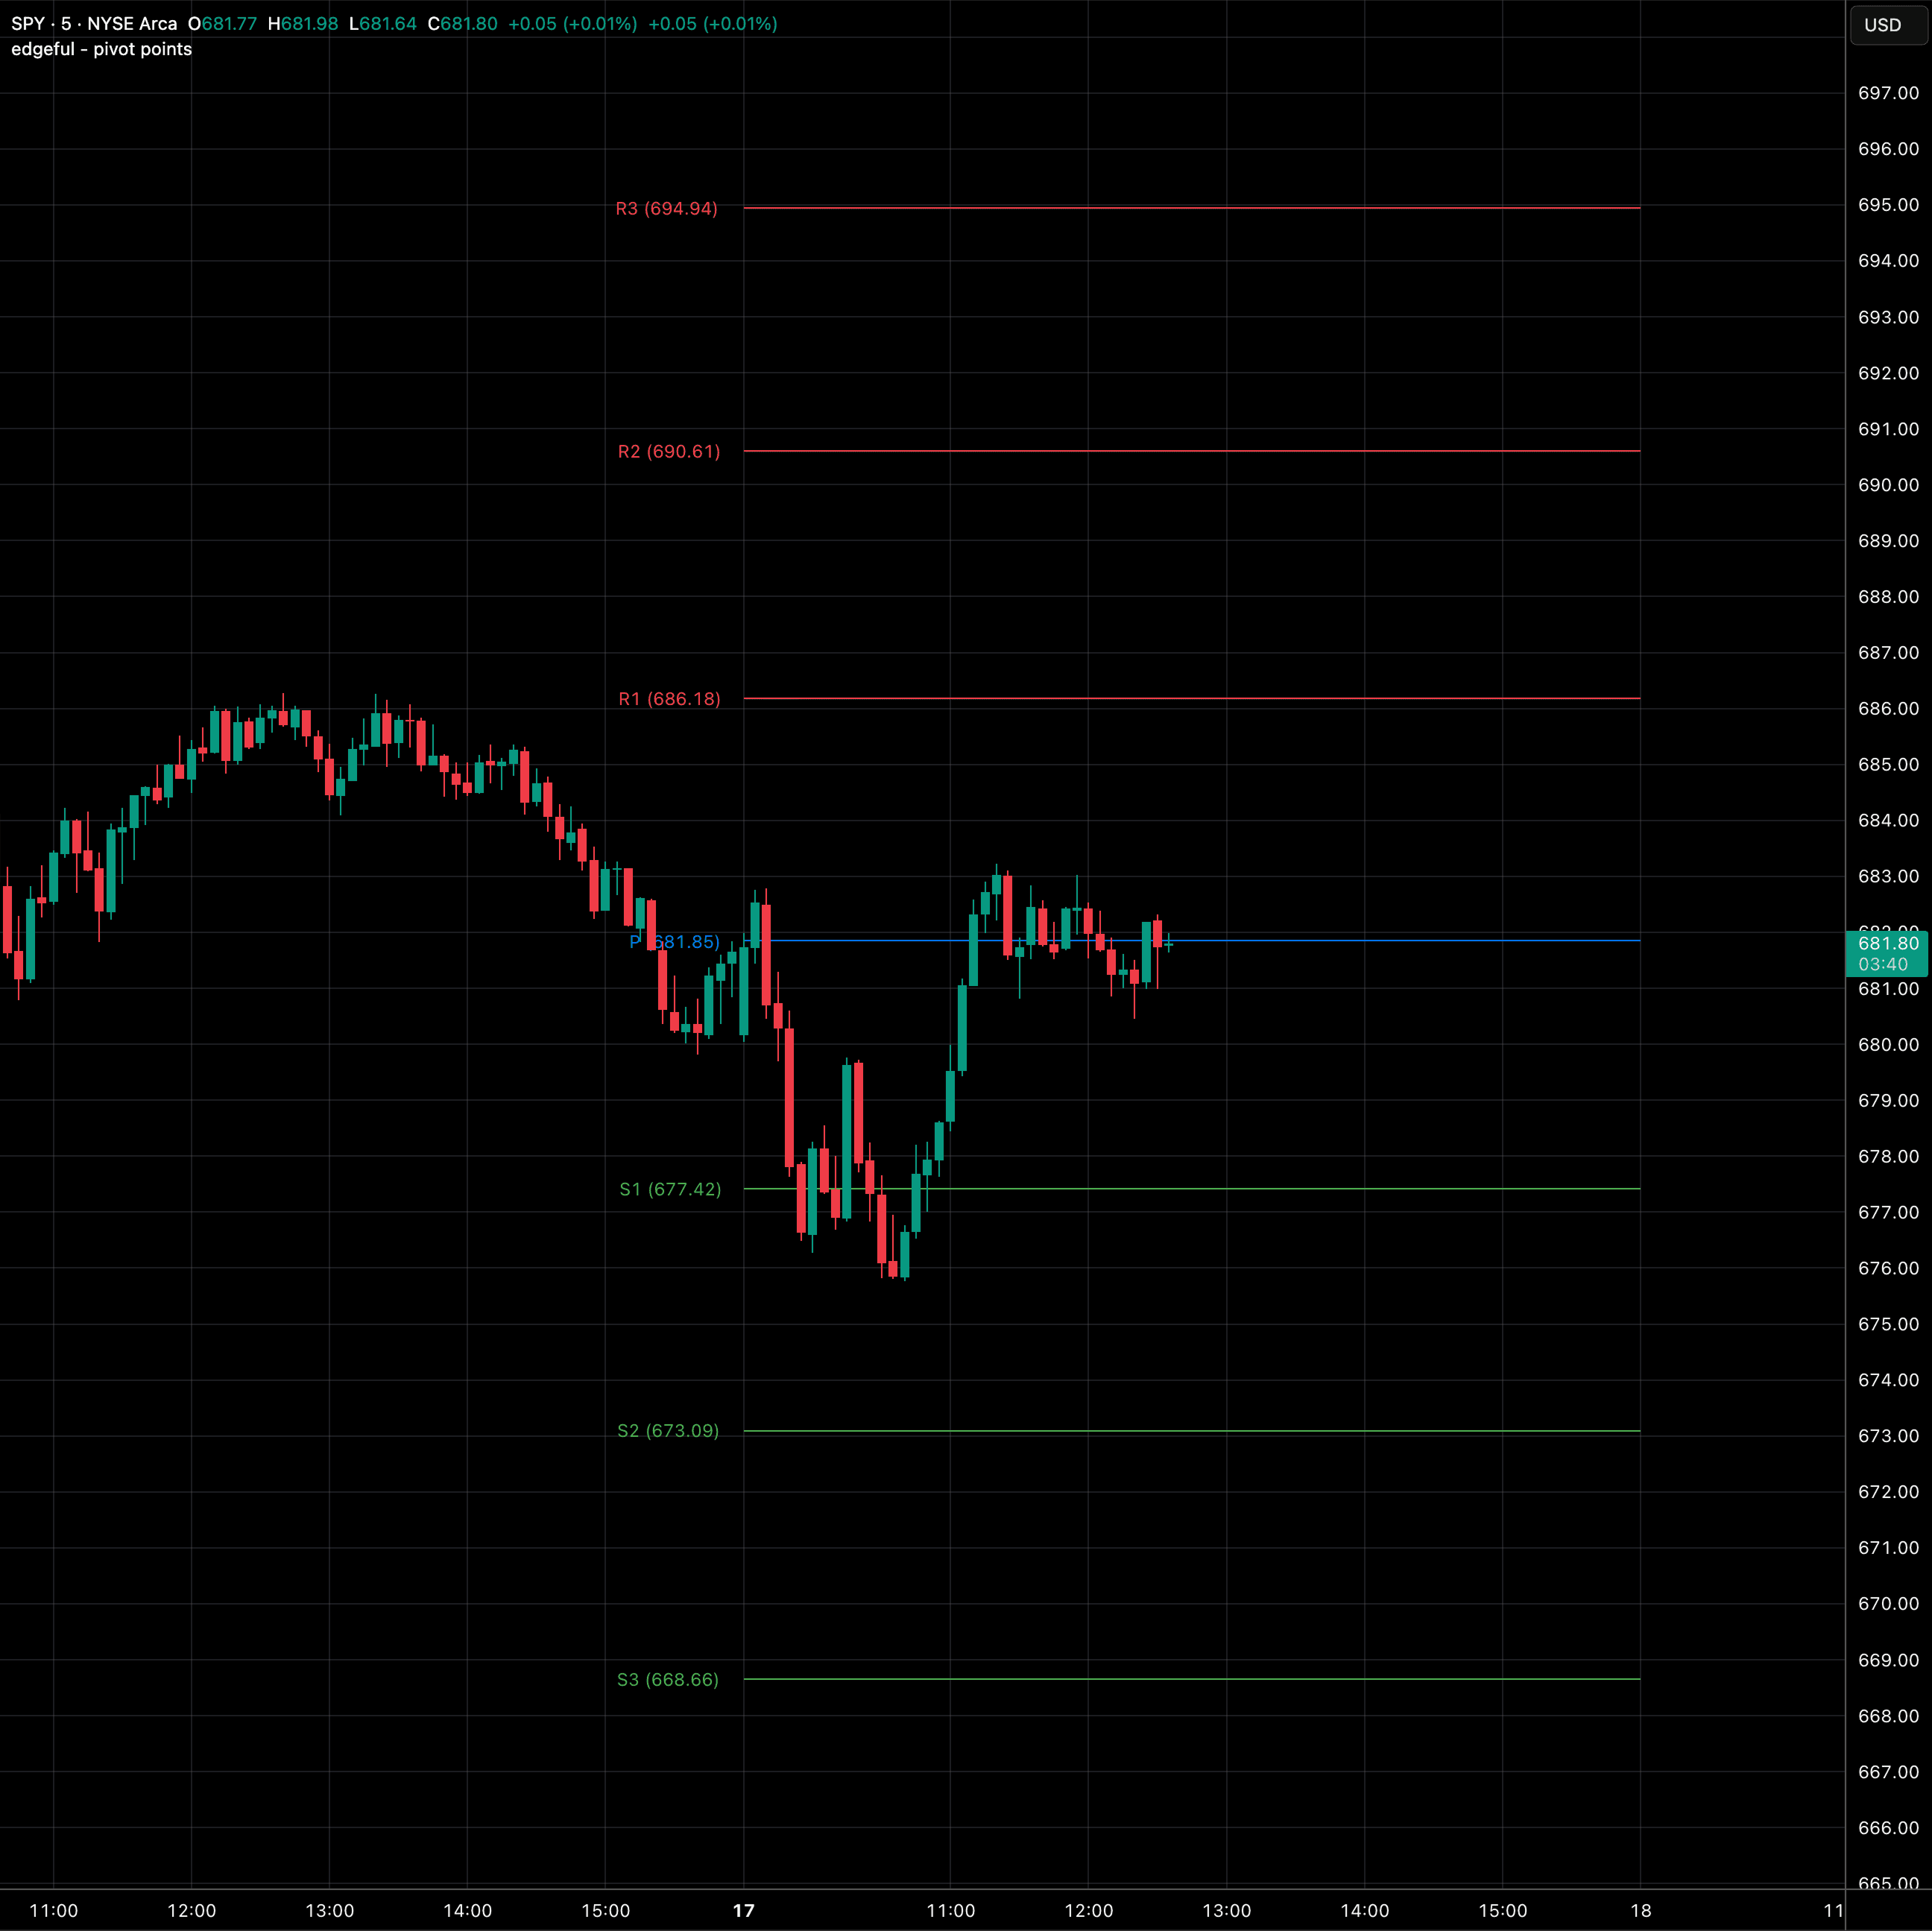
pivot points
auto-calculates P, S1-S5, and R1-R5 levels using six methods (Traditional, Fibonacci, Woodie, and more) across any timeframe.
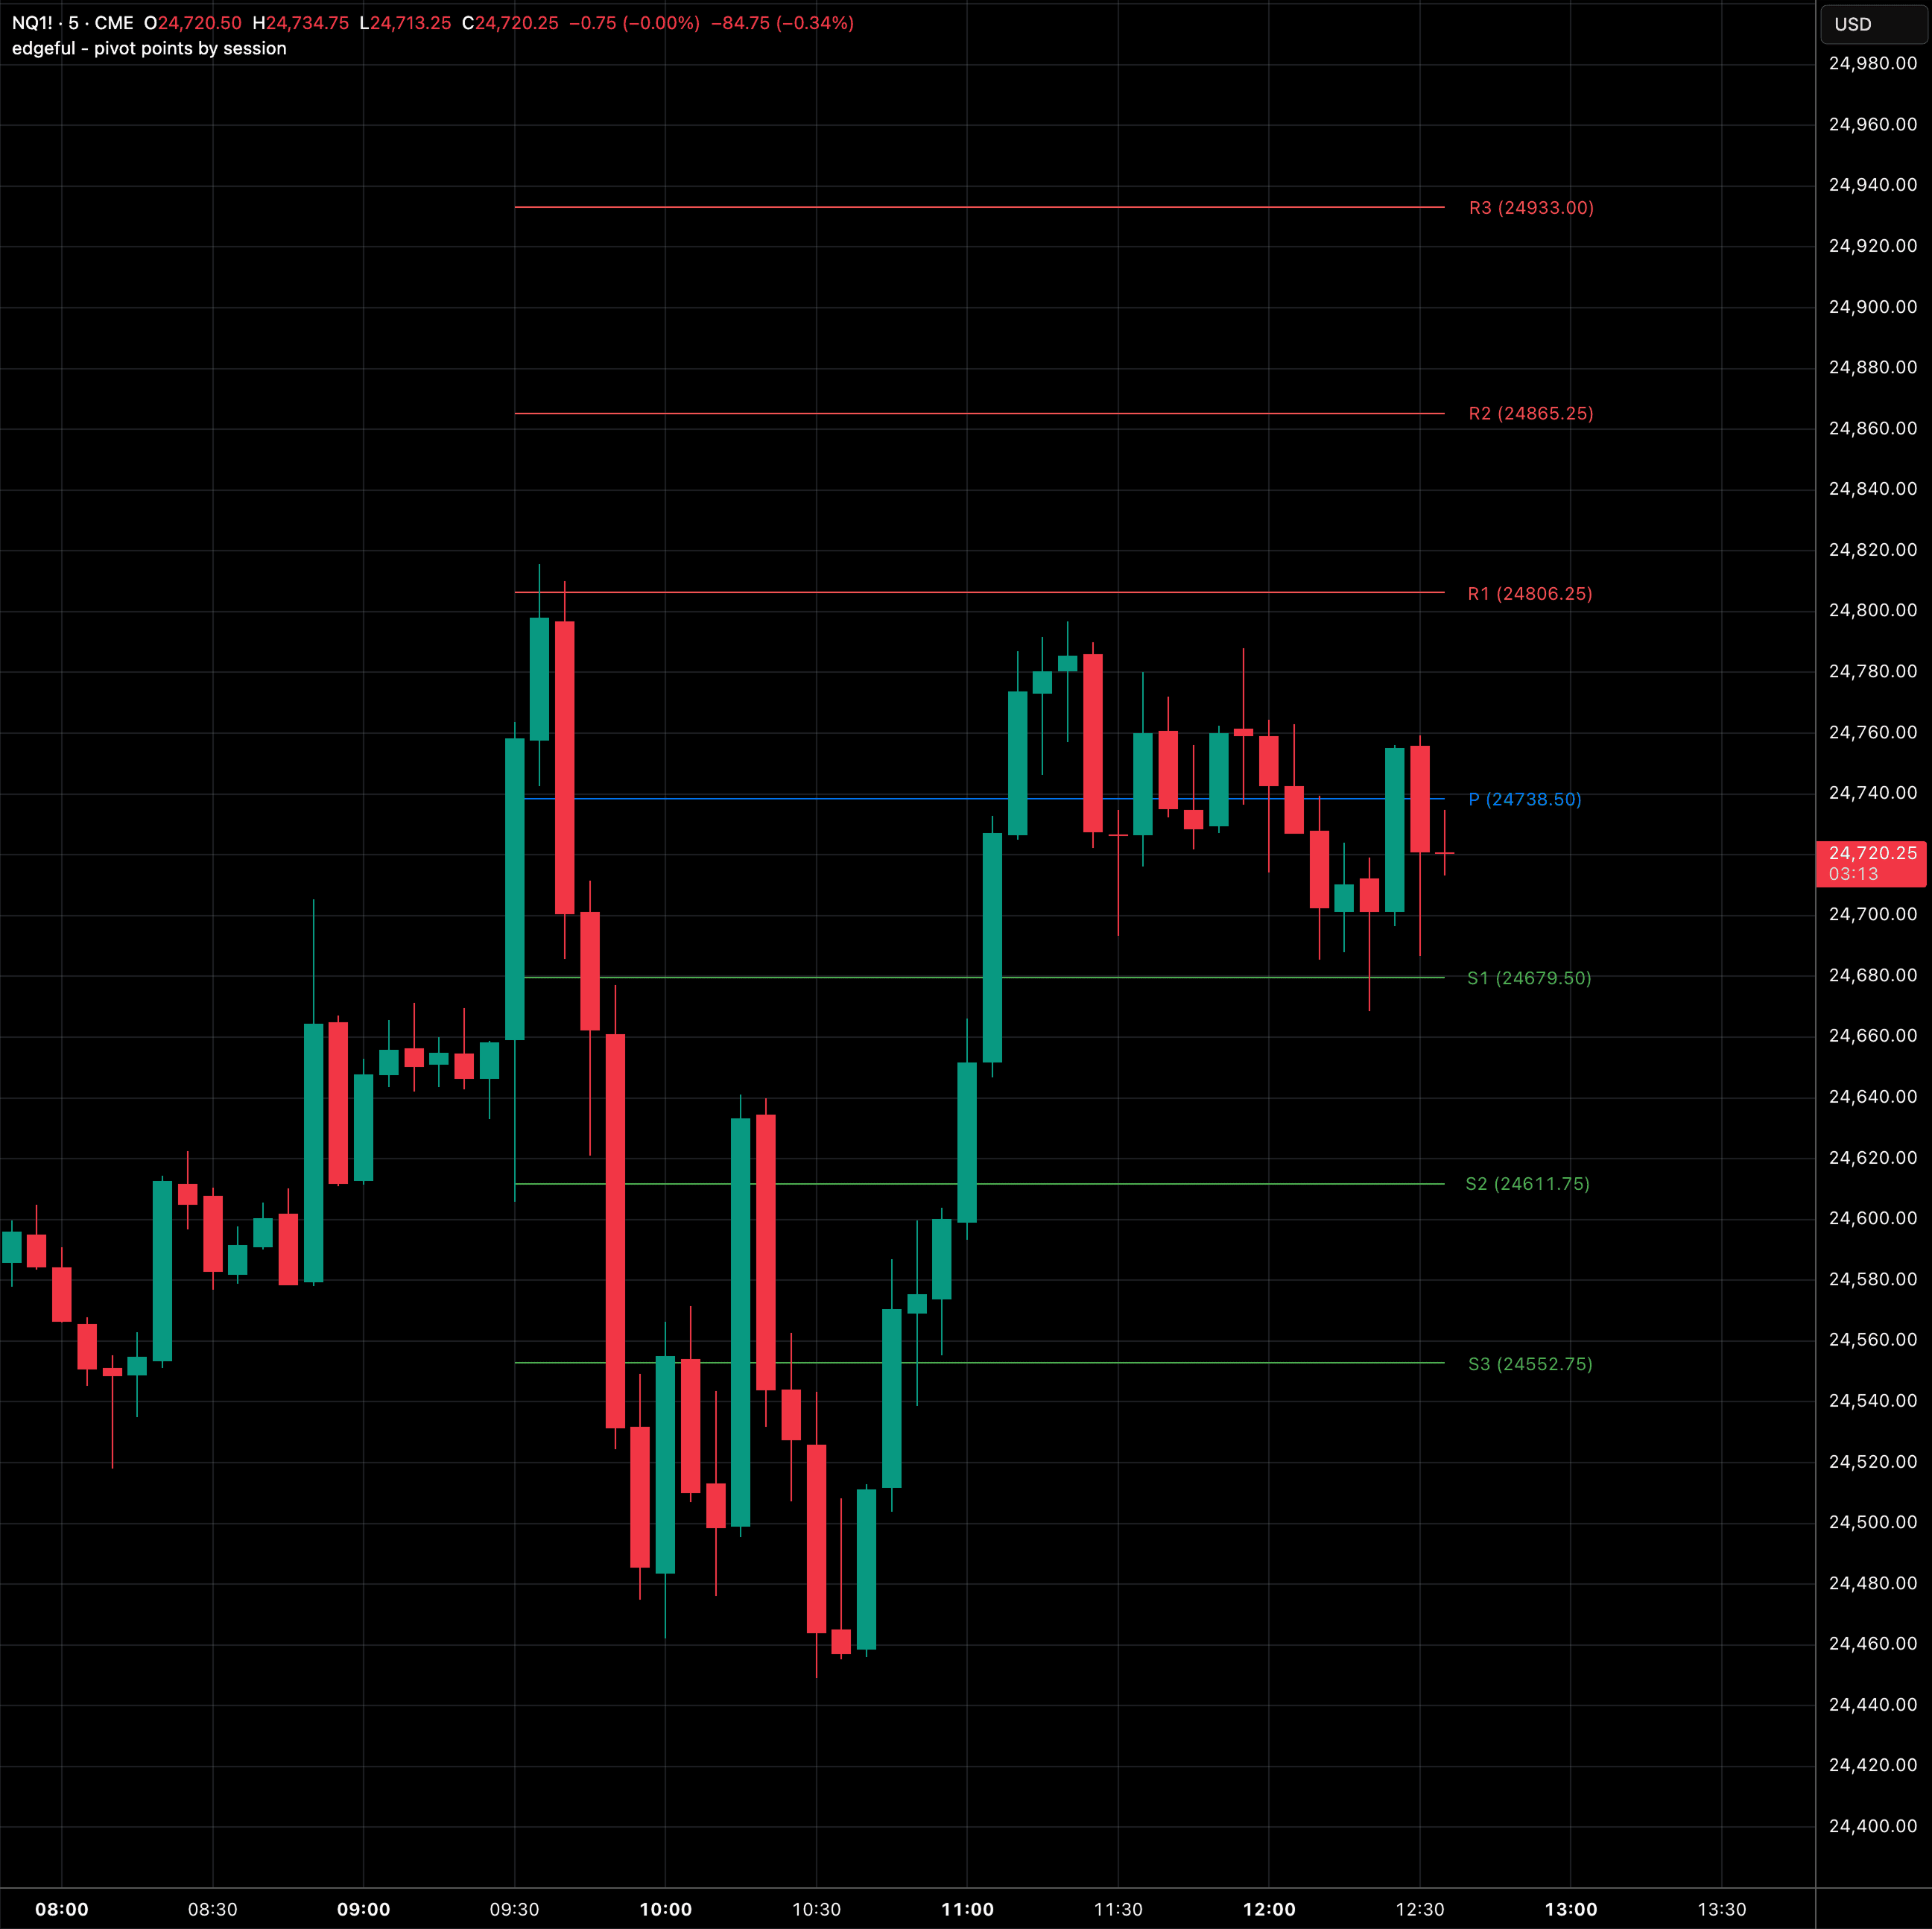
pivot points by session
auto-calculates pivot levels from your session's range (Tokyo, London, NY, Sydney) instead of daily data.
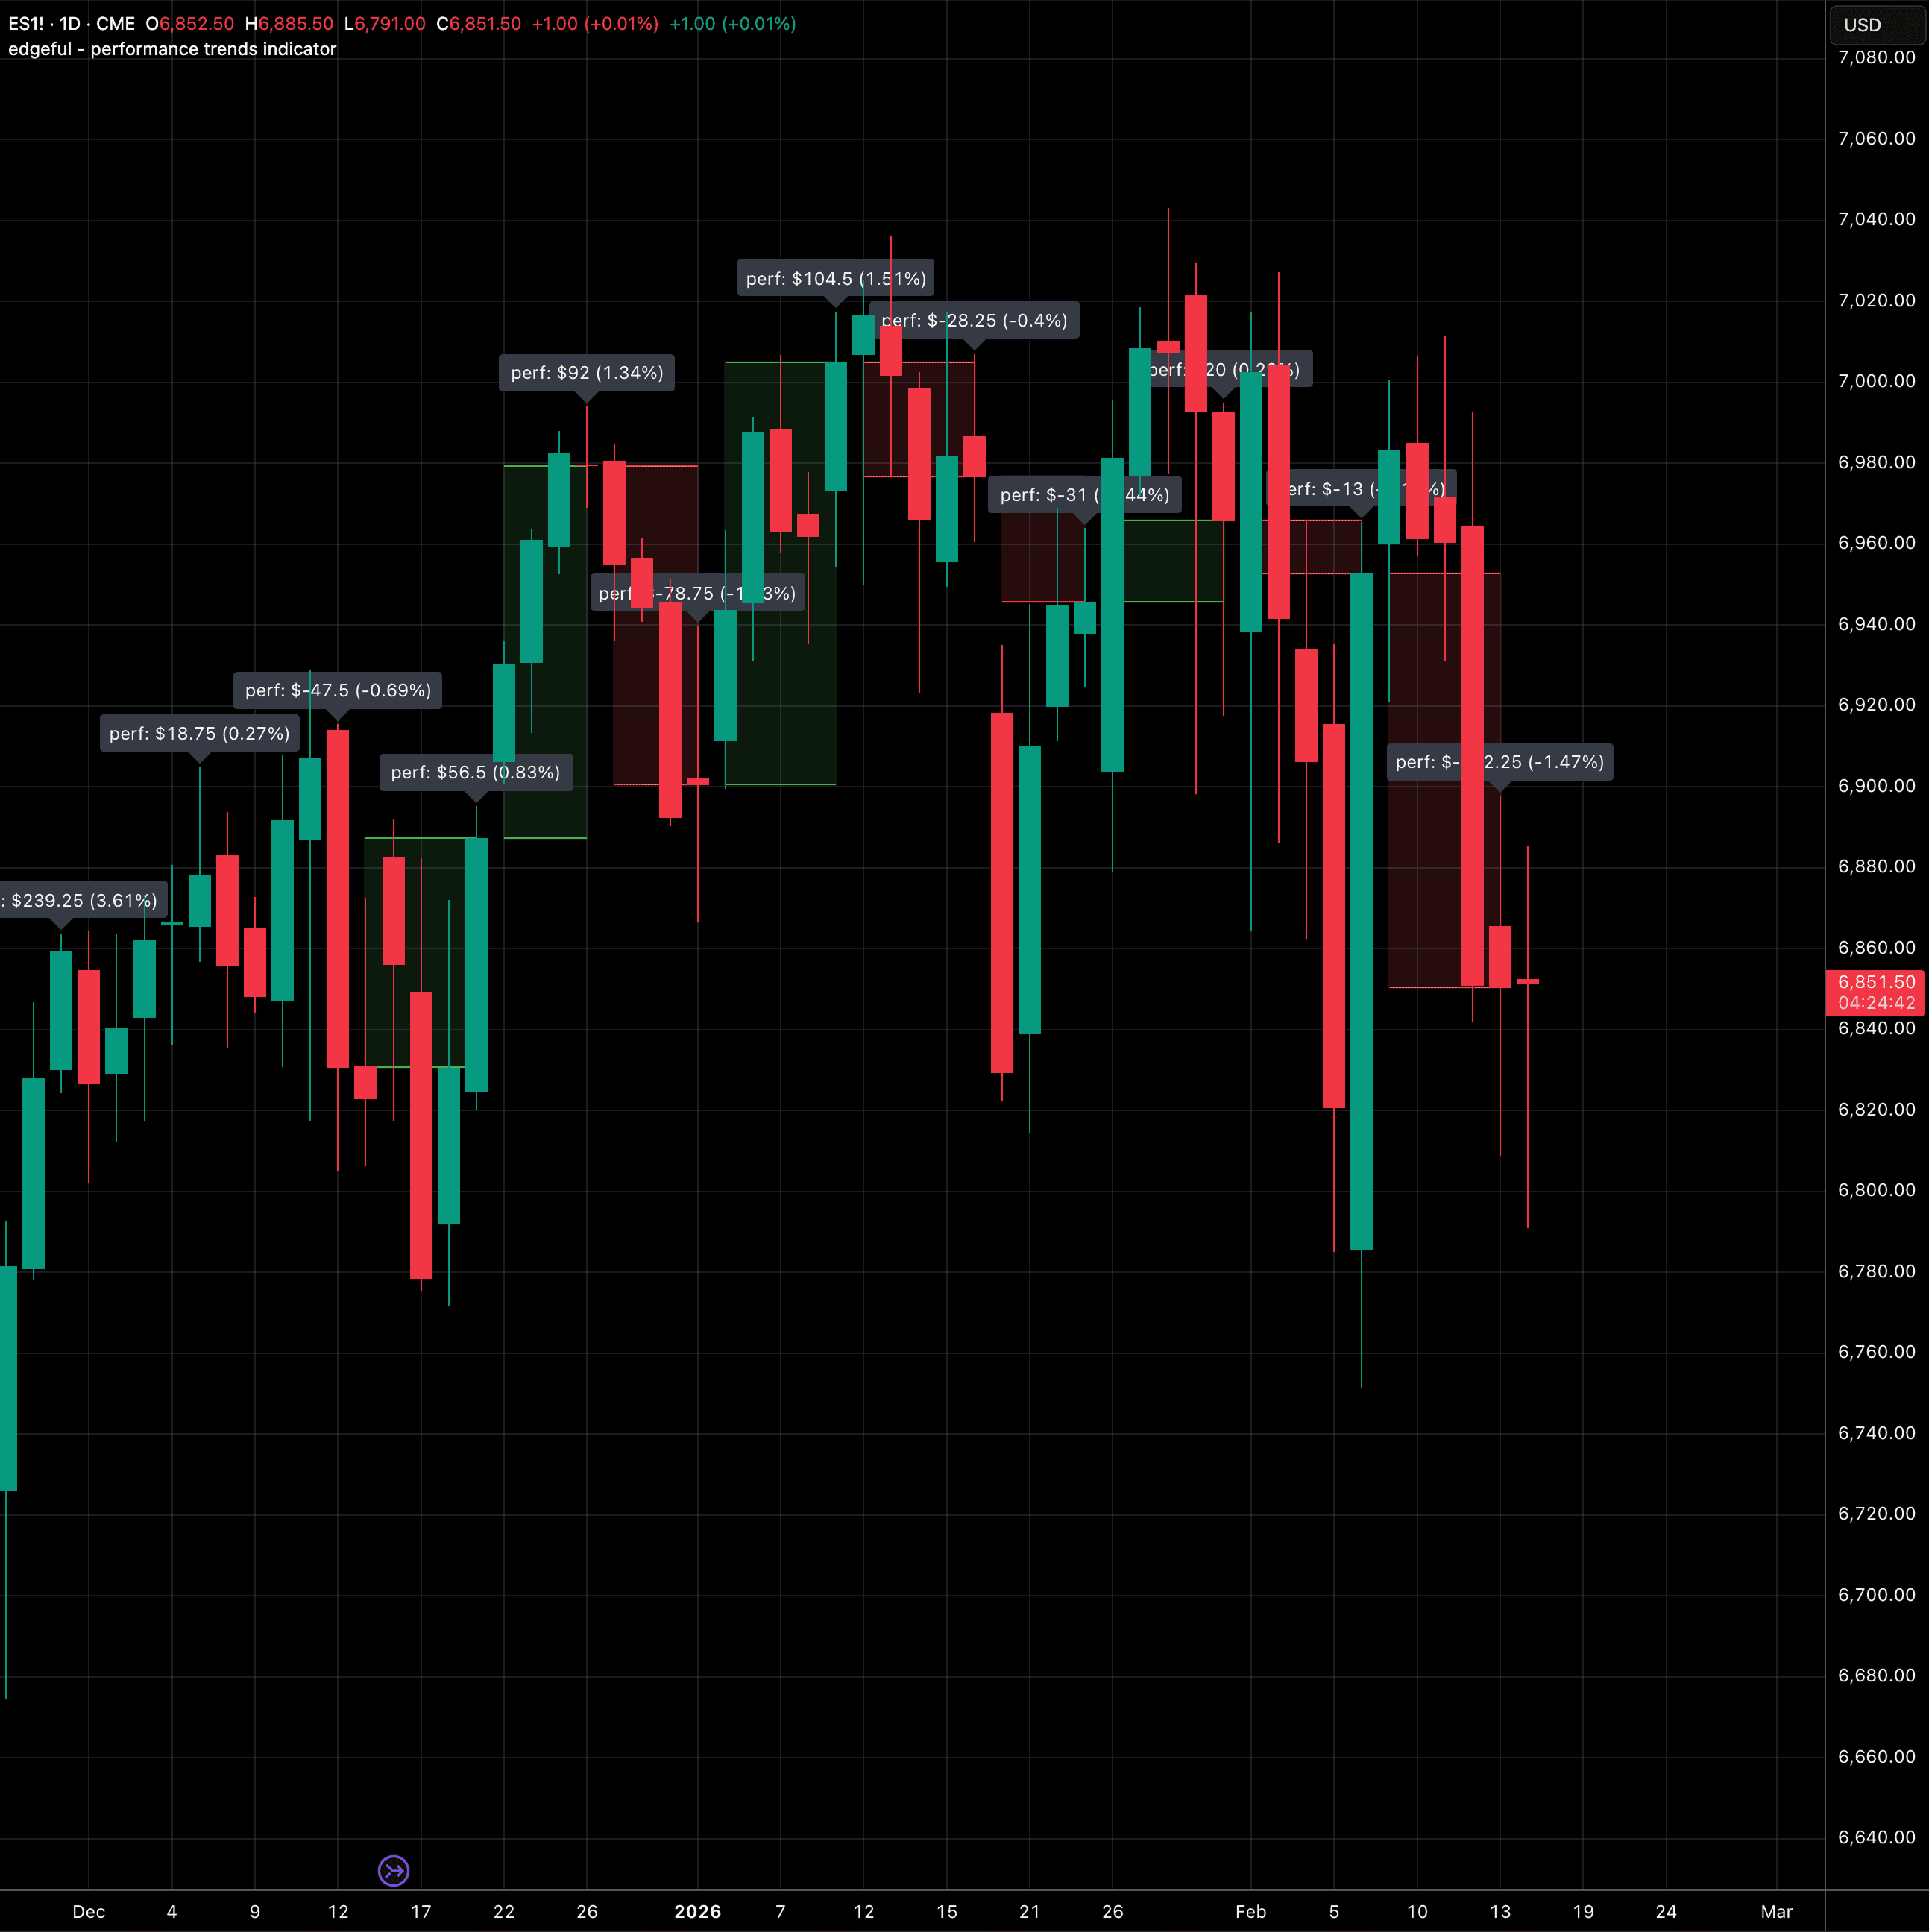
performance trends
auto-plots weekly performance boxes with dollar and percentage change labels to spot momentum trends at a glance.
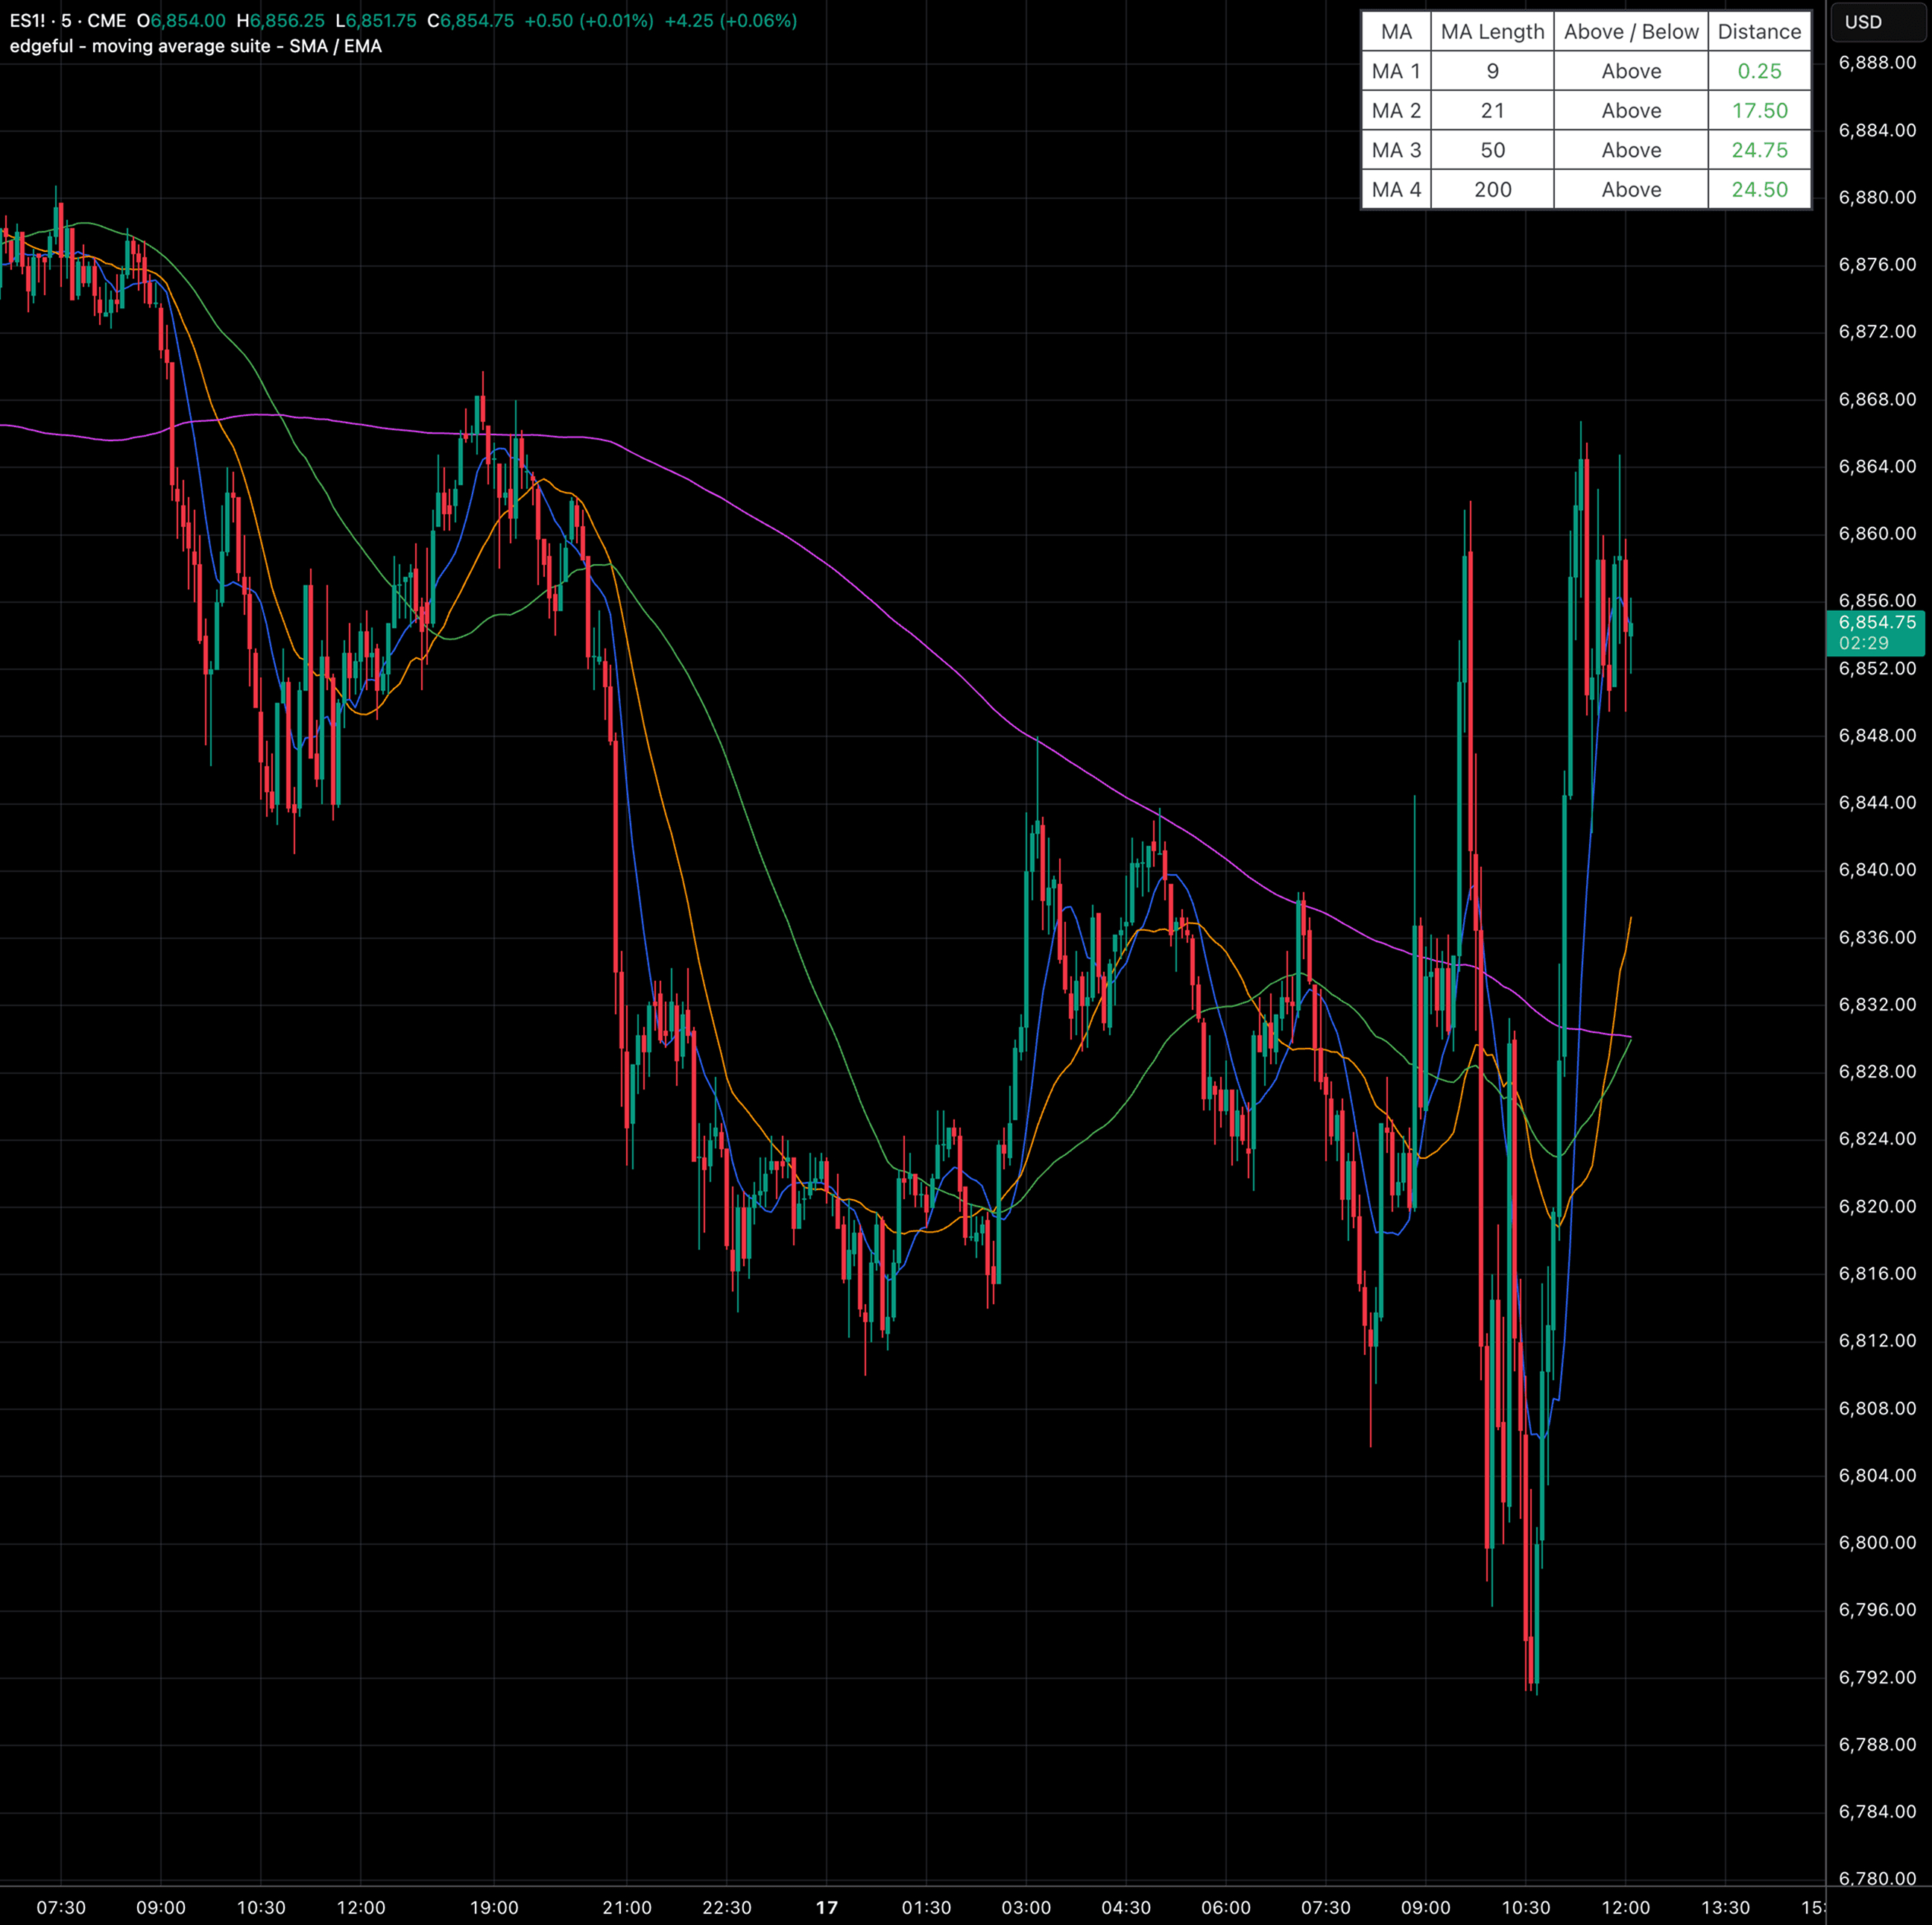
moving average suite - SMA/EMA
moving average suite — plots up to four SMA or EMA lines with multi-timeframe support and a dashboard showing price distance from each.
join thousands of traders
say goodbye to blown accounts and time
wasted on manual analysis.
"Stacking confluences is the name of the game, the more bias and % chances show up on reports, the higher odds you can make an extremely high probability trade, so increasing size might be worth considering. If the reports do not align, then you know you should be using the smallest size possible because the odds are simply not in your favor."
"They don't tell you how to trade, except perhaps if you pay for their algo. I do not use them but devour their reports and have created several profitable day trade strategies from their data."
"Very pleased to have joined Edgeful and gained access to some great Reports for the indices I trade. I'm enjoying the live streams too. The indicators are very useful too!"