market session correlation
labels each session as green or red at close so you can spot directional patterns across global sessions.
information
market session correlation|edgeful.com
what it does
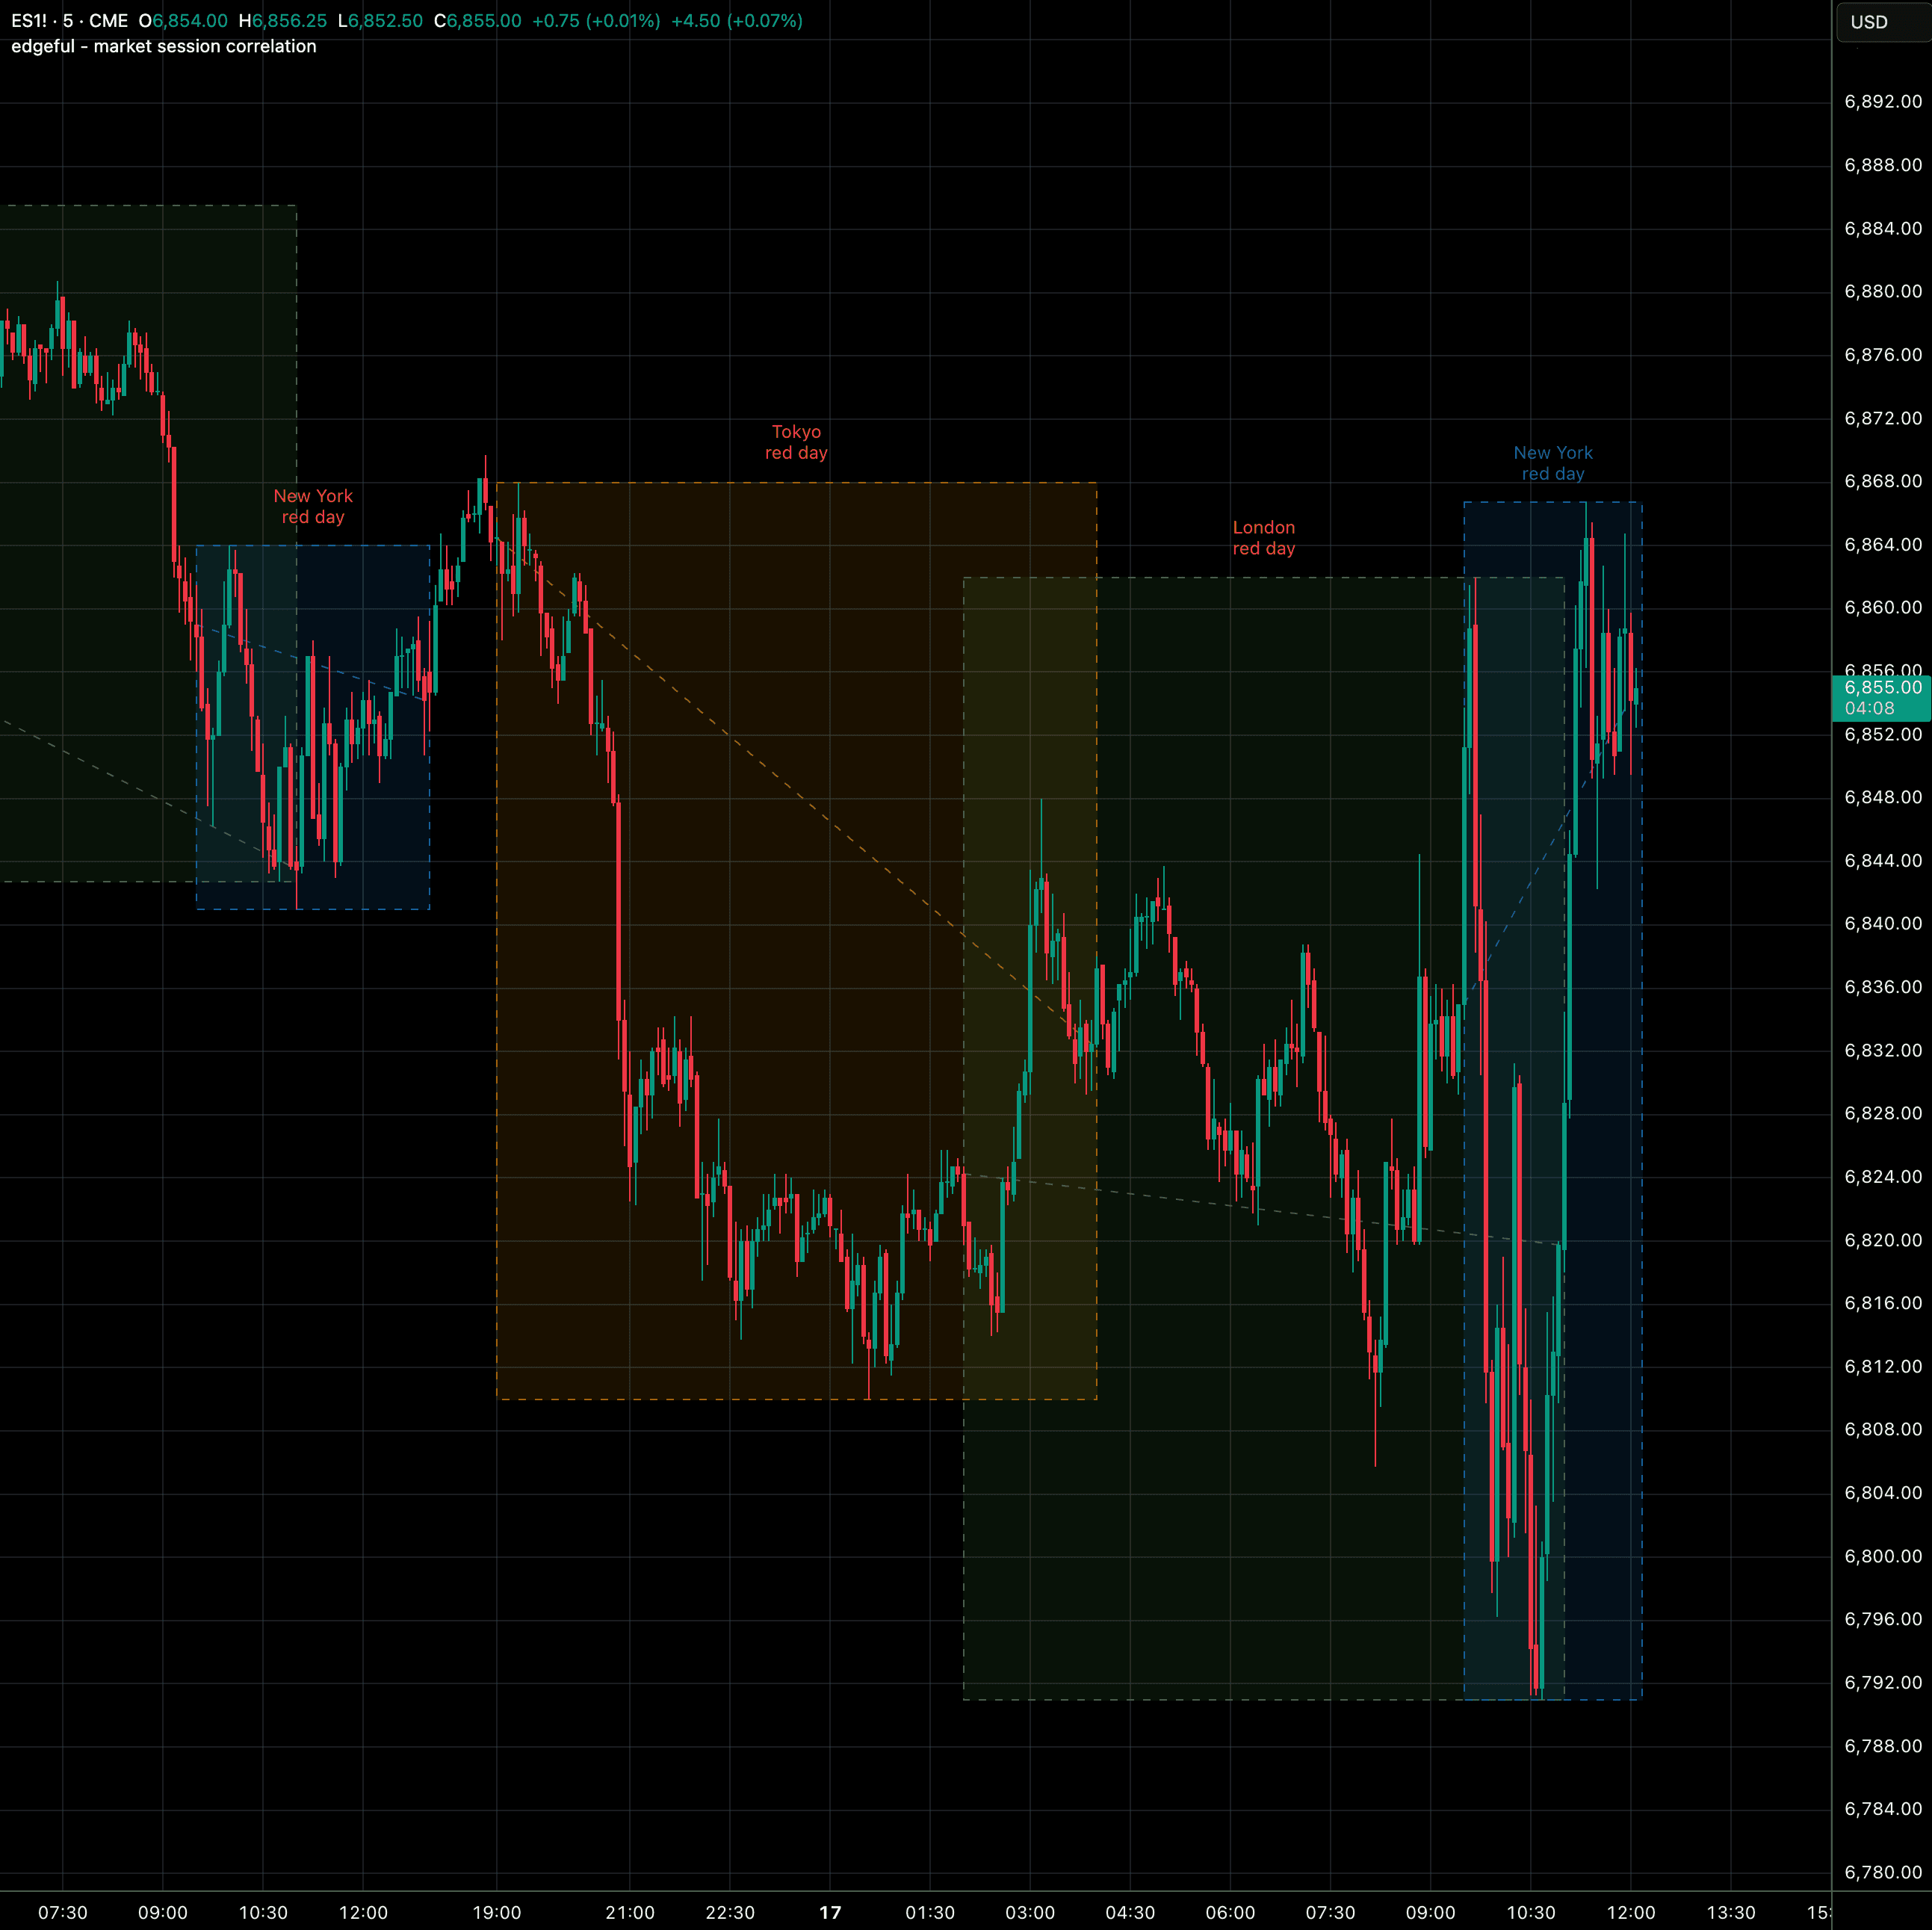
this indicator plots session boxes for Tokyo, London, New York, and Sydney while adding correlation analysis between sessions. at session close, labels display whether the session was a 'green day' (closed above open) or 'red day' (closed below open).
color-coded labels based on session direction help identify patterns like whether London following a green Tokyo tends to continue bullish, or whether NY tends to reverse London's direction. this cross-session analysis supports inter-market trading strategies.
key features
session direction indicator (green/red day labels)
open-to-close line showing session trend
color-coded text based on bullish/bearish close
session boxes with high/low tracking
alert conditions for session events
explainer chart
market session correlation|edgeful.com