ATR zones
auto-plots the expected daily range using ATR with real-time zones showing how much potential upside and downside remains unfilled.
information
ATR zones|edgeful.com
what it does
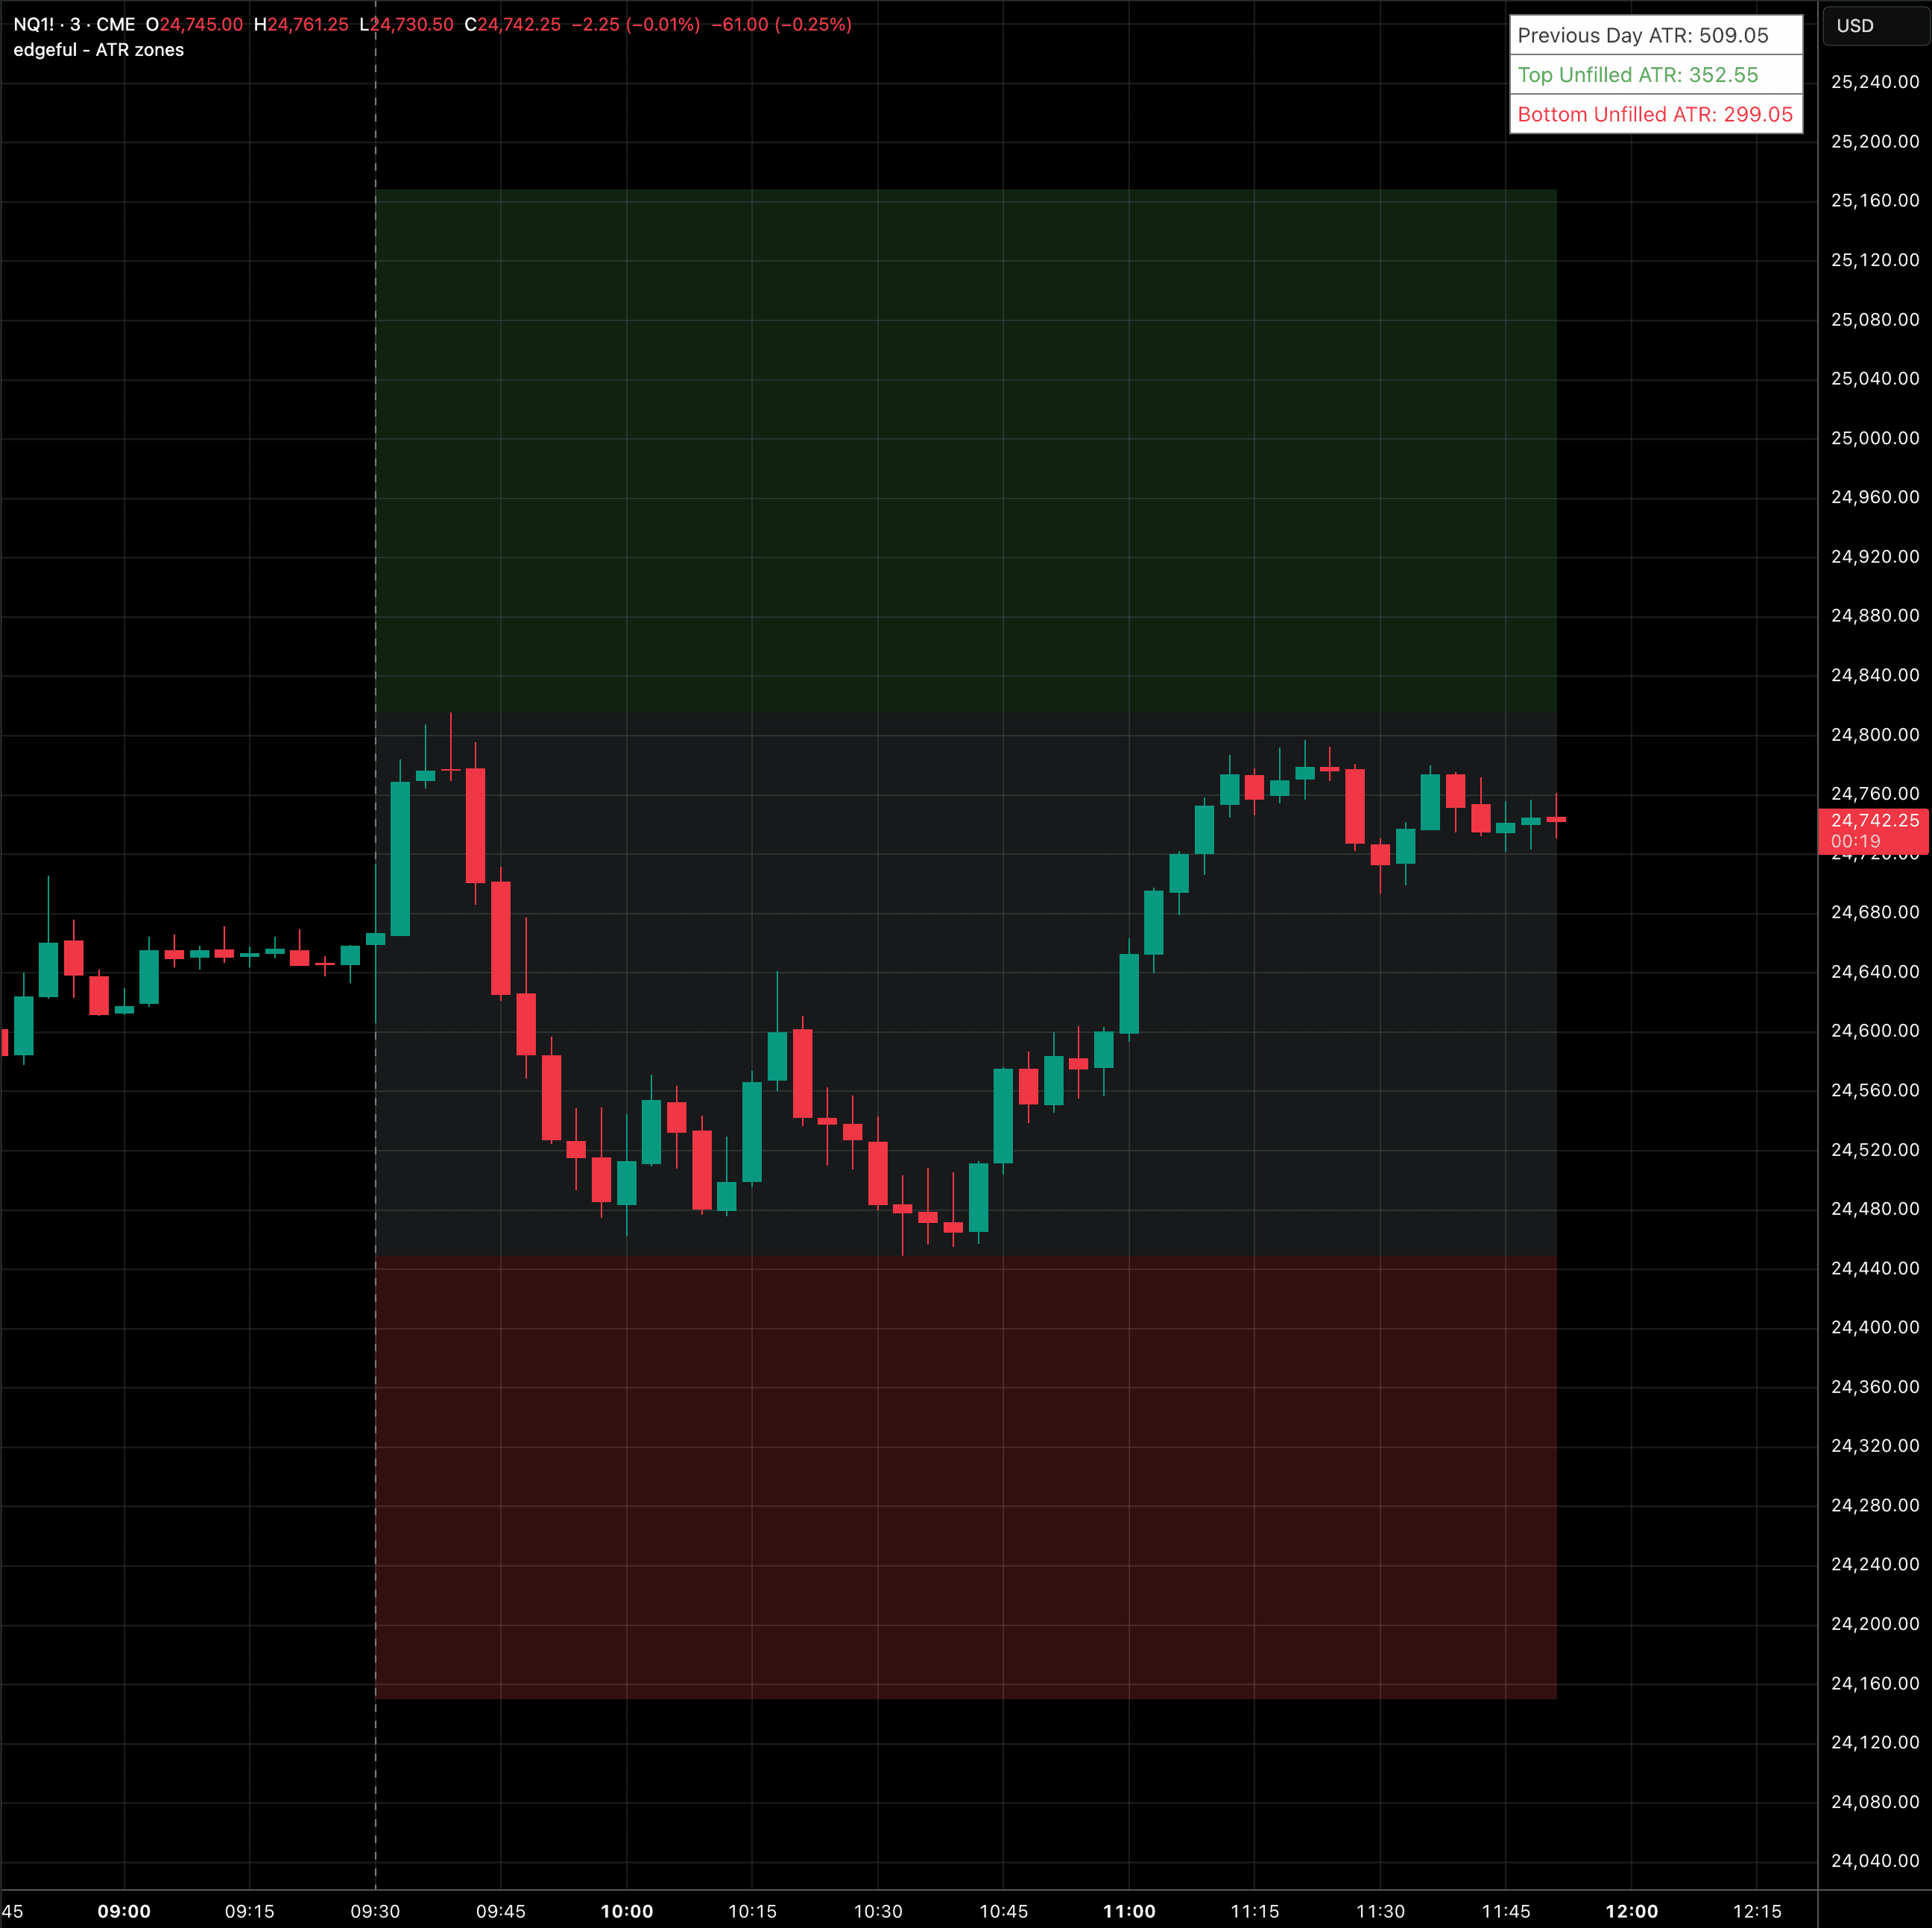
this indicator uses the 14-period average true range (ATR) from the previous day to project expected price movement. it creates three visual zones: the filled zone (gray) showing actual range covered, unfilled top zone (green) showing remaining upside potential, and unfilled bottom zone (red) showing remaining downside potential.
a dashboard displays the ATR value and how much unfilled range remains above and below. zones become transparent as price fills the expected range, providing real-time feedback on range completion.
key features
14-period daily ATR calculation
three-zone visualization: filled, unfilled top, unfilled bottom
real-time zone updates as price moves
dashboard showing ATR and remaining unfilled range
daily divider vertical lines
explainer chart
ATR zones|edgeful.com