initial balance (IB)
auto-plots the first hour's high/low with multiple extension and retracement levels, plus a live stats dashboard.
information
initial balance (IB)|edgeful.com
what it does
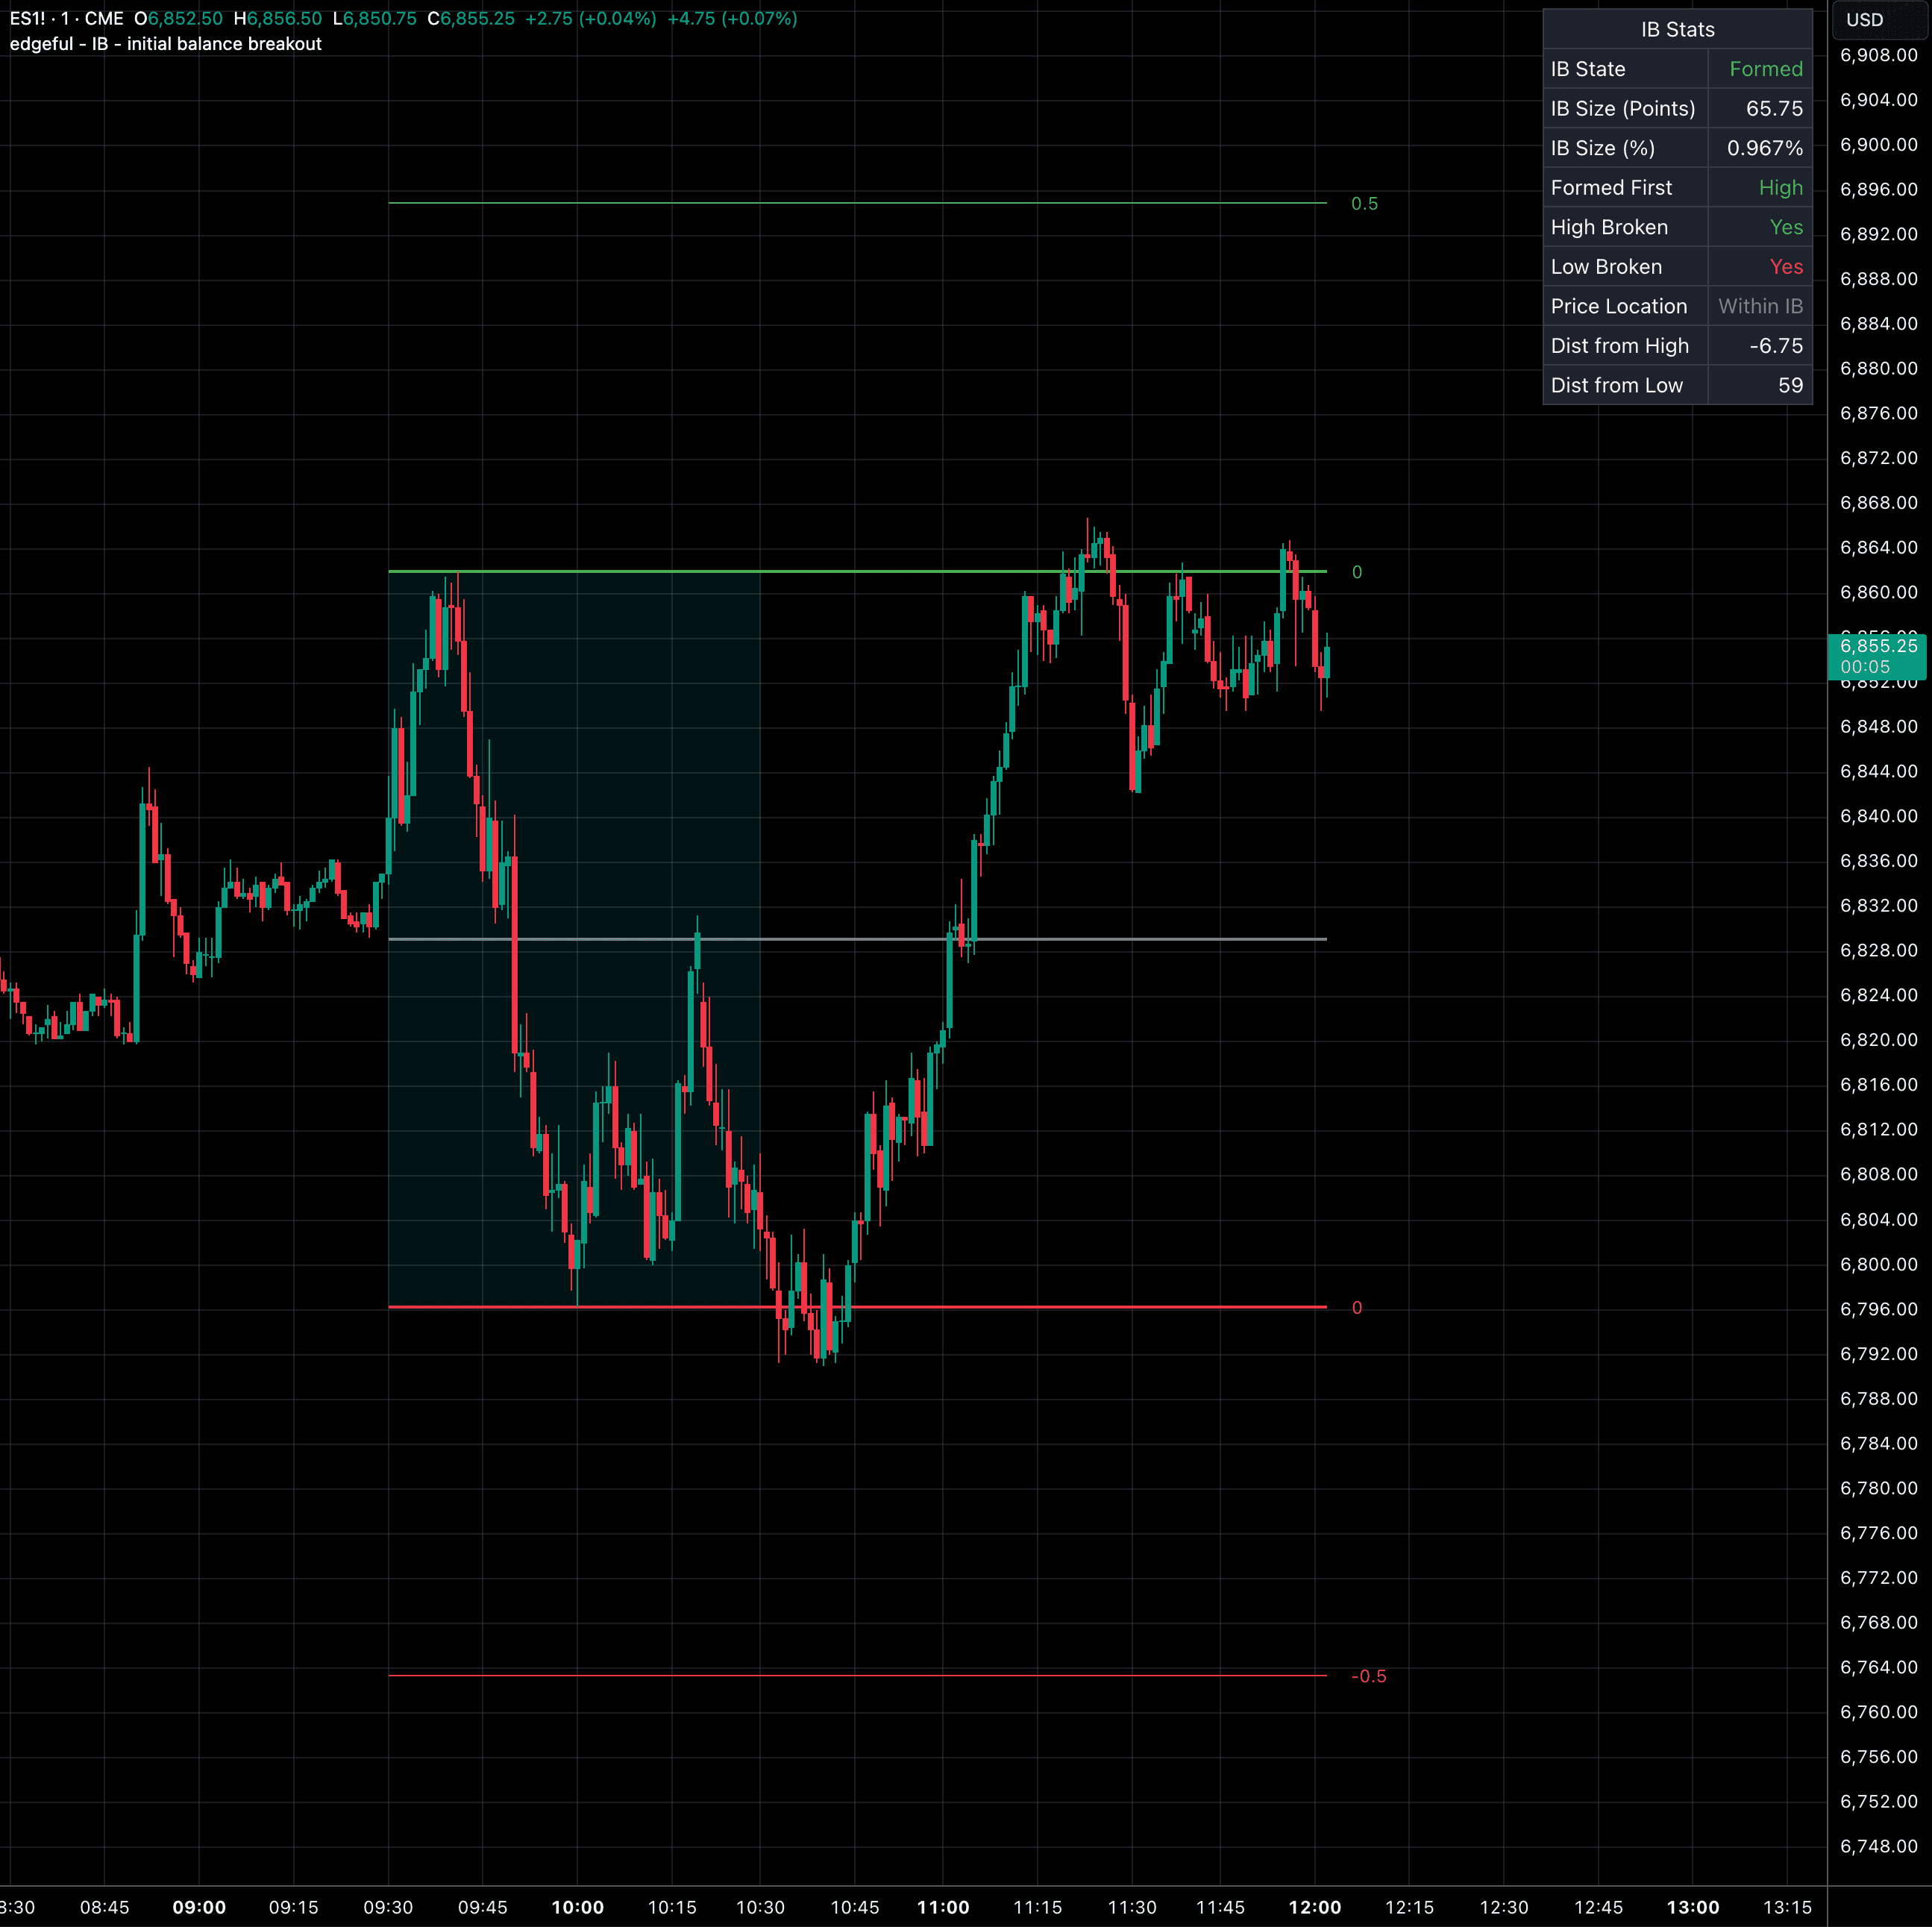
this indicator calculates the high and low of the IB period (typically the first hour, 9:30-10:30 AM). it draws horizontal lines at these levels that extend throughout the trading day, with optional extension and retracement levels based on the IB size.
a dashboard displays real-time statistics including IB state, size in points and percentage, which level formed first, breakout status, price location relative to IB, and distance from high and low levels.
key features
one-hour default formation window (vs 15 minutes for ORB)
up to 16 extension levels based on IB size multiples
three retracement levels within the IB range (25%, 50%, 75%)
real-time dashboard with IB statistics
breakout tracking for both high and low
explainer chart
initial balance (IB)|edgeful.com