opening candle continuation
auto-plots the first hour's price action, and then automatically classifies the candle as bullish or bearish to help you determine your bias for the rest of the session.
information
opening candle continuation|edgeful.com
what it does
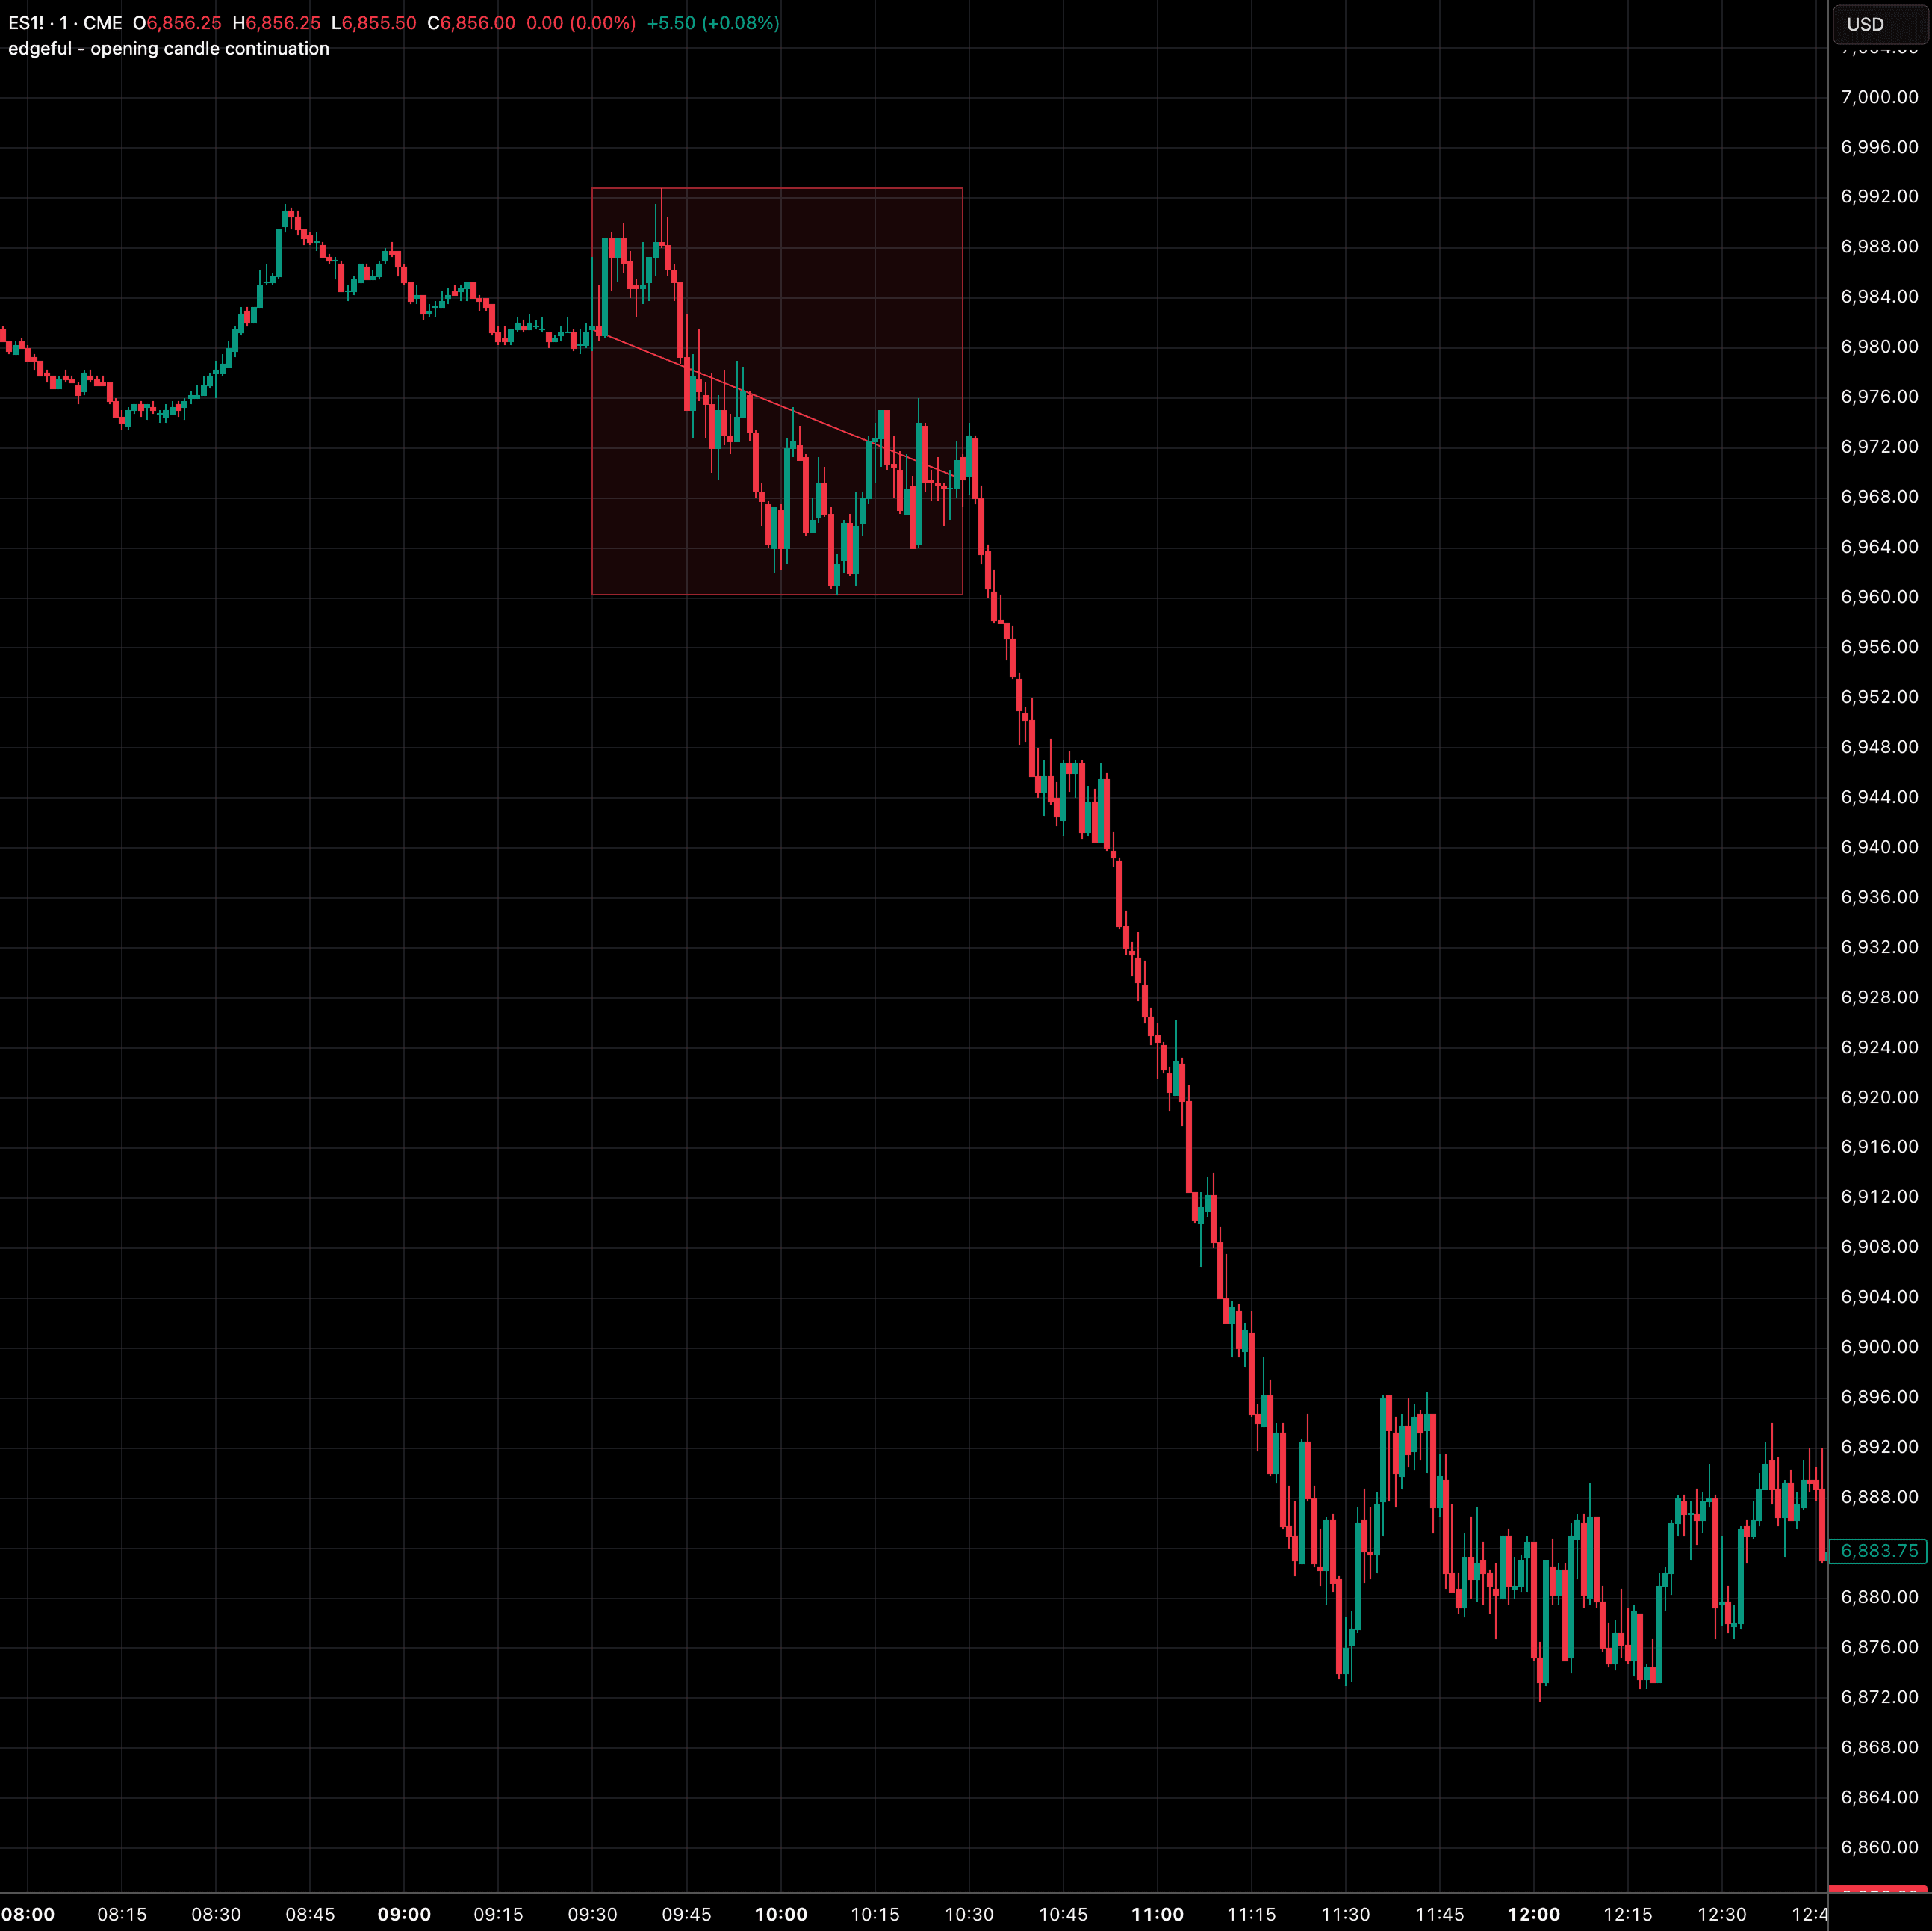
this indicator tracks the opening session (default first hour) and draws a line from the session open price to the close price, color-coded green for bullish (close > open) or red for bearish (close < open). a box shows the full session high/low range.
the opening candle direction often sets the tone for the trading day. this indicator provides clear visual representation of that direction, helping traders identify potential continuation or reversal setups.
key features
line connecting session open to close price
dynamic coloring based on bullish/bearish direction
box showing full high/low range of opening session
real-time updates during session formation
historical lookback for pattern analysis
explainer chart
opening candle continuation|edgeful.com