previous week's range

auto-plots last week's high and low with a shaded zone between them for weekly support and resistance context.

futures
forex
crypto
stocks

information

previous week's range|edgeful.com

what it does

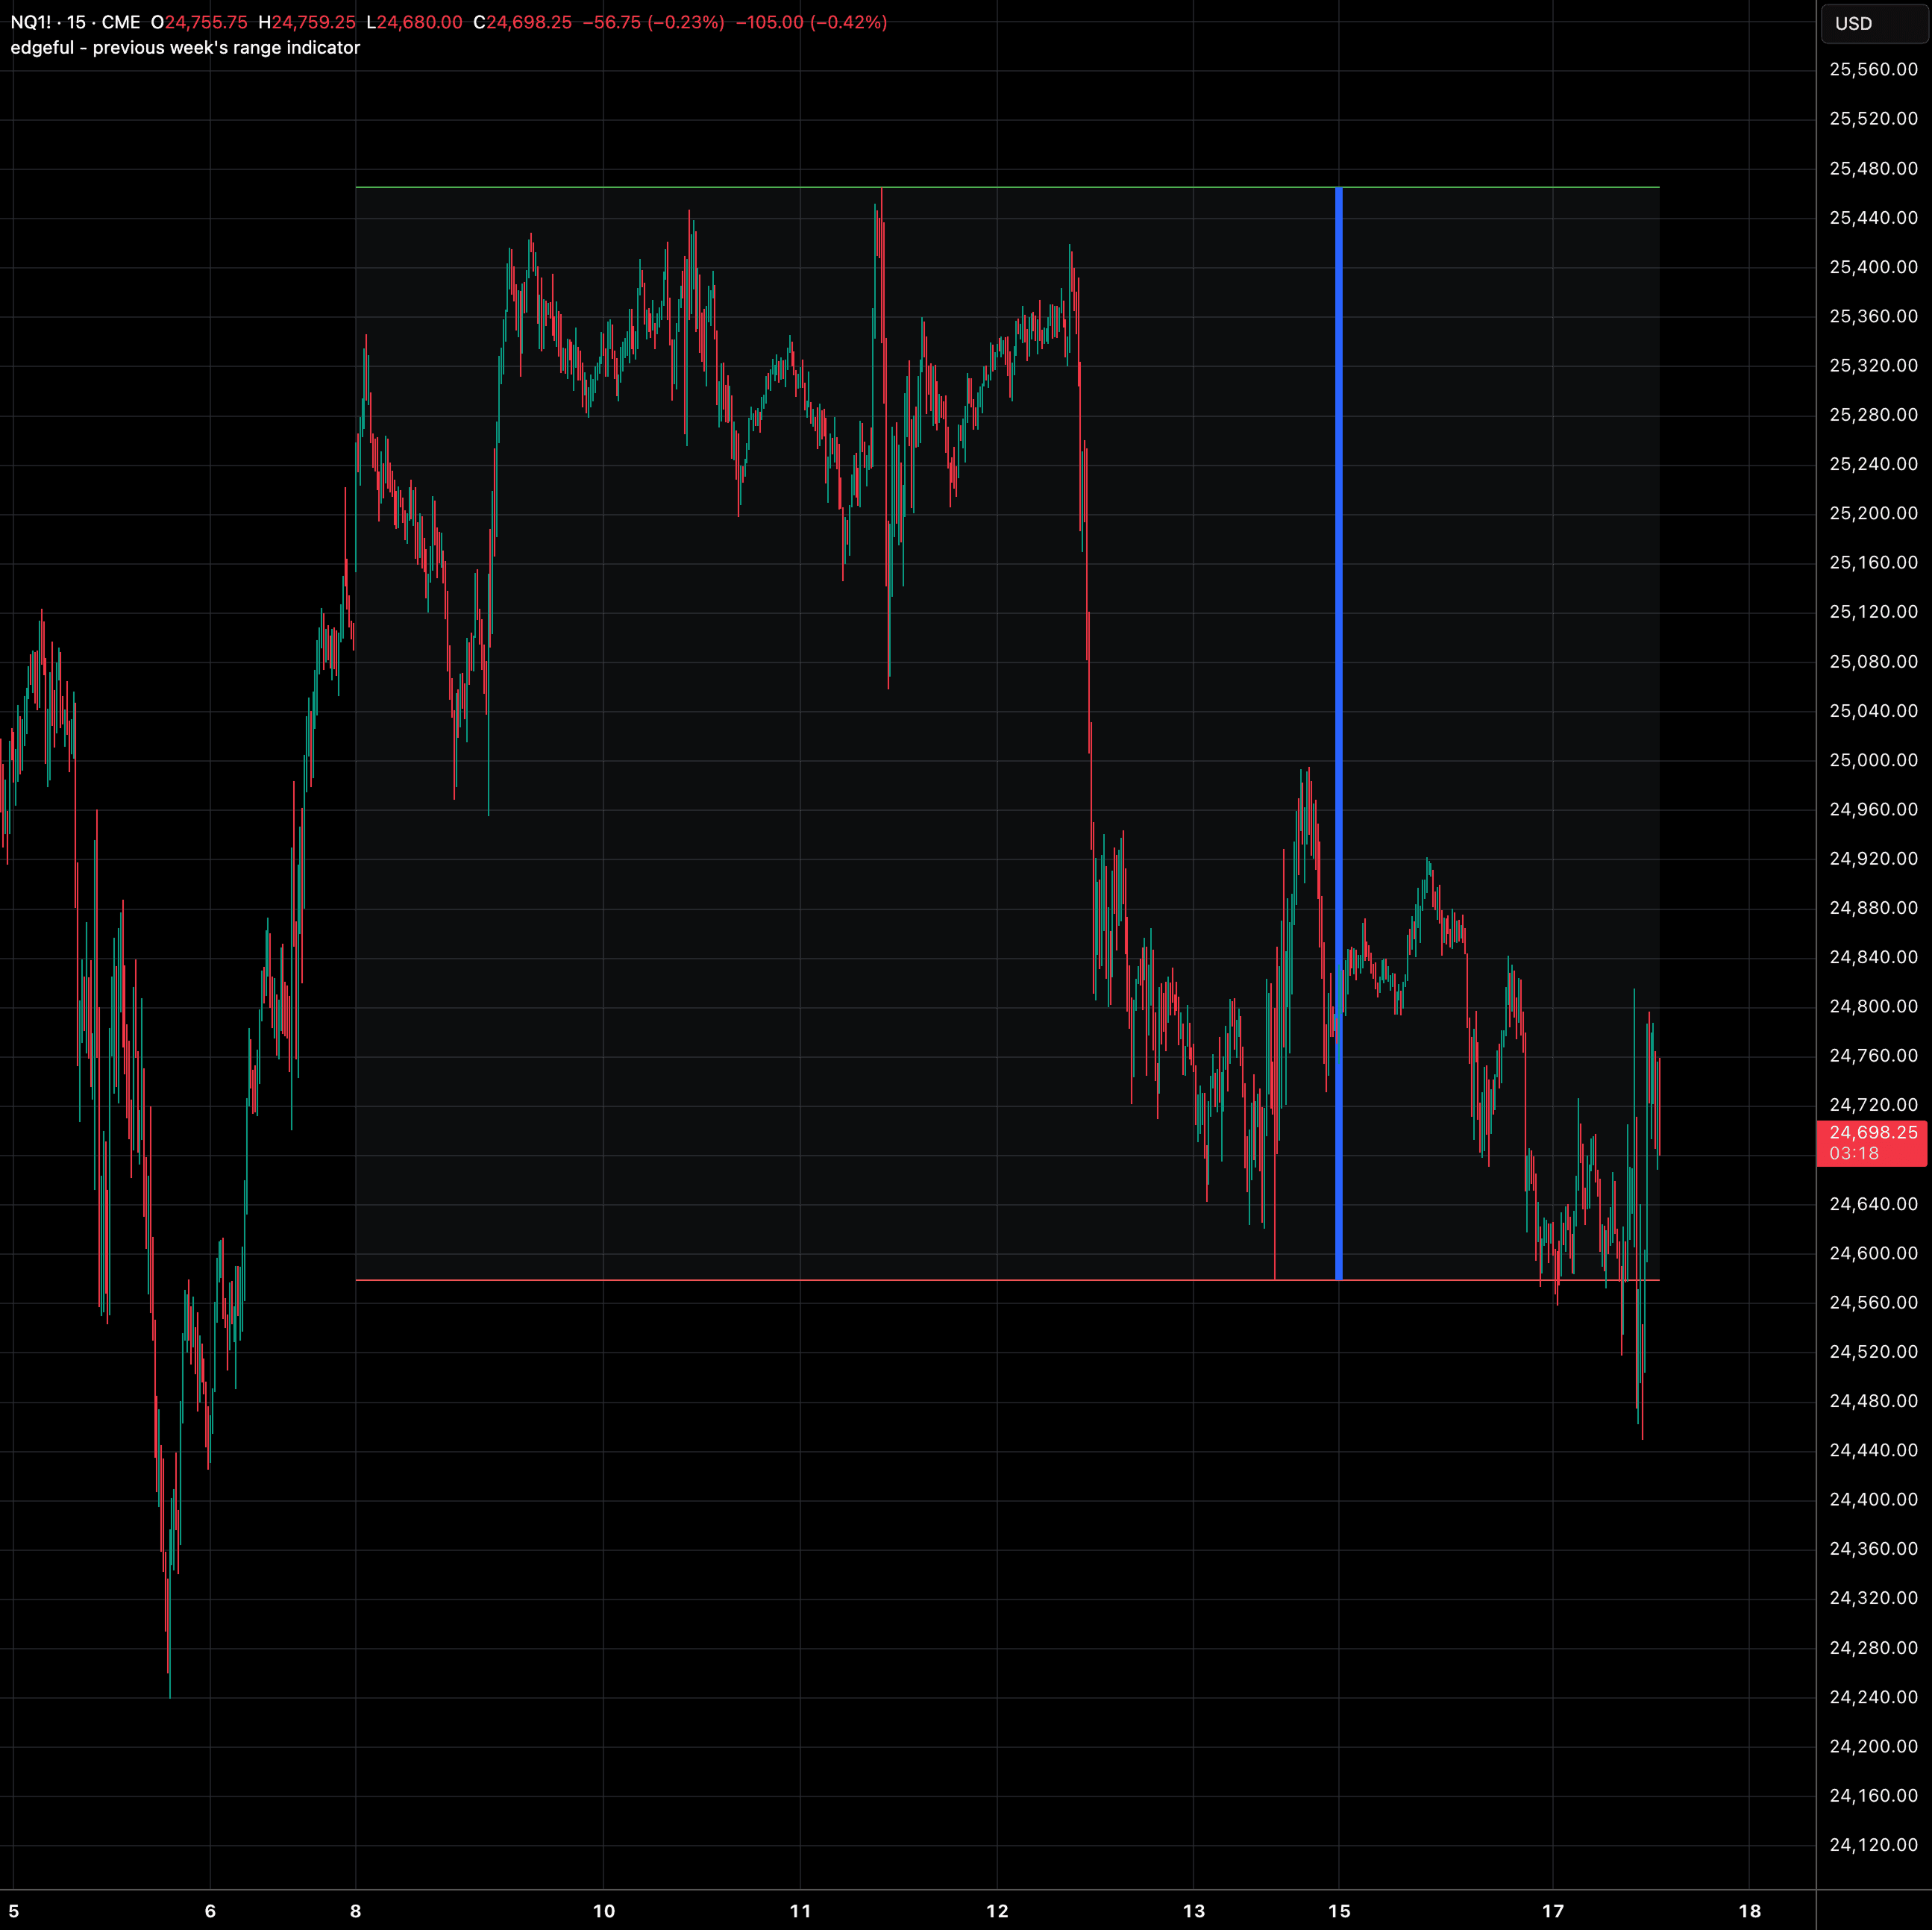
this indicator plots horizontal lines at the previous week's high (green) and low (red), creating a visual zone representing last week's trading range. a vertical blue line marks the weekly open for reference.

previous week's high and low are significant levels for swing traders, often acting as support and resistance. the filled zone helps visualize the range context at a glance.

key features

previous week high and low lines

shaded fill between high and low

weekly open vertical marker

clean, minimal interface

uses weekly timeframe data

explainer chart

previous week's range|edgeful.com

previous week's range

all of this for $49

less than the cost of one bad trade.

★★★★★ 4.5/5 TrustPilot

real data, every Saturday.
free forever.

follow us on social media

copyright © 2026 edgeful. all rights reserved.

risk disclosure: futures and forex trading contains substantial risk and is not for every investor. an investor could potentially lose all or more than the initial investment. risk capital is money that can be lost without jeopardizing ones' financial security or life style. only risk capital should be used for trading and only those with sufficient risk capital should consider trading. past performance is not necessarily indicative of future results. testimonials appearing on this website may not be representative of other clients or customers and is not a guarantee of future performance or success.