opening stats
auto-plots daily range zones with extension boxes projecting potential price targets above and below the day's range.
information
opening stats|edgeful.com
what it does
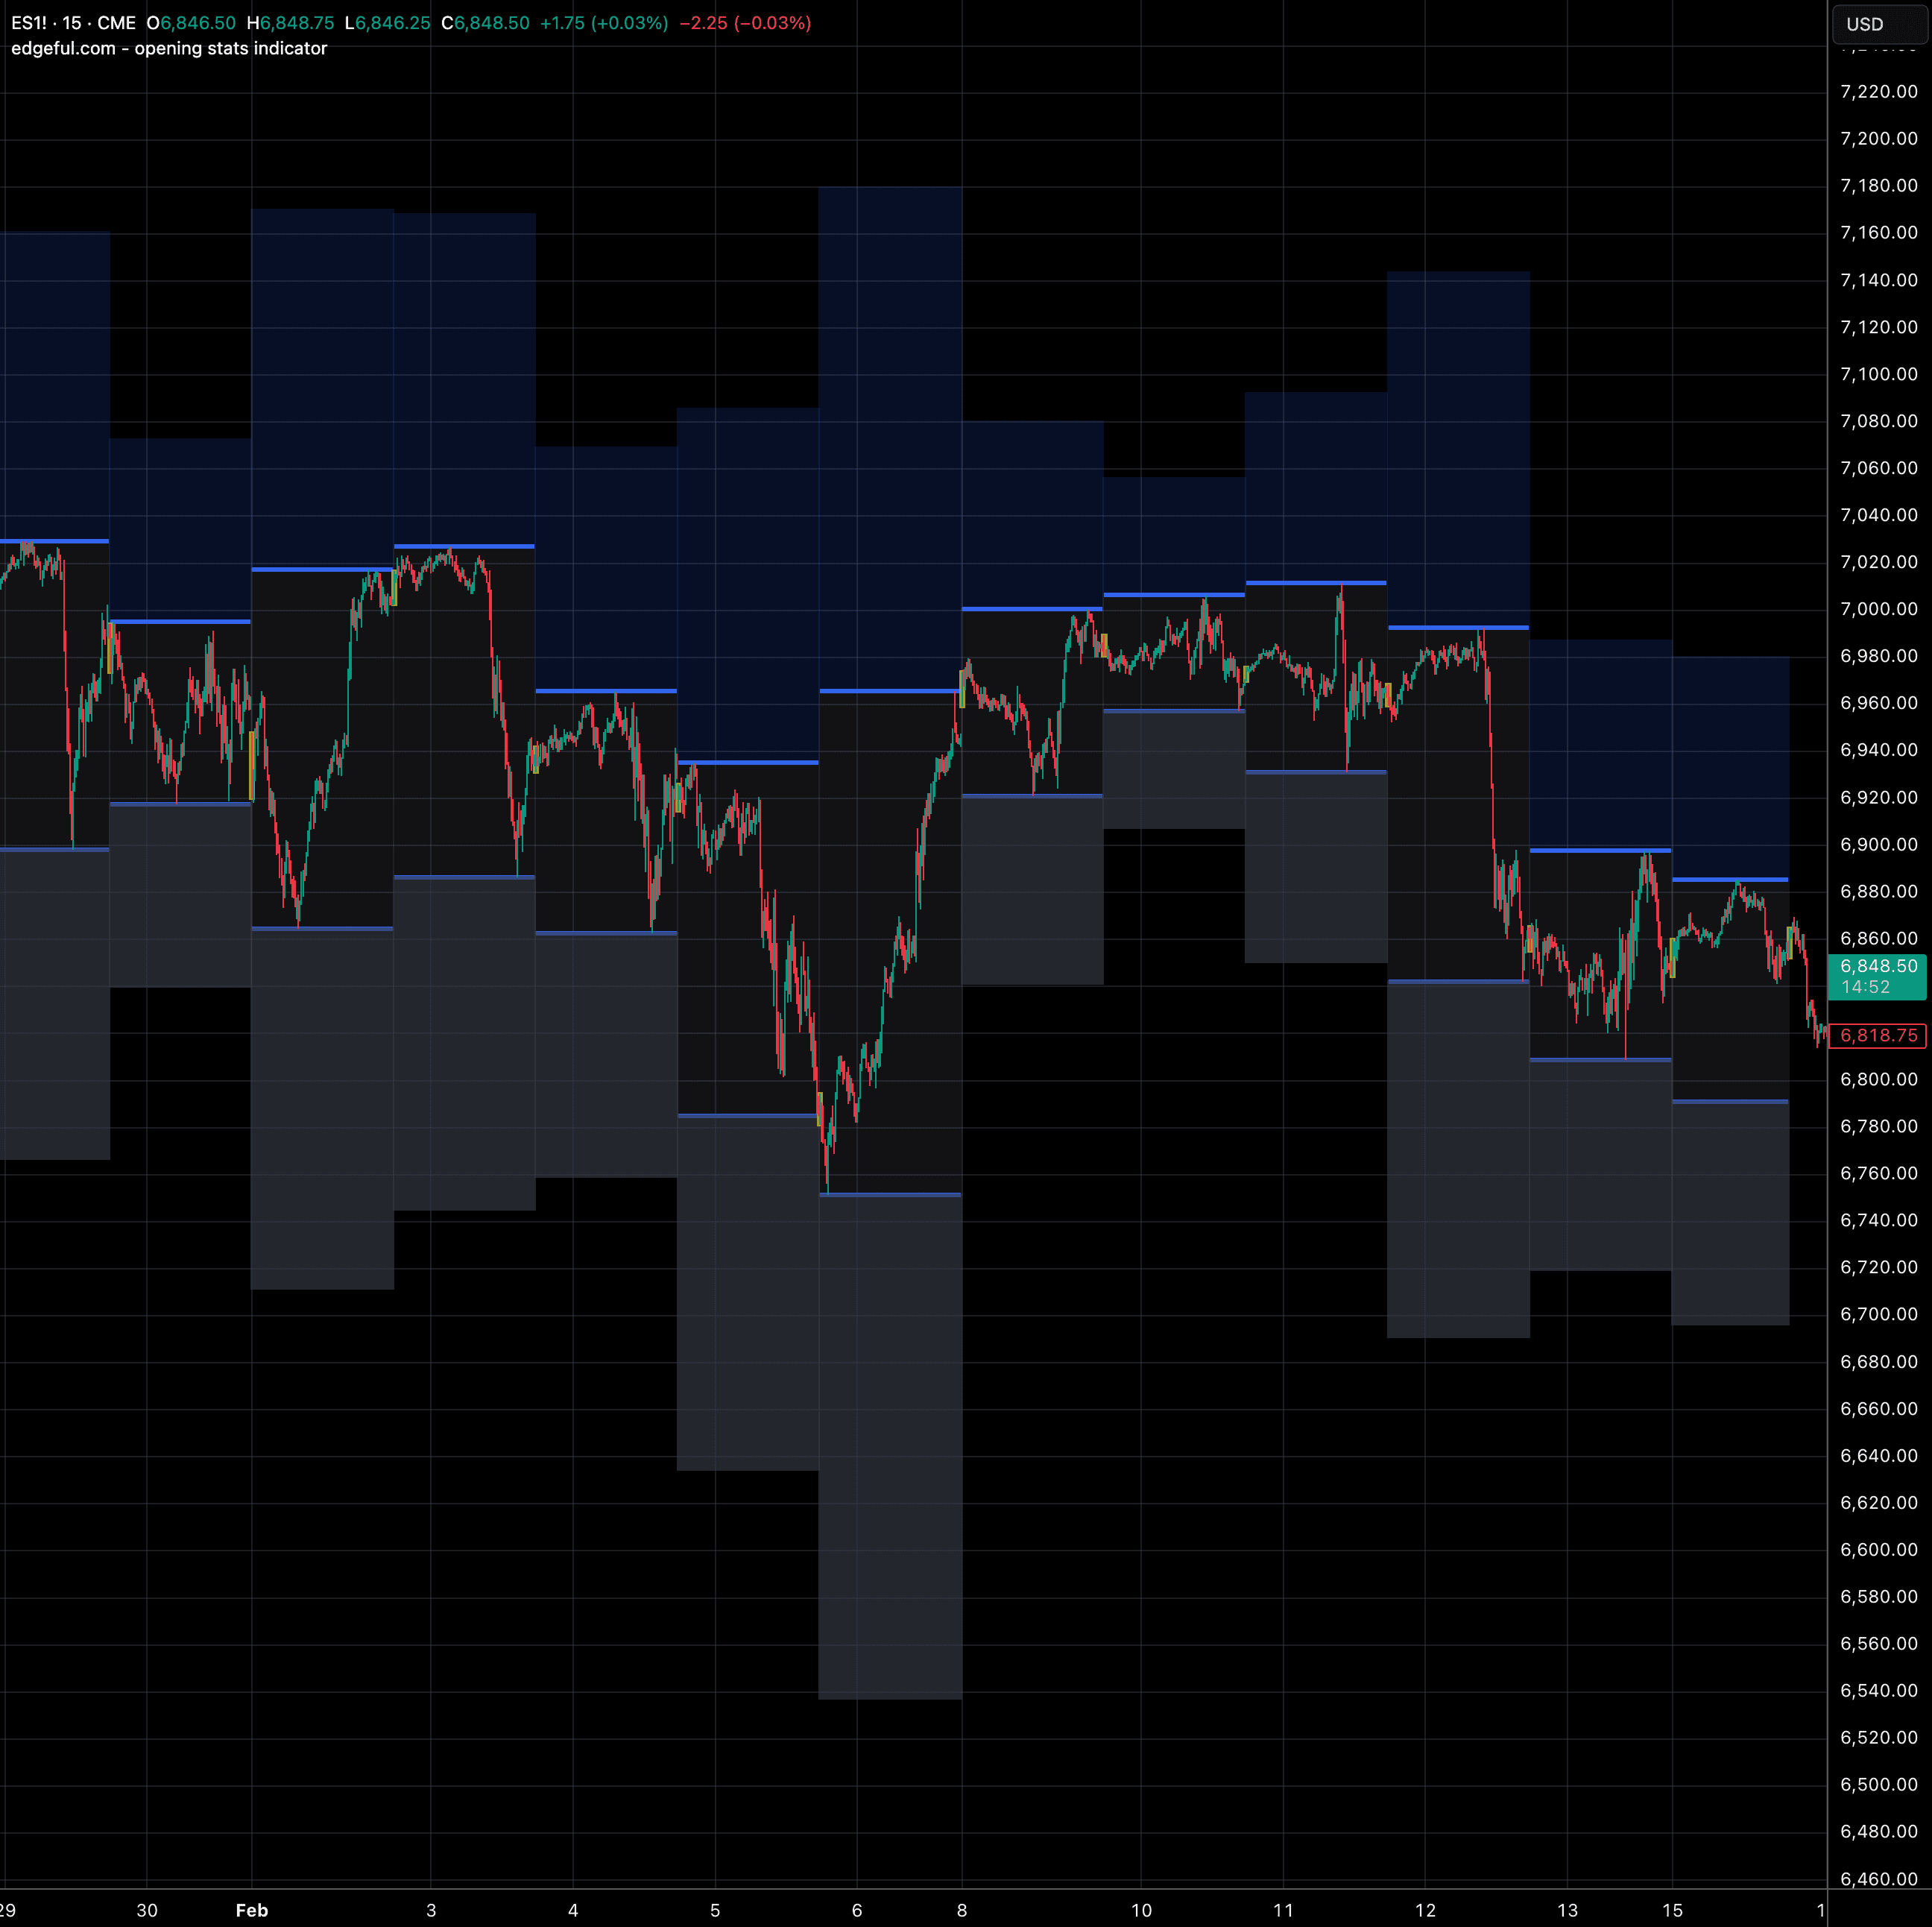
this indicator creates an 'opening box' showing the current day's high/low range, plus two extension boxes: one above (high box) projecting one day's range higher, and one below (low box) projecting one day's range lower. the opening candle of each day is also highlighted.
the extension boxes visualize potential price targets based on the average daily range. this helps traders set realistic expectations for how far price might travel and identify potential exhaustion zones.
key features
daily high/low opening box visualization
extension boxes projecting one range above and below
opening candle highlighting
session-based first/last bar detection
historical lookback configuration
explainer chart
opening stats|edgeful.com