previous day's range
auto-plots the prior day's high, low, and midpoint as intraday support and resistance levels for any asset class.
futures
forex
crypto
stocks
information
previous day's range|edgeful.com
what it does
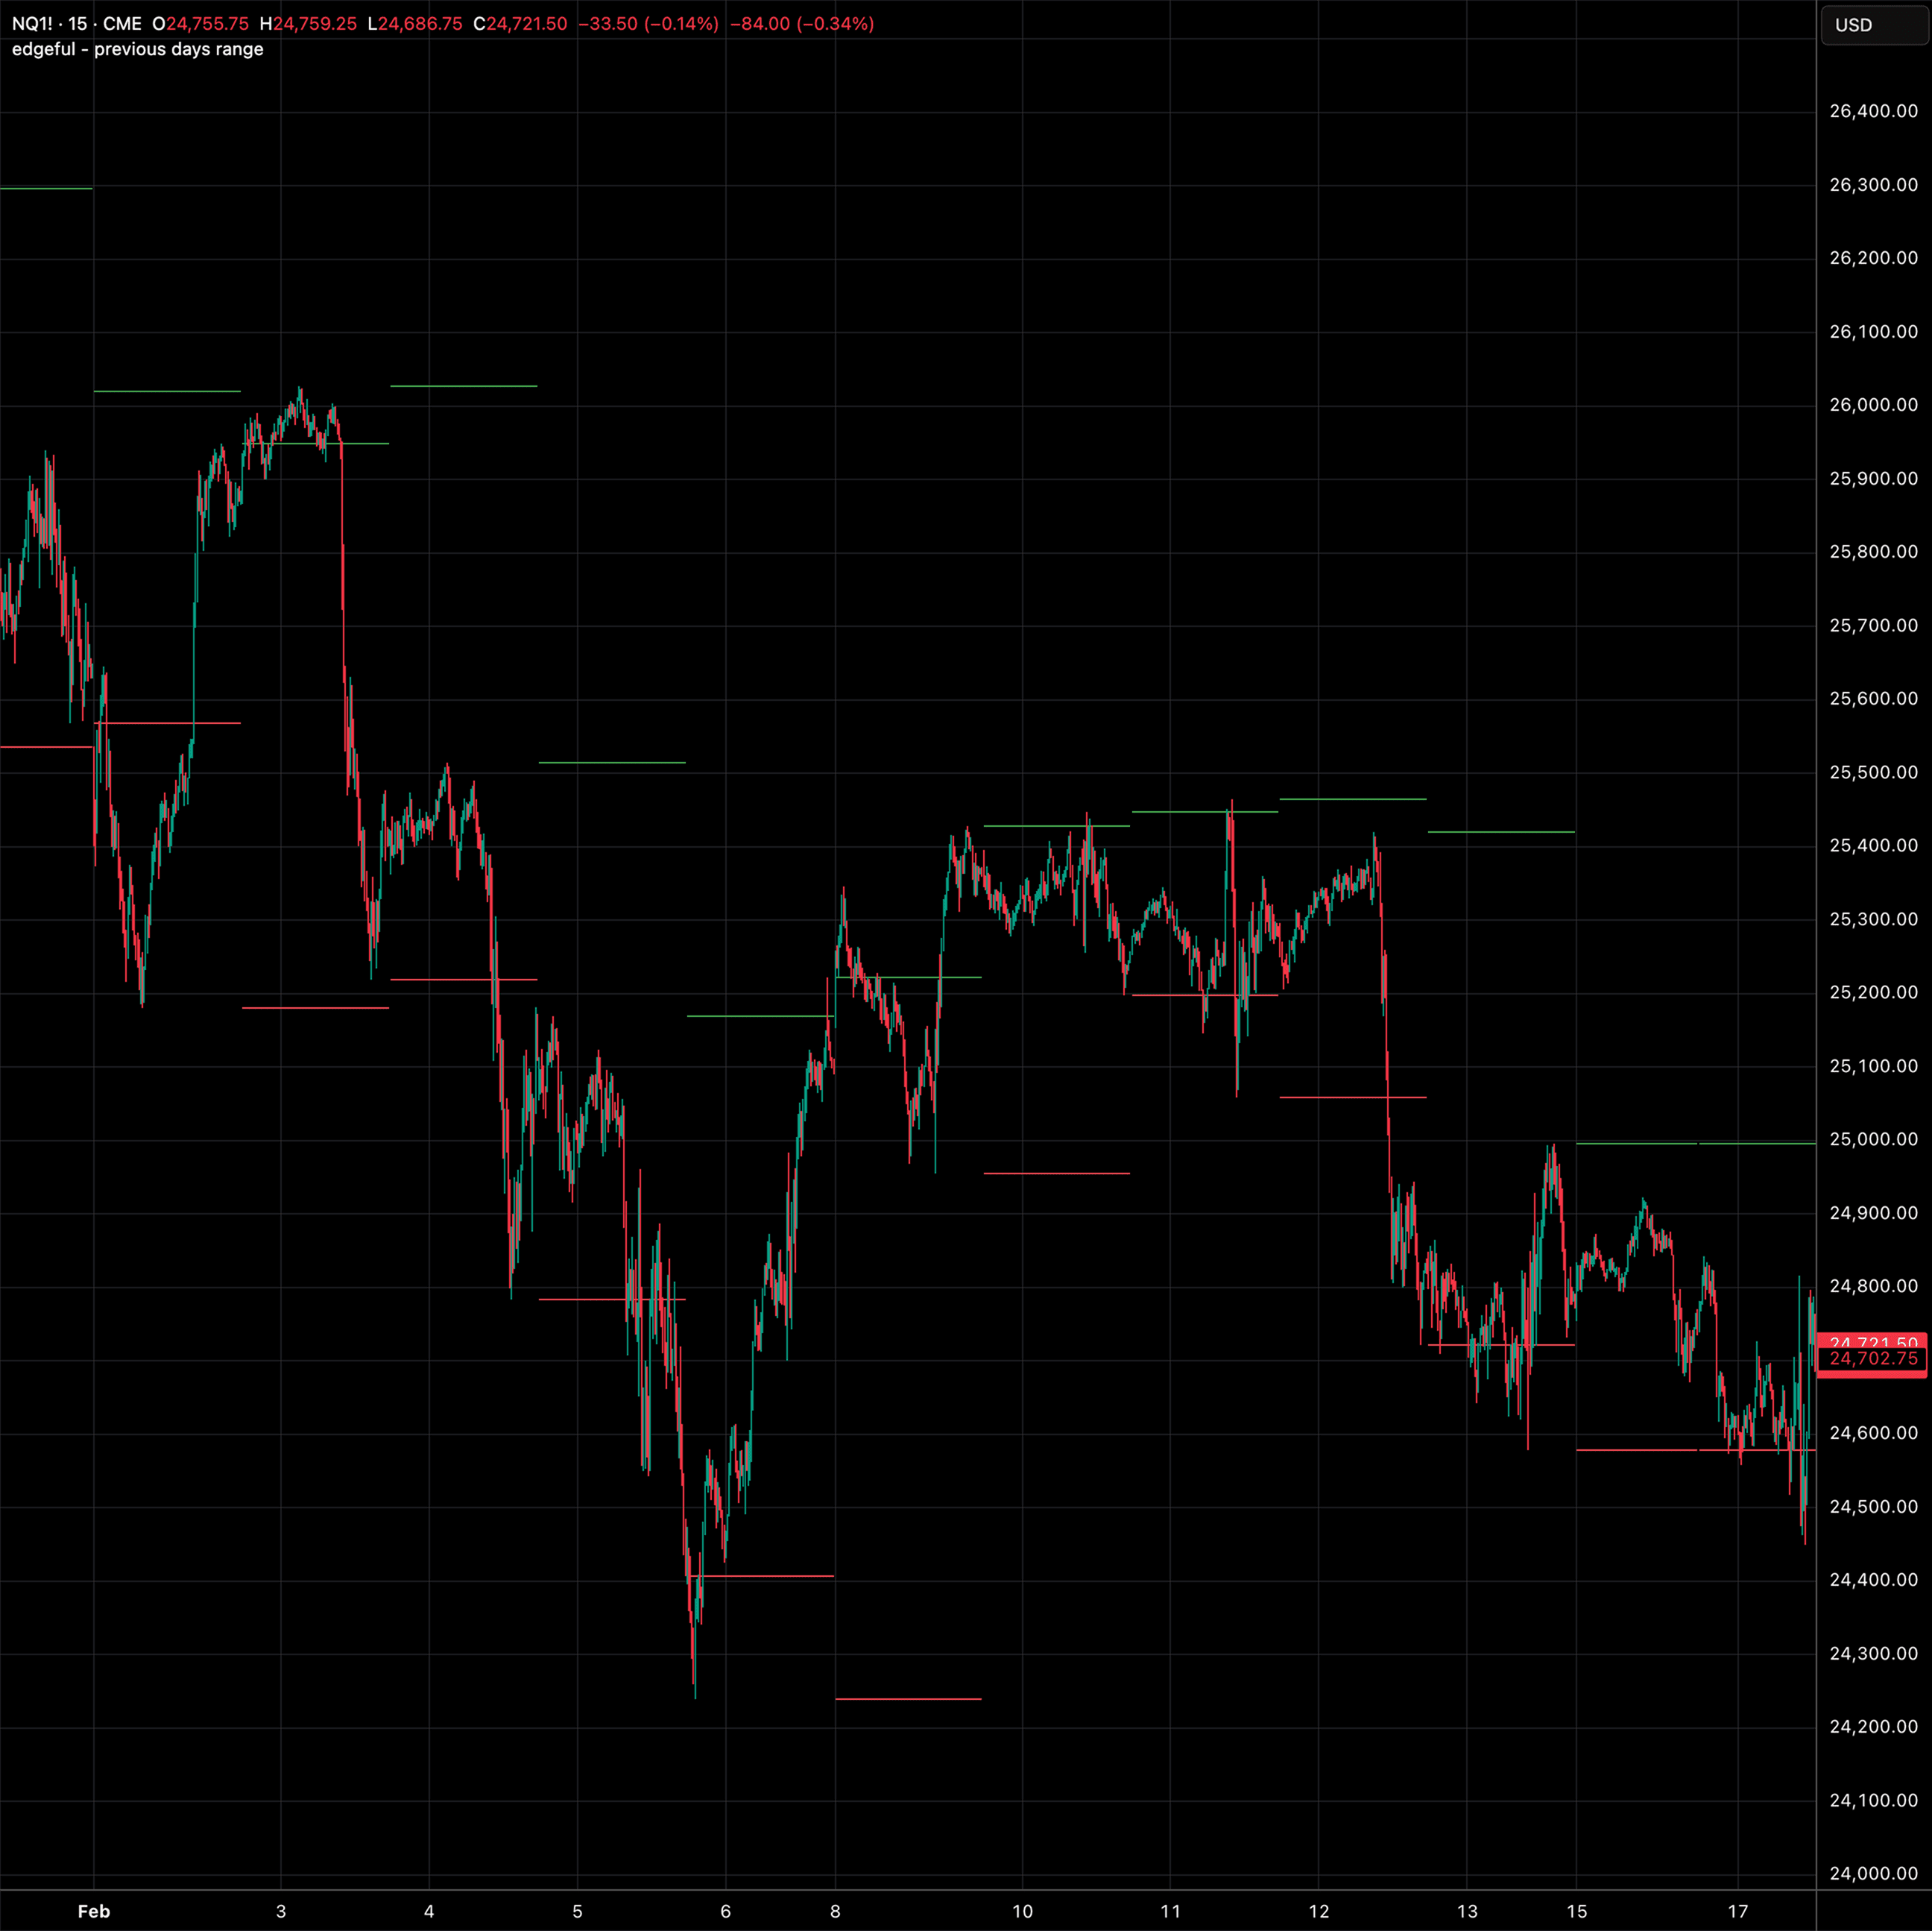
this indicator draws horizontal lines at the previous day's high (green), low (red), and optionally the midpoint (blue). lines are created at the start of each regular market session and extend throughout the trading day.
these levels represent significant support and resistance from the prior session. price often reacts at these levels, making them valuable for entry, exit, and stop placement decisions.
key features
previous day high line (green)
previous day low line (red)
optional middle range line (blue)
price target labels at each level
non-repainting using lookahead
explainer chart
previous day's range|edgeful.com