performance trends
auto-plots weekly performance boxes with dollar and percentage change labels to spot momentum trends at a glance.
information
performance trends|edgeful.com
what it does
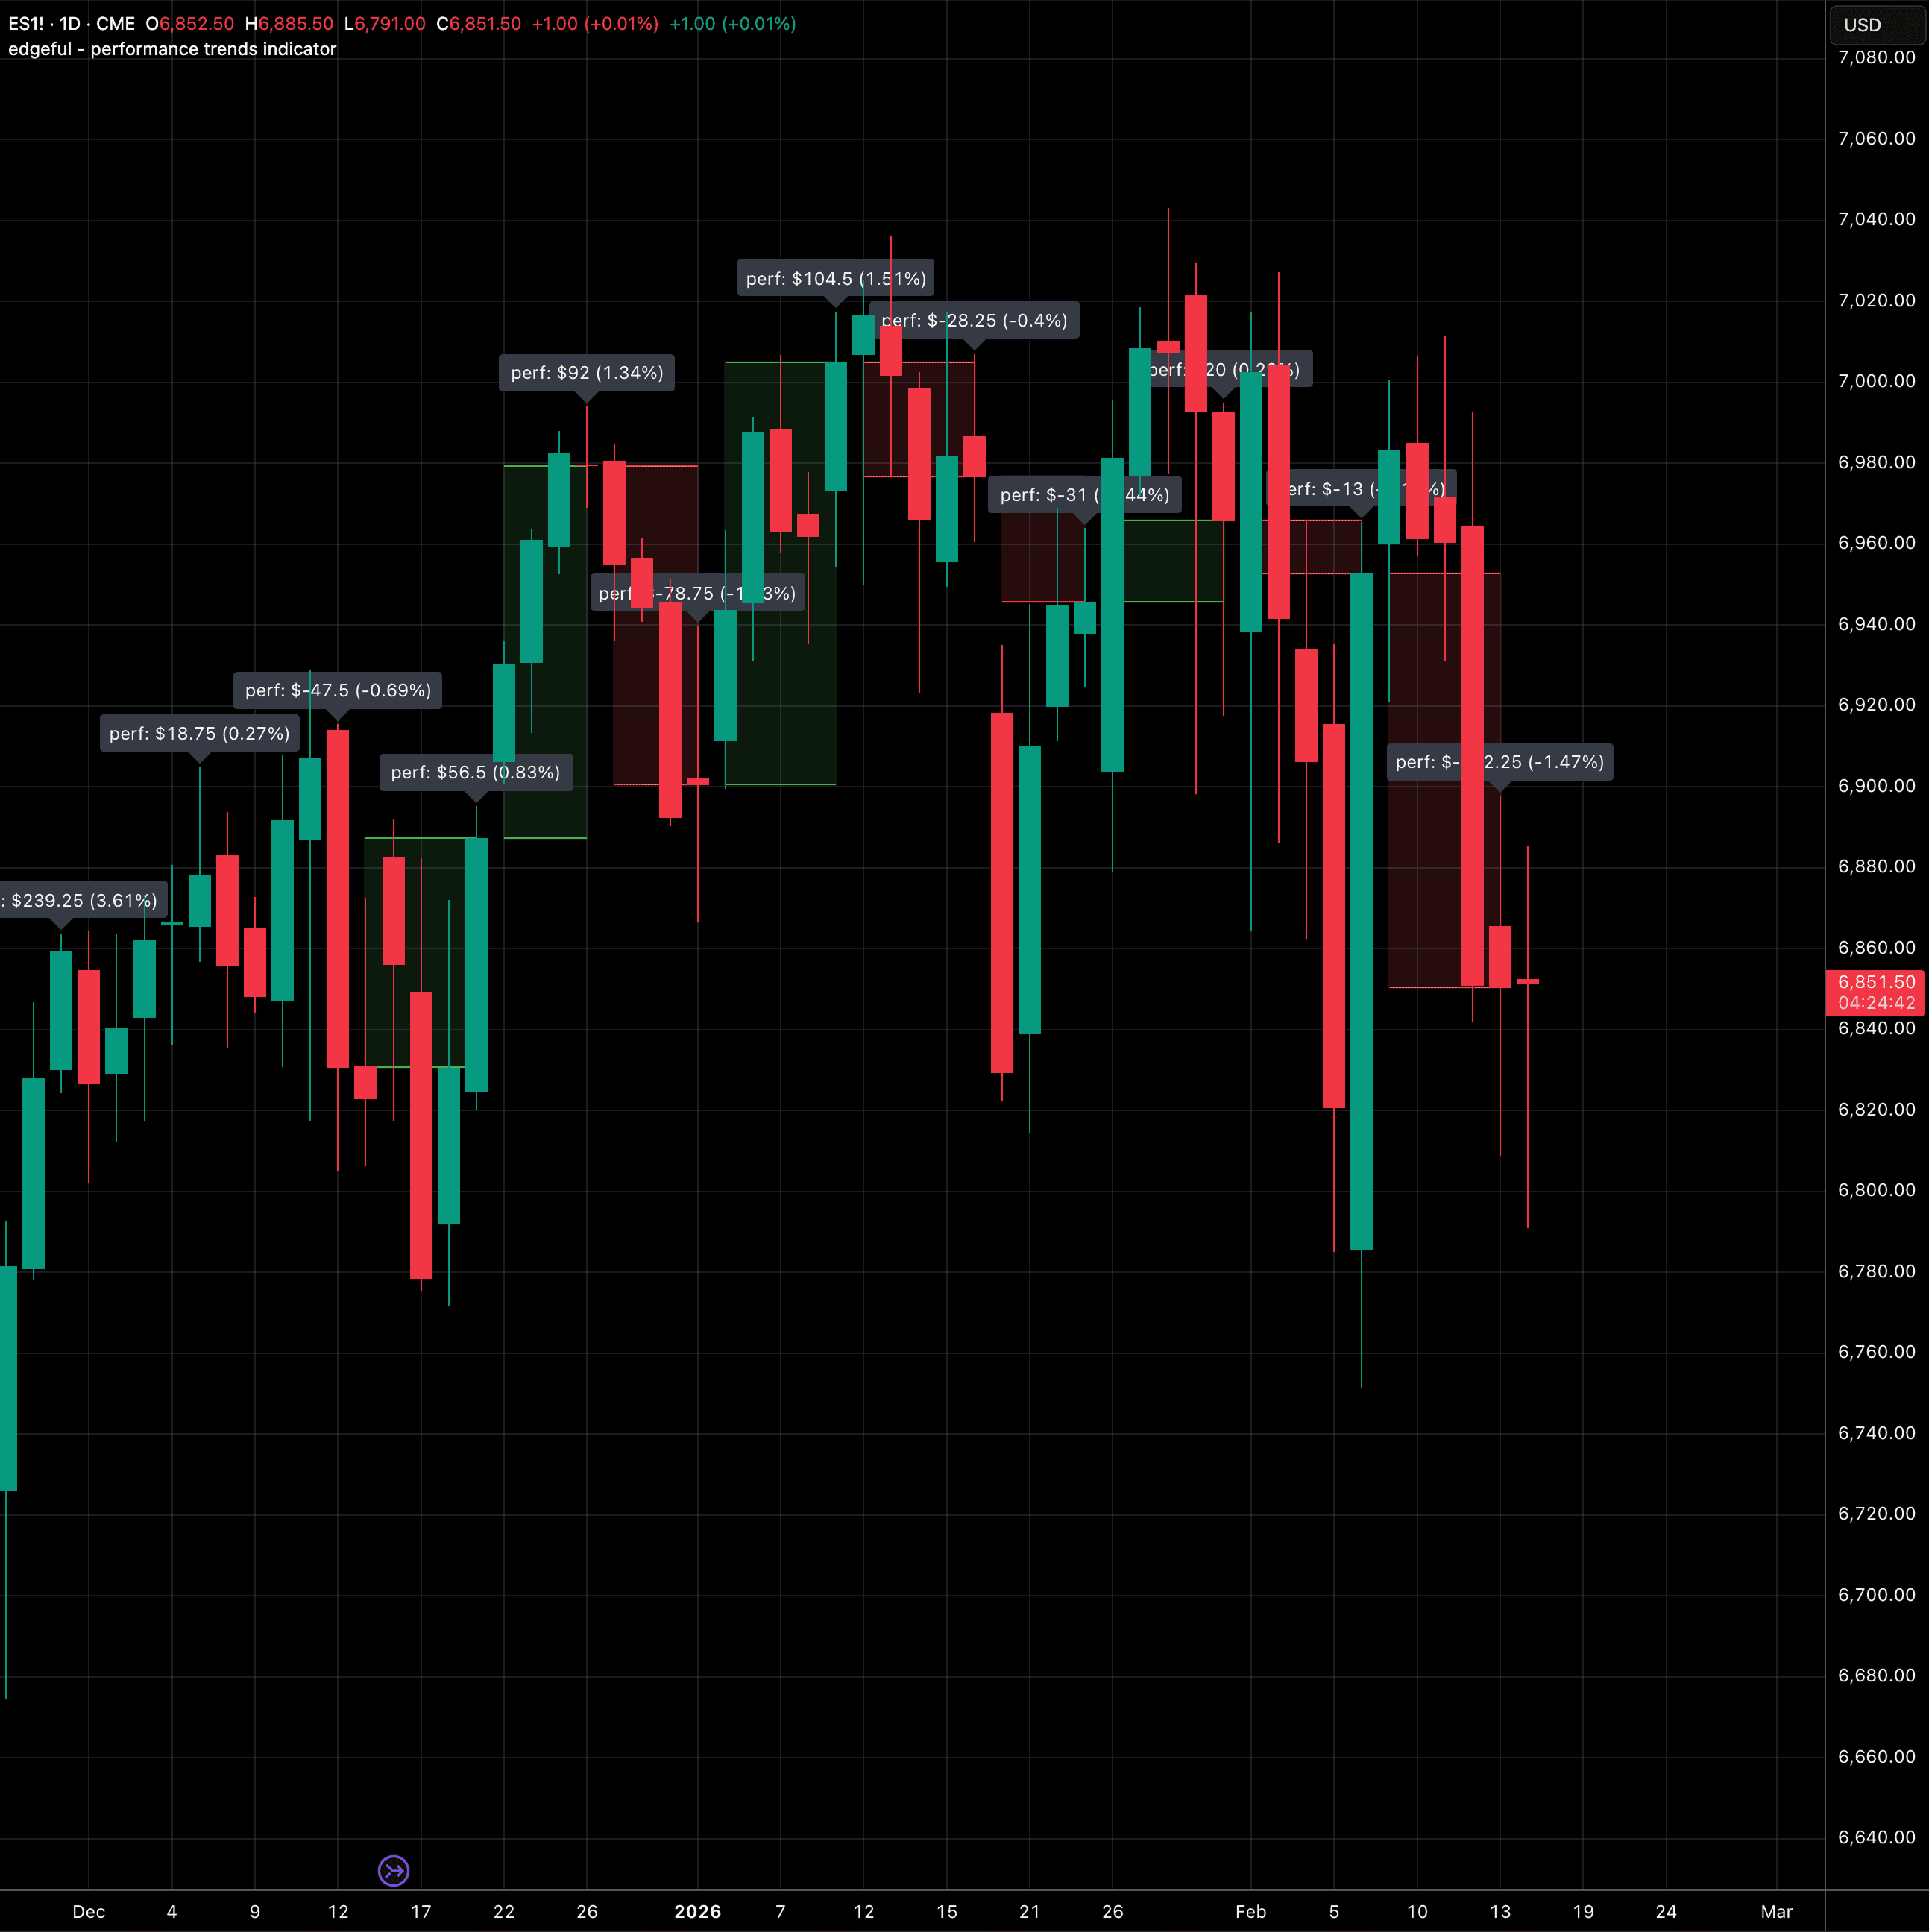
this indicator visualizes weekly performance with colored boxes representing each week's high-to-low range. green boxes indicate weeks that closed above the previous week's close; red boxes indicate weeks that closed below.
labels display the dollar change and percentage change for each week. lines within each box track the highest and lowest daily closes, helping identify which days set the extremes.
key features
weekly performance boxes (green for up, red for down)
dollar and percentage change labels
high/low close lines within each week
session-based detection for accurate end-of-week
configurable historical lookback
explainer chart
performance trends|edgeful.com