indicators
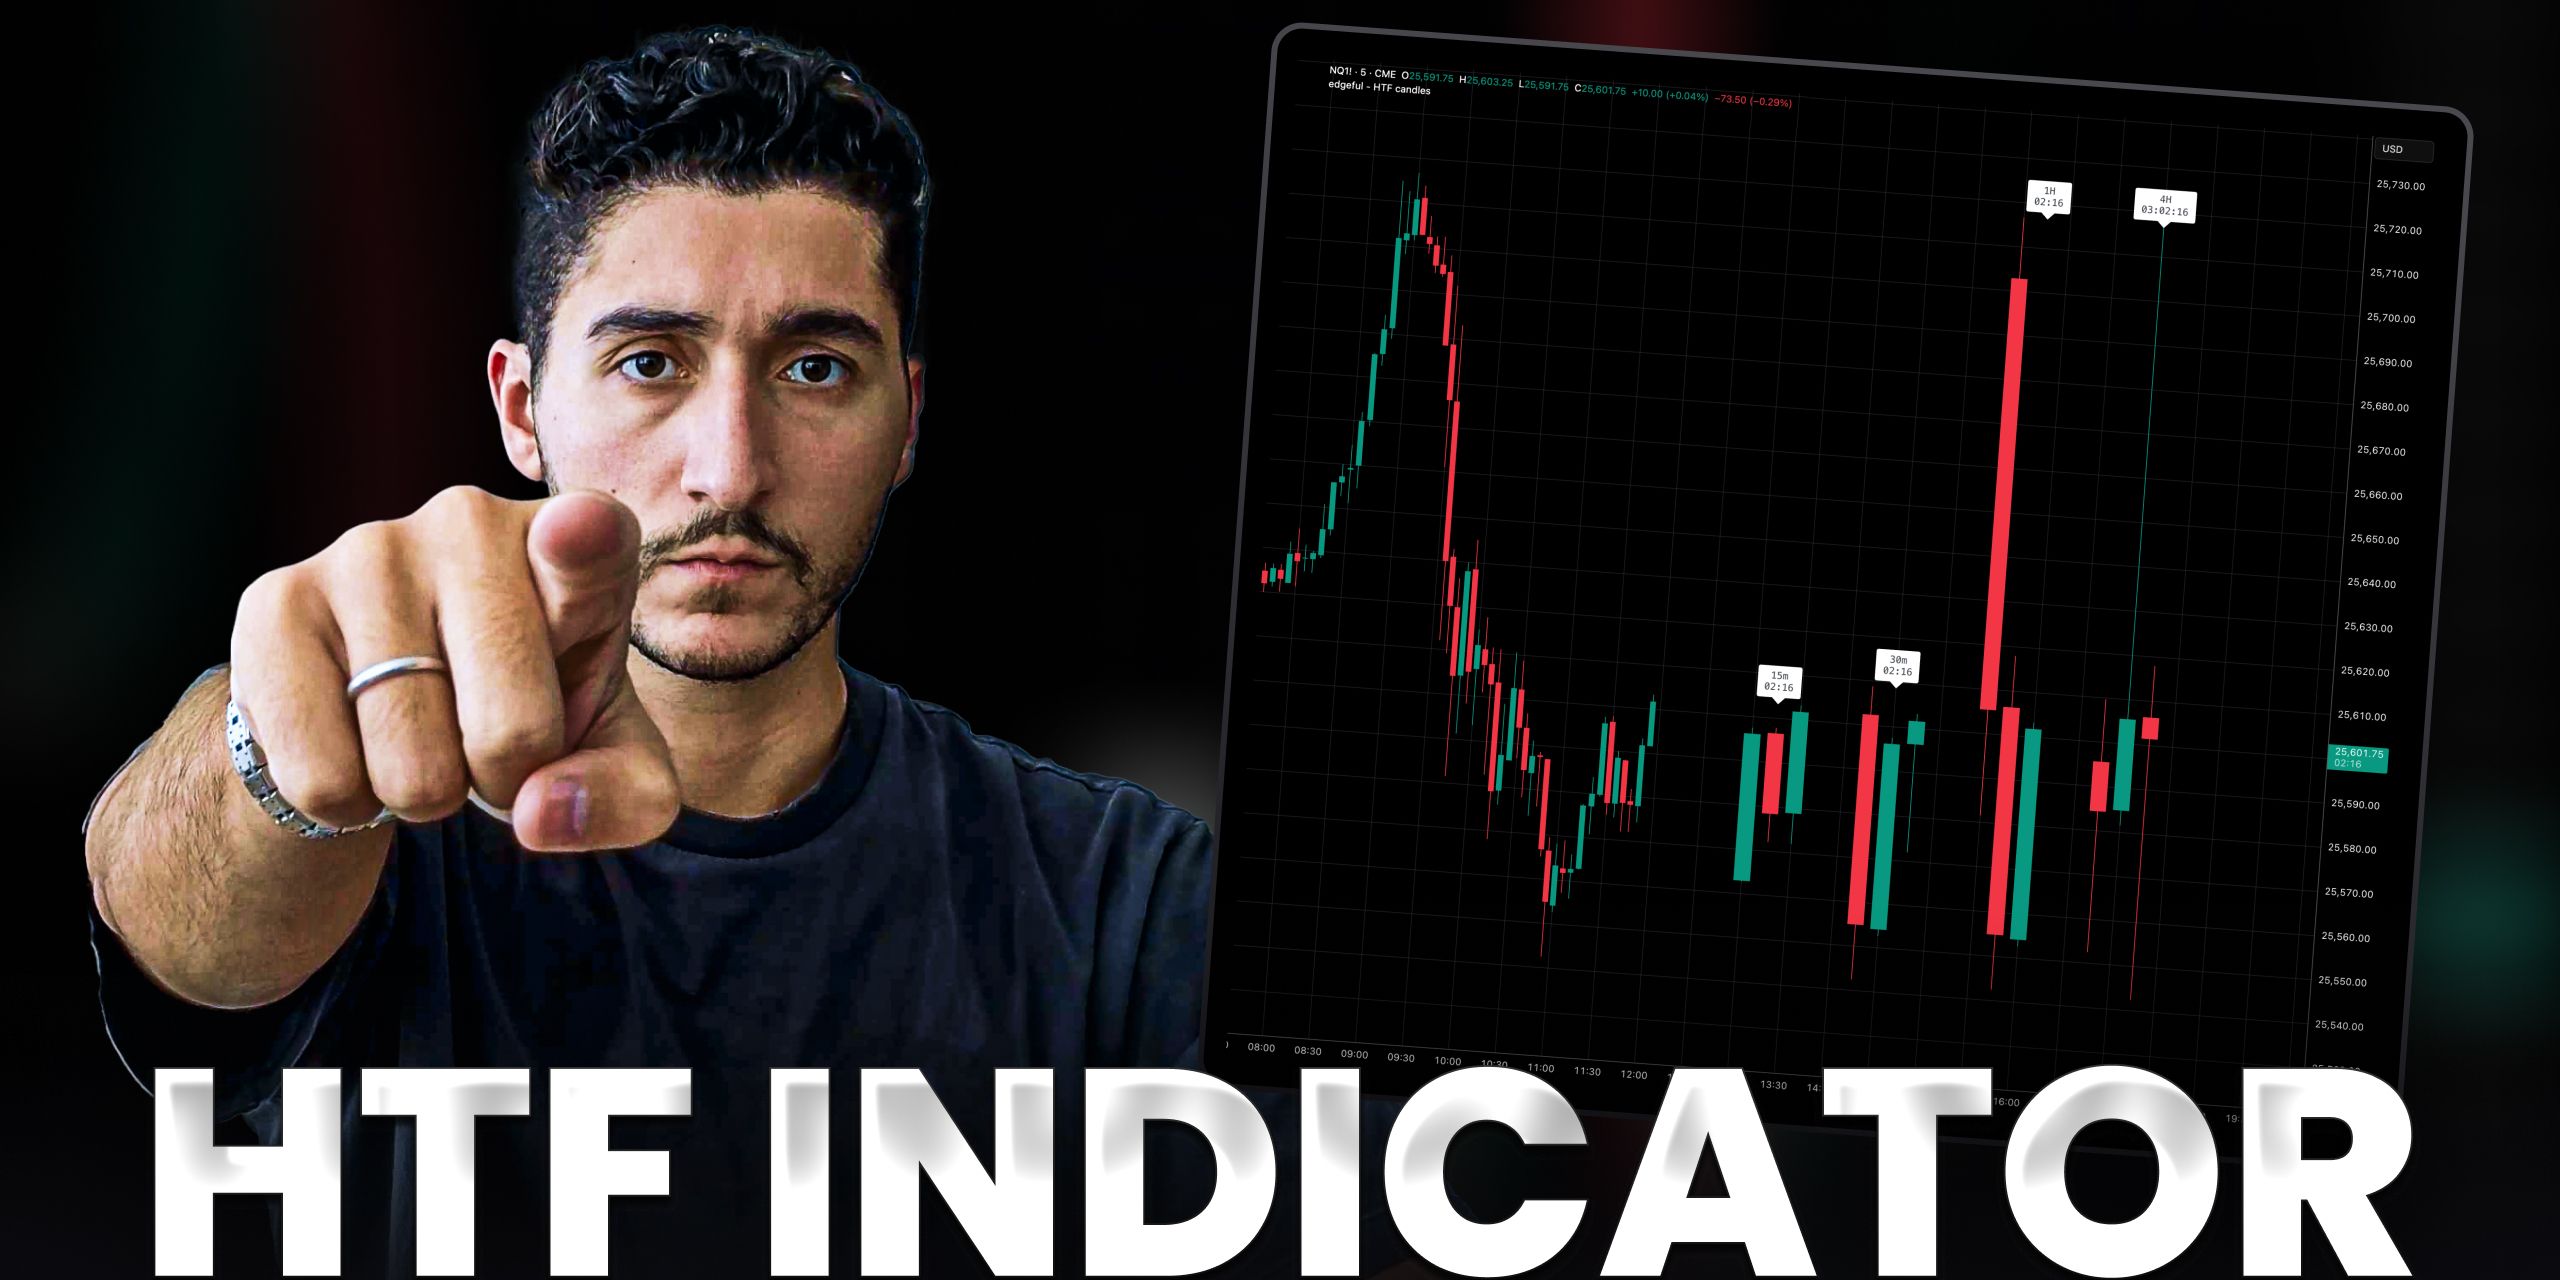
higher timeframe analysis: how to see key levels without switching charts
learn higher timeframe analysis to identify key support and resistance levels plus a walkthrough of edgeful's new HTF candles TradingView indicator.
weekly data-backed trading strategies and step-by-step breakdowns from edgeful. learn how to build consistent systems with actionable reports, setups, and stats.
indicators
learn higher timeframe analysis to identify key support and resistance levels plus a walkthrough of edgeful's new HTF candles TradingView indicator.
indicators
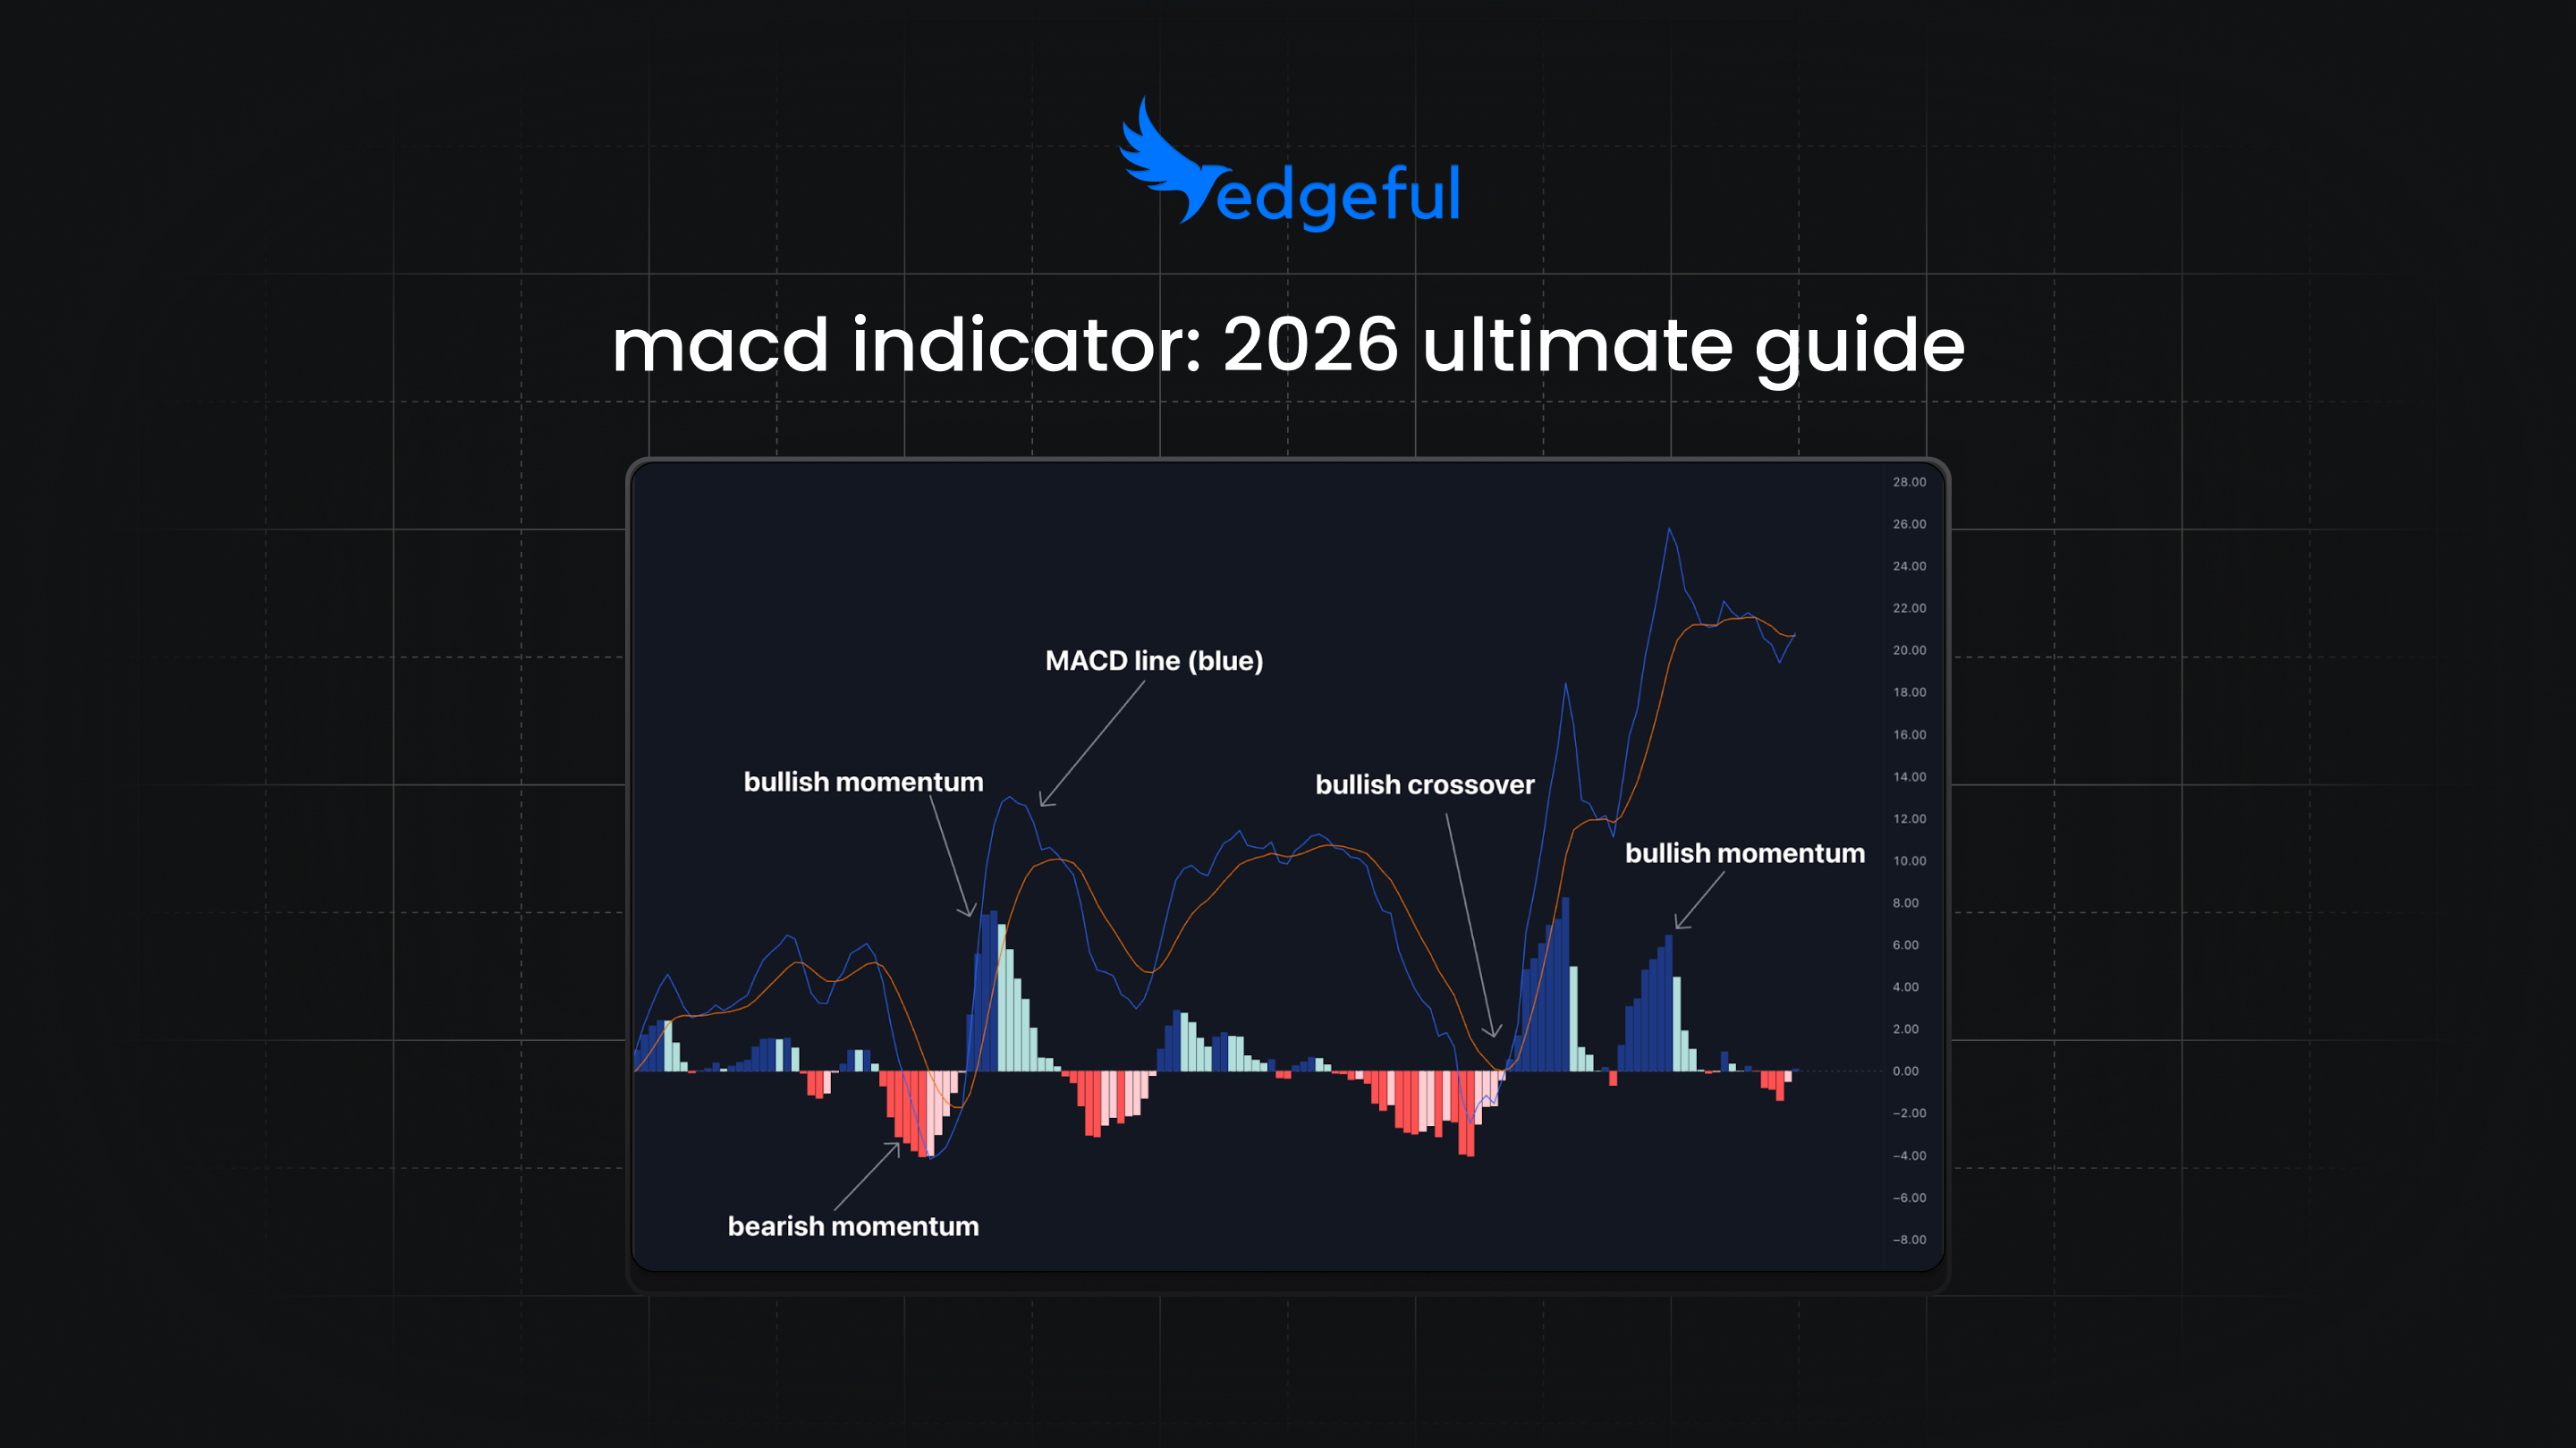
here's everything you need to know about the MACD indicator. calculation methods, inputs, customizations, and visual examples to help your trading.
indicators
previous week's range indicator automatically plots last week's high and low on TradingView. session-specific for data and levels for futures, forex, crypto, and stocks.
indicators
how the engulfing candles indicator automatically spots bullish and bearish engulfing patterns on TradingView. spend more time trading and less time plotting by adding this indicator to your charts.
indicators
how the power hour indicator plots high of day and low of day before the last hour, so you waste less time plotting levels and more time effectively trading.

indicators
how the fibonacci TradingView indicator plots session-based fib levels automatically. no manual drawing—levels update daily based on previous session range.

indicators
how the weekly range indicator plots previous week's high, low, and midpoint on TradingView. use our reports to find how often — and to which side — price breaks last week's range.

indicators
how the ATR zones indicator plots developing daily high, low, and ATR boundaries on TradingView. report helps you determine what % of daily ATR range you should be targeting.
indicators
how the ultimate reversal setup indicator plots outside day, gap fill, and ICT midnight open levels automatically. when all three align—70%+ reversal probability depending on your ticker and timeframe.
indicators
how the pivot points indicator plots support and resistance levels on TradingView and shows touch probabilities based on where price opens each session.
indicators
how the FVG indicator plots fair value gaps on TradingView and tracks mitigation rates. YM shows 69% of bullish FVGs stay unmitigated on 30min charts.
indicators
how the ICT opening retracement indicator plots midnight open and measures retracements within trading sessions. YM retraces 63-67% of the time—here's how to use it.
indicators
why breaks of previous day's high and low signal continuation, not reversals. YM shows 81% green when PDH breaks and 63% red when PDL breaks—here's the indicator.
indicators
the opening candle continuation indicator tradingview plots first hour high/low with color-coded boxes. use edgeful's data to turn this indicator into an actionable trading strategy.

indicators
the gap fill indicator automatically plots previous session close and gap targets on TradingView. customize fill percentages for stocks and futures, and master how to use our indicator to trade more efficiently.

indicators
the trading sessions indicator plots New York, London, and Asian session boxes on TradingView. match your chart with edgeful reports for Forex and futures.

indicators
the ORB indicator automatically plots opening range breakout levels on TradingView. save time and trade the first 15 minutes with data-backed stats.

indicators
edgeful's initial balance indicator automatically plots IB high, low, and midpoint levels on TradingView. save time and trade the first hour range with data-backed stats and strategies.
indicators
discover the top 5 tradingview indicators for futures trading with 70%+ win rates. exclusive data-backed tools that eliminate manual plotting forever.