higher timeframe analysis: how to see key levels without switching charts
happy new year and welcome back to another edition of stay sharp.
this week, I want to talk about something that's been a game changer for me personally... and I think it'll be for you too.
we're diving into higher timeframe analysis — specifically, how to use higher timeframes to identify key support and resistance levels, spot major trends, and most importantly... our new indicator that allows you to do all of this without constantly switching between charts and missing your entries.
let's get into it.
table of contents
- why higher timeframe analysis matters
- understanding the different timeframes
- a real example of higher timeframe analysis in action
- the problem with traditional higher timeframe analysis
- introducing the HTF candles indicator
- practical use cases for higher timeframe analysis
- how to set up the higher timeframe analysis indicator
- frequently asked questions
why higher timeframe analysis matters
let me quickly break down what I mean by "higher timeframe analysis" and why it's so important for your trading.
timeframes in trading range from very short (1-minute, 5-minute) all the way up to longer views (30-minute, 1-hour, 4-hour, daily, weekly). the shorter the timeframe, the more noise you see. the longer the timeframe, the more significant the levels and trends become.
when you trade, you want to be aligned with what the higher timeframes are telling you. if the 4-hour chart is in a clear downtrend and you're trying to go long on the 5-minute... you're fighting the intermediate trend — which won't make you money over time.
what will make you money over time is mastering higher timeframe analysis: understanding which timeframes to analyze, how to identify the key support and resistance levels on those higher timeframes, and then trading with what the data is telling you to do.
the market doesn't care about your 5-minute setup if there's a wall of institutional supply sitting right above you. and without proper higher timeframe analysis, you'd never know it was there.
understanding the different timeframes
before we go deeper into higher timeframe analysis, here's a quick breakdown of the timeframes you should be aware of:
- 1-minute / 5-minute: execution timeframes — where you can enter and exit trades. these are the timeframes most day traders watch for entries, but they contain the most noise and the least significant levels.
- 15-minute / 30-minute: short-term structure — helps you see intraday trends and momentum. these timeframes start to filter out some of the noise from the lower timeframes while still being relevant for day trading.
- 1-hour / 4-hour: intermediate structure — key support and resistance levels that institutions watch. this is where higher timeframe analysis becomes critical. the levels on these charts are respected by larger players in the market.
- daily / weekly: big picture — major trend direction and levels that move markets. these timeframes show you the overall bias and the most significant support and resistance zones.
understanding this hierarchy is the foundation of effective higher timeframe analysis. each timeframe serves a purpose, and the best traders know how to read all of them together.
a real example of higher timeframe analysis in action
here's a perfect example of why higher timeframe analysis matters — lower timeframe vs higher timeframe structure:
this is the current market setup coming into Friday, January 2nd.
on the left, we have our traditional intraday chart — the 15min view. on the right — highlighted in green — we have the higher timeframe plotted as well, using the 4 hour chart.
the 15 minute chart is showing a nice rally off of the lows to start the new year. just based on this price action alone, you may be bullish coming into the session.
but as you can see, there's a clear resistance level at ~$27,775 on a higher timeframe. so if we see continued bullish momentum into the NY open, it's likely we're going to find some sort of resistance at that $27,775 level because of higher timeframe resistance.
again — the market doesn't care about the 5-minute setup if there's a wall of institutional supply sitting right above you. and without checking the higher timeframes, you'd never know it was there.
end of day update on the example above:
shortly after the open, NQ broke above the ORB range (you can see our ORB algo triggered a winning trade on the left side of the chart) and then immediately got sold after touching the higher timeframe resistance level.
not every example is always this clean, but it should be very clear to you now as to why higher timeframe analysis and identifying those levels matter.
this is exactly why incorporating higher timeframe analysis into your daily routine can prevent unnecessary losses and help you take higher probability trades.
the problem with traditional higher timeframe analysis
now, let's say you already understand the importance of higher timeframe analysis. you know you should be checking the 4-hour chart before taking a trade on the 5-minute or 15-minute.
but here's the issue — there's not a good higher timeframe analysis indicator out there that lets you clearly see multiple timeframes at once.
so what do you do? you switch back and forth between timeframes, over and over again.
5-minute chart... 15-minute chart... 30-minute chart... 1-hour... 4-hour... back to the 5-minute.
by the time you've cycled through all of them, you're confused — and you've wasted a ton of time in the process.
for a long time, this is exactly how I traded.
it was exhausting. and I know I missed entries because I was too busy clicking through timeframes to actually execute when the setup triggered.
the traditional approach to higher timeframe analysis creates two major problems:
- problem 1: missed entries. while you're checking the 4-hour chart, your setup triggers on the 5-minute. by the time you switch back, price has already moved and your entry is gone.
- problem 2: analysis paralysis. constantly switching between charts creates mental fatigue. you start second-guessing yourself because you can't hold all the information in your head at once.
introducing the HTF candles indicator
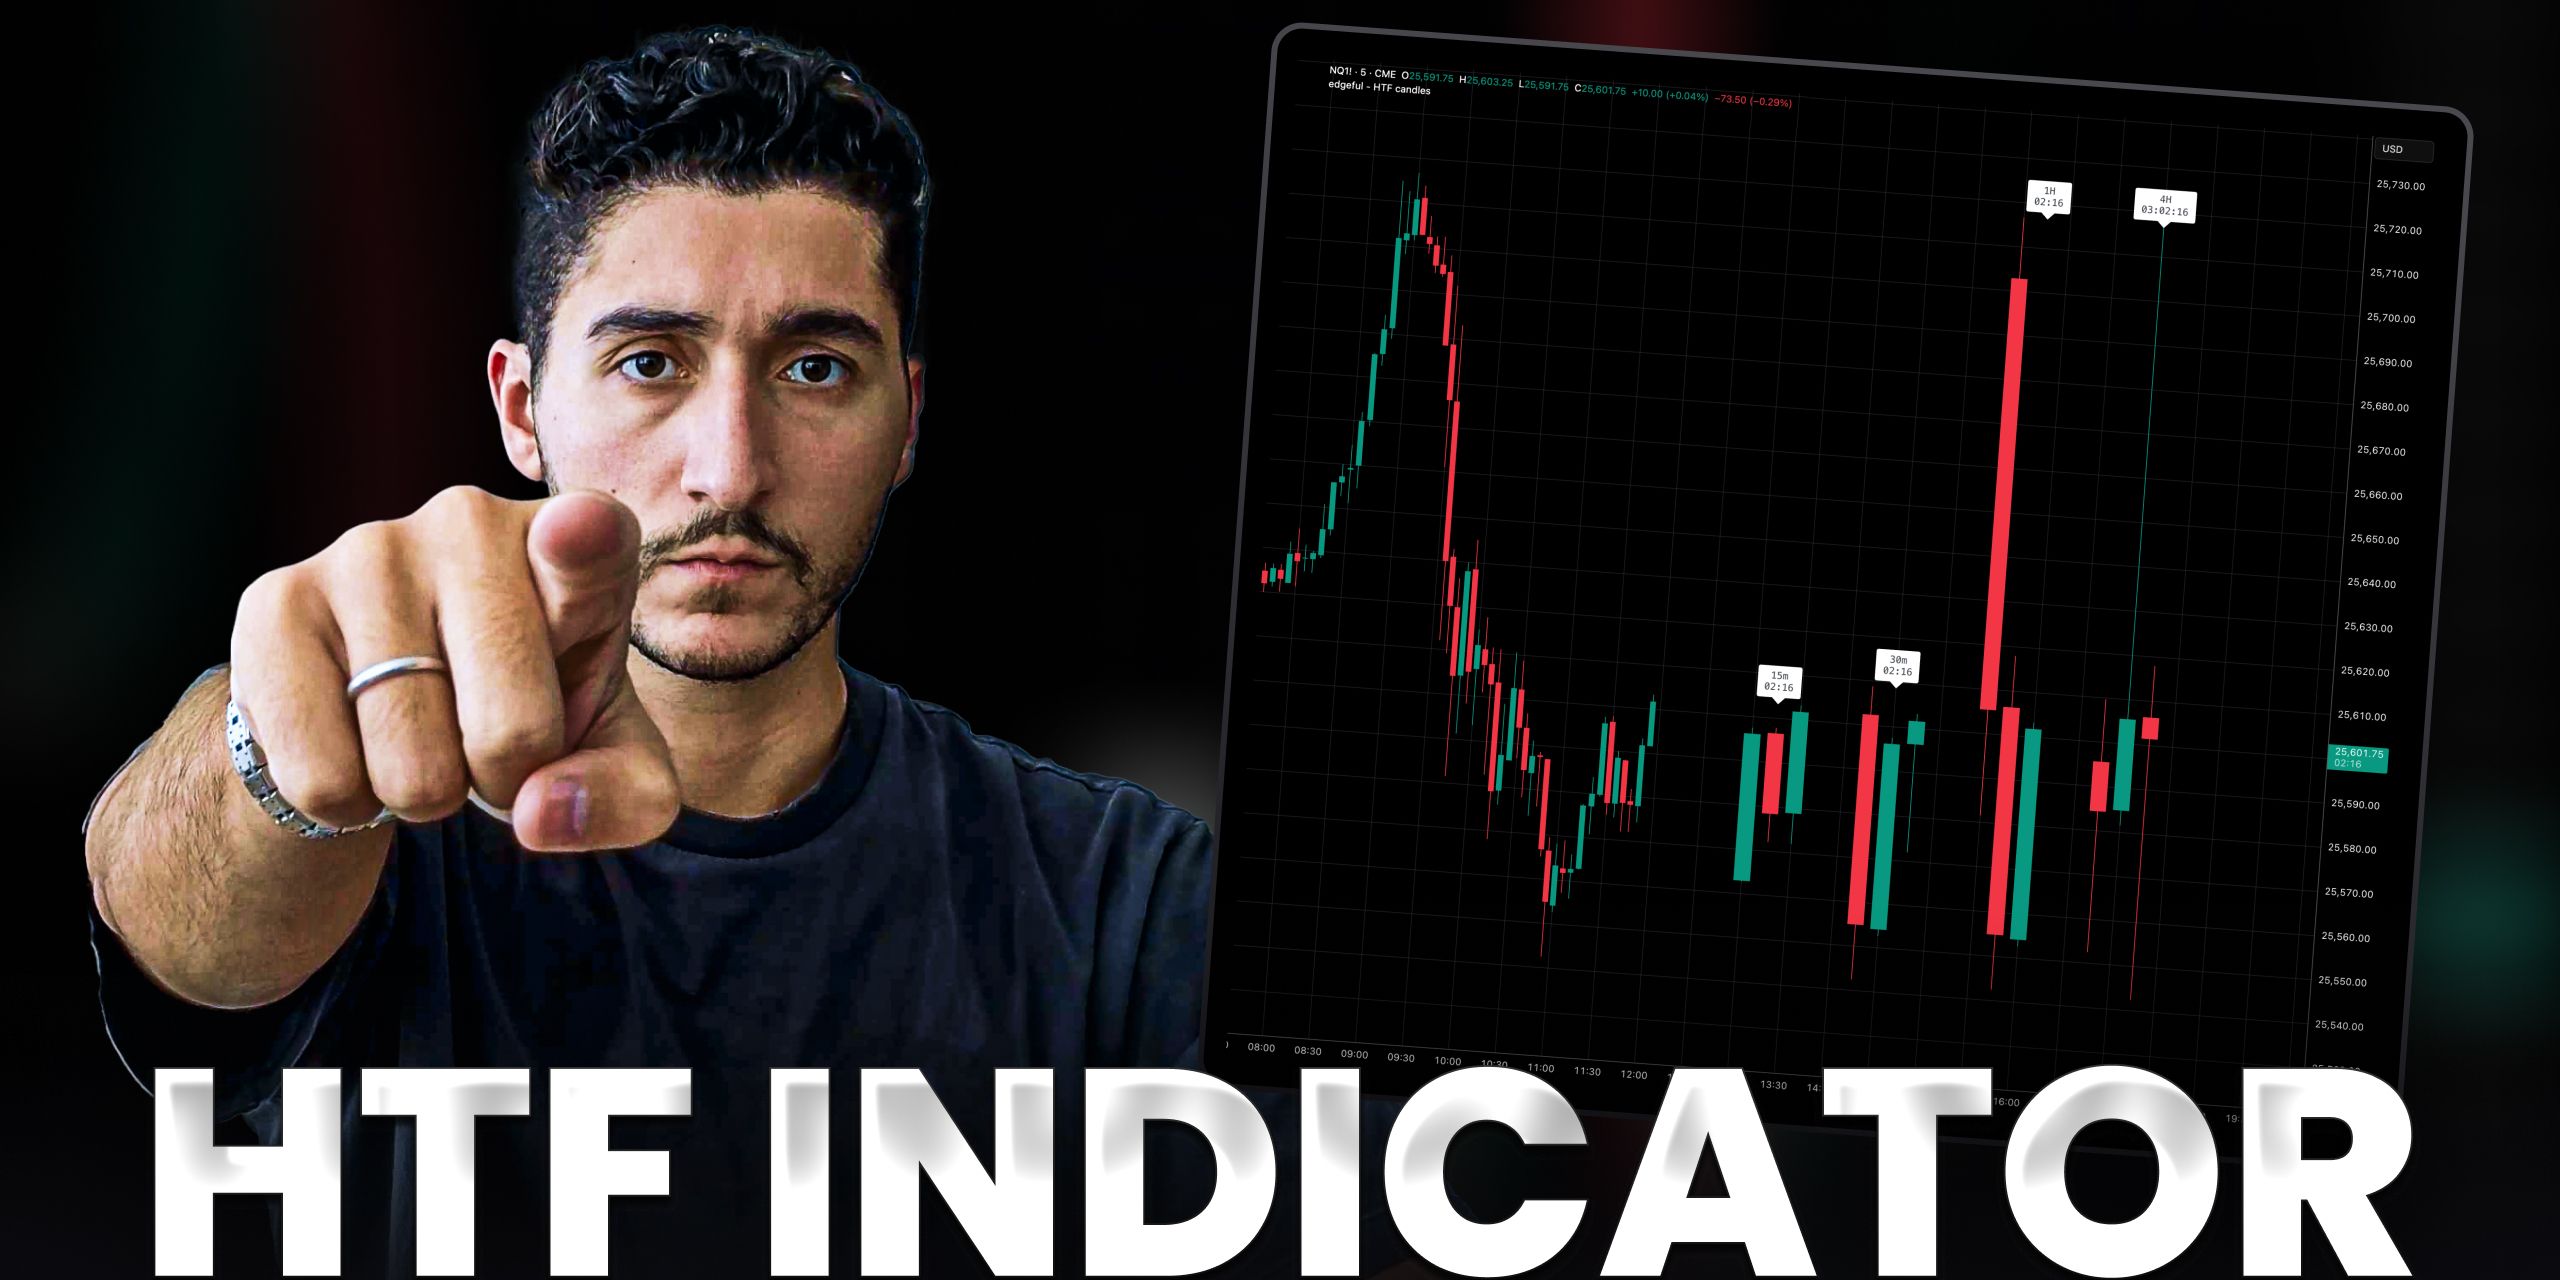
this is why I'm excited to share something we just launched: the HTF (high timeframe) candles indicator.
I've personally become so reliant on this recently.
getting a view of the higher timeframe context before entering a trade has been great for me. and now I can see everything I need on my chart without having to switch.
this higher timeframe analysis indicator solves both problems I mentioned above. no more switching charts. no more missed entries. no more confusion.
here's how it works:
you can pick how many candles from each timeframe you want displayed. so you can have 5 15-minute candles and 3 4-hour candles — all visible on your execution chart at the same time.
you can also pick how many timeframes you want to appear. so if you only want one higher timeframe showing, you don't need all 4. just pick what matters to you.
and obviously, you can change candle colors to match your chart setup so nothing looks weird or distracts you.
the result: one chart. all the context you need. no more switching back and forth.
if you're looking for more TradingView indicators that connect to data-backed reports, we have an entire library of them available to edgeful members.
practical use cases for higher timeframe analysis
let me give you a few ways to actually use this higher timeframe analysis indicator in your trading:
identifying key support and resistance before you trade
load up the 4-hour candles on your 5-minute or 15-minute chart like we did in the example from the start of today's stay sharp.
instantly, you can see where the 4-hour highs and lows are. you'll know immediately if you're approaching a level that could act as resistance or support for your trade — before you enter, not after you get stopped out.
this is the core benefit of higher timeframe analysis: seeing the levels that actually matter before you put on risk.
trend alignment
see the last 3-5 candles from the higher timeframe right on your chart. are they making higher highs? lower lows? now you can align your bias with the bigger picture without ever leaving your execution timeframe.
higher timeframe analysis for trend alignment doesn't have to be complicated. if the 4-hour candles are making lower highs and lower lows, you probably shouldn't be looking for longs on the 5-minute chart.
you don't have to make it more complicated than that.
how to set up the higher timeframe analysis indicator
here's how to get the HTF candles indicator on your charts:
- go to your edgeful dashboard
- click on the TV logo
- put in your TV username
then...
- add the HTF candles indicator to your TradingView
- configure your preferred timeframes (I'd suggest starting with 15-minute + 4-hour)
- adjust candle count (3-5 candles per timeframe is a good starting point)
quick tip: don't use all 4 timeframes at once when you're starting out. begin with just one higher timeframe and see how it feels. you can always add more later. like I said — you don't need all 4.
the goal of this higher timeframe analysis indicator is to simplify your process, not complicate it. start simple and add complexity only if you need it.
wrapping up
Friday's price action was a perfect example of why this matters. the 4-hour resistance at $27,775 held almost to the tick — and anyone only watching the 15-minute chart had no idea it was coming.
higher timeframe analysis helps you see these levels before you trade into them. and now, with the HTF candles indicator, you don't have to flip through charts to get that context.
it's all right there on your execution timeframe.
get access to the HTF candles indicator here →
frequently asked questions
what is higher timeframe analysis?
higher timeframe analysis is the practice of checking longer timeframe charts (like the 1-hour, 4-hour, or daily) to identify key support and resistance levels and overall trend direction before executing trades on shorter timeframes. it helps traders avoid entering trades that conflict with significant levels or the prevailing trend.
which timeframes should I use for higher timeframe analysis?
the most common combination is using 5-minute or 15-minute charts for execution while referencing the 1-hour or 4-hour charts for higher timeframe context. for swing traders, the daily and weekly charts serve as the higher timeframes. the best approach depends on your trading style and how long you typically hold positions.
why do I keep getting stopped out even when my setup looks good?
one of the most common reasons traders get stopped out on "perfect" setups is because they're trading directly into higher timeframe support or resistance levels they didn't see. without proper higher timeframe analysis, you might go long right into 4-hour resistance or short directly into daily support — levels where institutional traders are positioned on the other side.
how many higher timeframes should I analyze before taking a trade?
for most day traders, checking one or two higher timeframes is sufficient. adding too many timeframes creates analysis paralysis and slows down your decision-making. start with your execution timeframe plus the 4-hour chart. if you want more context, add the daily chart — but rarely do you need more than that for intraday trading.
can I do higher timeframe analysis without switching charts?
yes — this is exactly why we built the HTF candles indicator. it plots higher timeframe candles directly on your execution chart, so you can see 4-hour structure while trading on the 5-minute without ever switching timeframes. this eliminates missed entries and the confusion that comes from constantly flipping between charts.