MACD indicator: complete 2026 guide
the MACD indicator is one of the most popular tools in trading. it's on millions of charts across every platform, every asset class, every timeframe.
and most traders use it wrong.
not because they don't understand what it does — but because they expect it to do something it can't. MACD doesn't predict the future. it doesn't catch tops and bottoms. it's a lagging indicator that shows you what momentum has already done.
that doesn't make it useless. it makes it misunderstood.
when you understand what the MACD indicator actually measures and when it works best, it becomes a valuable tool for confirming trends and timing entries. when you expect it to be a crystal ball, you'll get burned by late signals and false crossovers.
this guide covers everything you need to know — how it's calculated, how to read it, the most common strategies, and when it actually adds value to your trading.
table of contents
- what is the MACD indicator?
- how the MACD indicator is calculated
- the three components of MACD
- how to read the MACD indicator
- MACD trading strategies
- best MACD settings
- common mistakes traders make
- MACD vs other indicators
- does MACD work for day trading?
- frequently asked questions
- key takeaways
what is the MACD indicator?
MACD stands for Moving Average Convergence Divergence. it's a momentum and trend-following indicator developed by Gerald Appel in the late 1970s.
the MACD indicator measures the relationship between two exponential moving averages (EMAs). when the shorter EMA is above the longer EMA, momentum is bullish. when it's below, momentum is bearish.
what makes this tool useful is that it shows both:
- trend direction — is momentum bullish or bearish?
- trend strength — is momentum increasing or decreasing?
most indicators do one or the other. MACD does both, which is why it's remained popular for nearly 50 years.
how the MACD indicator is calculated
MACD uses three EMAs in its calculation. understanding the math helps you understand what the MACD indicator is actually telling you.
the formula
- MACD line = 12-period EMA − 26-period EMA
- signal line = 9-period EMA of the MACD line
- histogram = MACD line − signal line
what this means
the MACD line measures the distance between two moving averages. when the 12 EMA is above the 26 EMA, the MACD line is positive. when it's below, it's negative.
the signal line smooths out the MACD line to filter noise. it's a moving average of a moving average.
the histogram visualizes the difference between the MACD line and signal line. when MACD is above its signal line, the histogram is positive (green bars). when MACD is below, the histogram is negative (red bars).
why these numbers?
the default settings (12, 26, 9) were chosen by Gerald Appel based on what worked in the markets of the 1970s. markets have changed, but the settings have stayed the same.
some traders adjust these numbers. we'll cover that later in this guide.
the three components of the MACD indicator
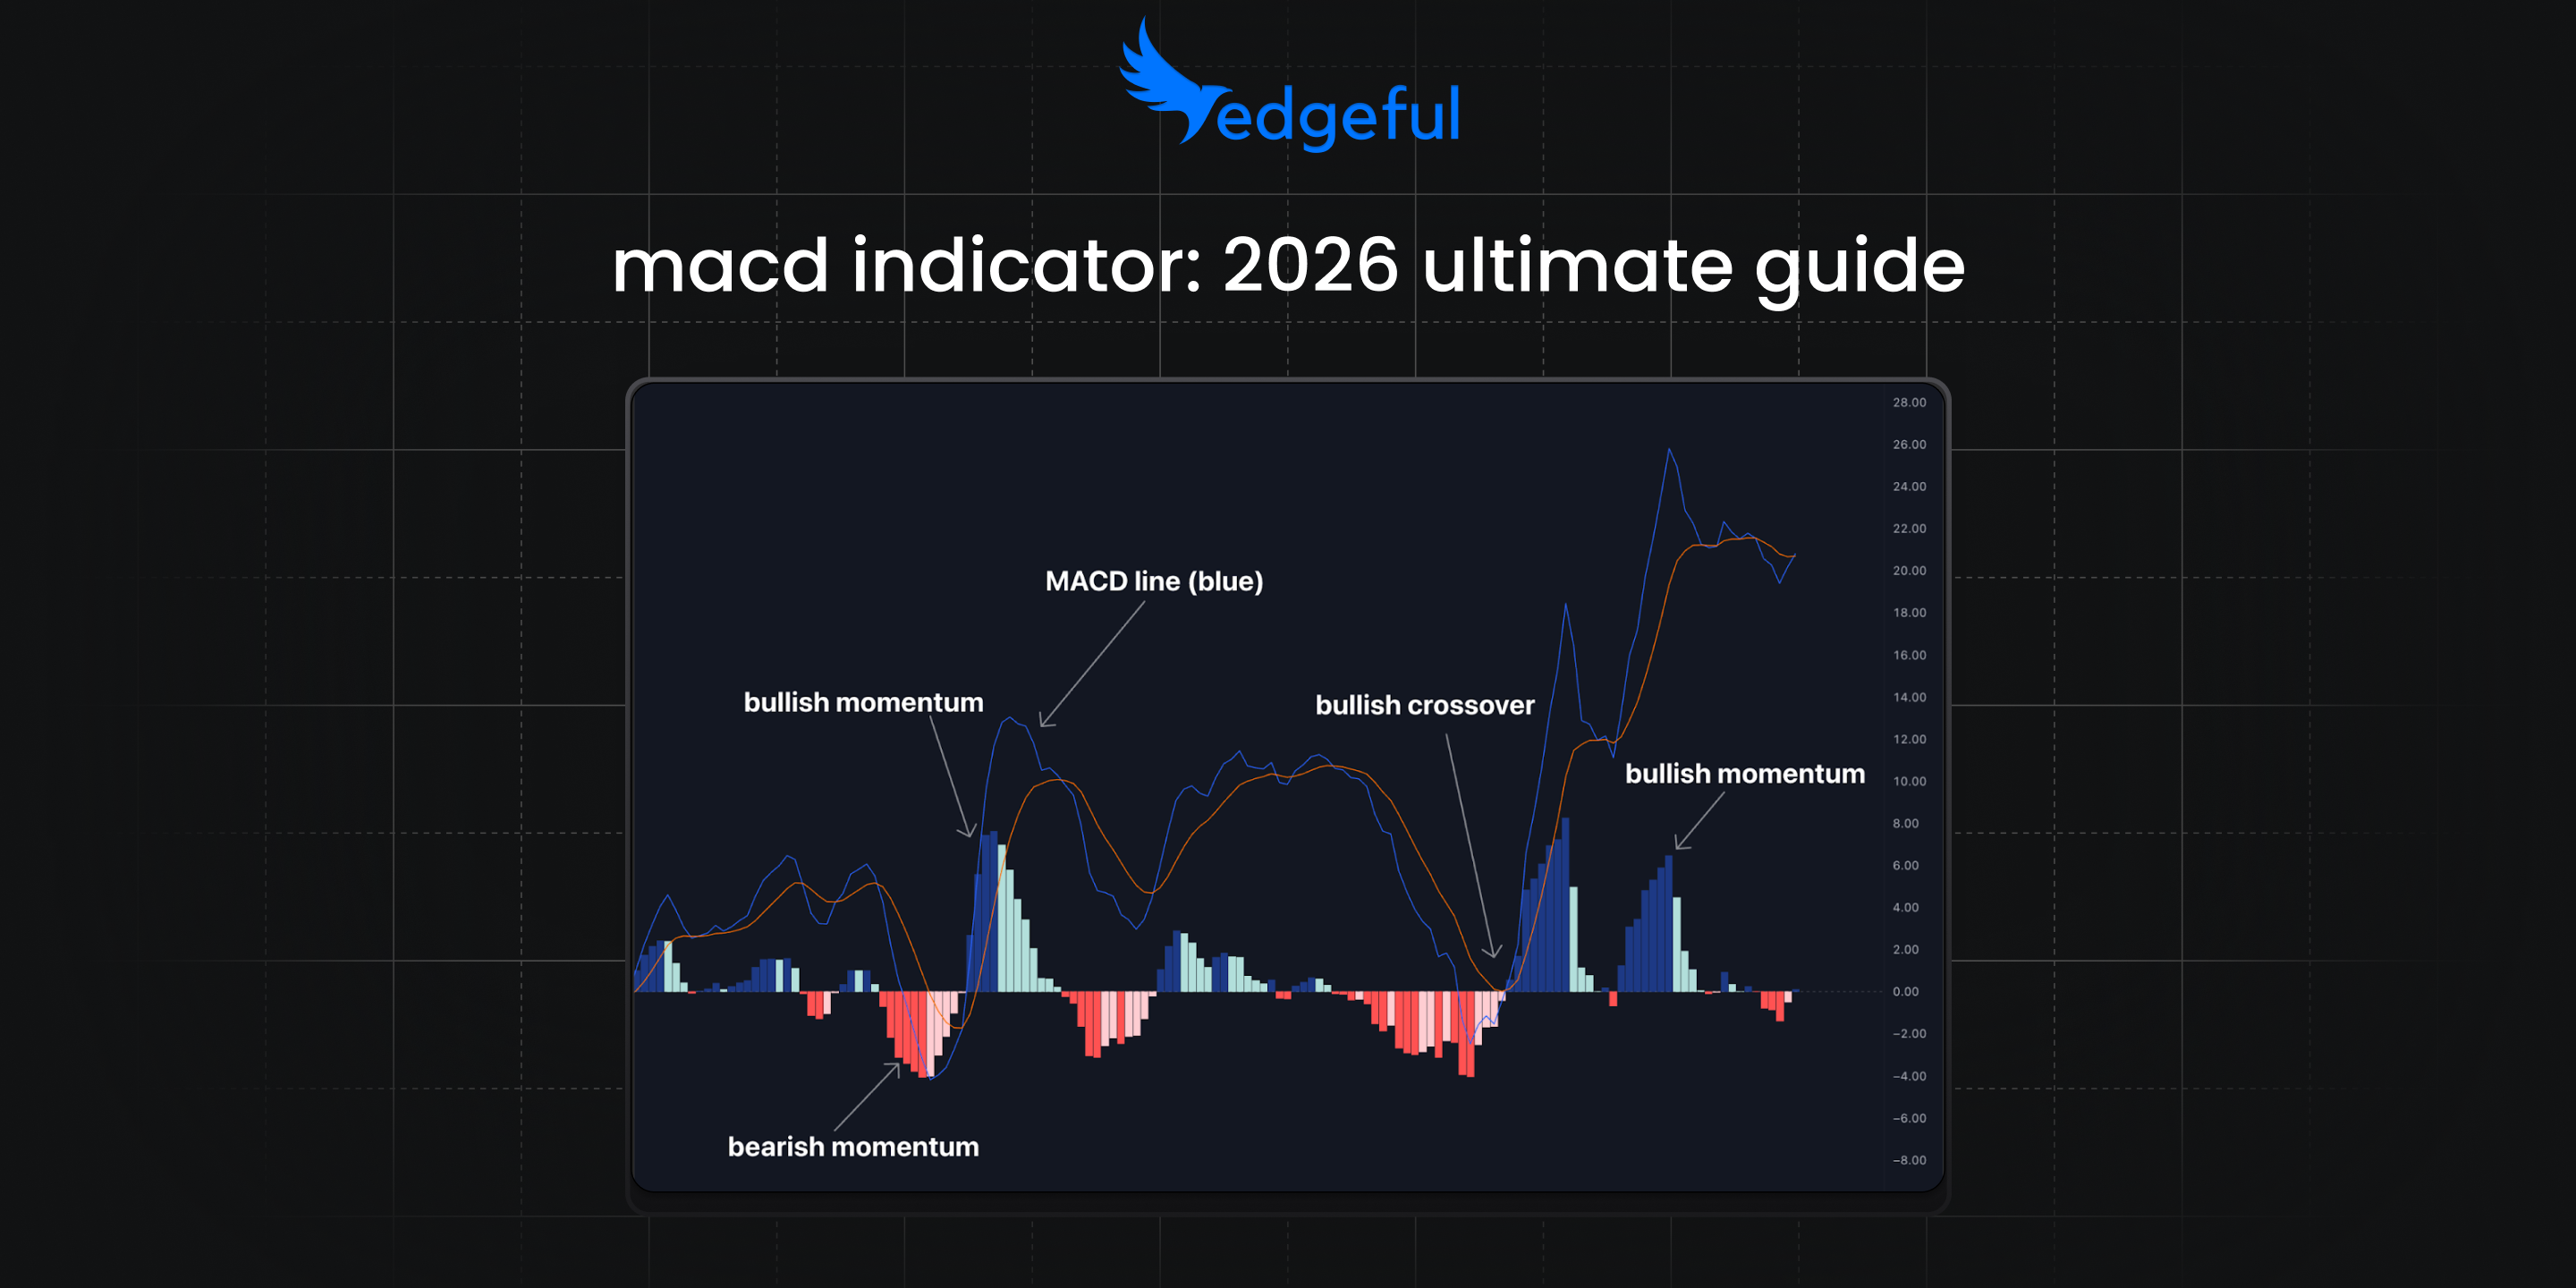
the MACD indicator has three visual components. each tells you something different.
1. the MACD line
this is the primary line — the 12 EMA minus the 26 EMA.
- above zero: short-term momentum is bullish (12 EMA > 26 EMA)
- below zero: short-term momentum is bearish (12 EMA < 26 EMA)
- rising: momentum is increasing
- falling: momentum is decreasing
the MACD line moves faster and is more reactive to price changes.
2. the signal line
this is the 9-period EMA of the MACD line. it's slower and smoother.
the signal line's purpose is to generate trading signals when the MACD line crosses it. it filters out some noise but adds lag.
3. the histogram
the histogram shows the distance between the MACD line and signal line.
- positive (above zero): MACD line is above signal line — bullish momentum
- negative (below zero): MACD line is below signal line — bearish momentum
- growing: momentum is accelerating in that direction
- shrinking: momentum is slowing down
the histogram is often the first component to signal a potential change in direction. when it starts shrinking after a big move, momentum is fading — even if the trend hasn't reversed yet.
how to read the MACD indicator
there are four main signals traders look for when reading the MACD indicator.
1. signal line crossovers
the most common signal.
- bullish crossover: MACD line crosses above the signal line. suggests upward momentum is increasing.
- bearish crossover: MACD line crosses below the signal line. suggests downward momentum is increasing.
the catch: these signals lag. by the time the crossover happens, price has already moved. that's why many traders use crossovers for confirmation rather than entries.
2. zero line crossovers
a stronger signal than signal line crossovers.
- bullish zero cross: MACD line crosses above zero. means the 12 EMA is now above the 26 EMA — a clear shift to bullish momentum.
- bearish zero cross: MACD line crosses below zero. means the 12 EMA is now below the 26 EMA — a clear shift to bearish momentum.
zero line crossovers indicate a change in the underlying trend, not just momentum. they lag more but are more reliable.
3. histogram reversals
watch for the histogram to peak and start reversing before a crossover happens.
if the histogram has been growing (positive and getting larger) and starts shrinking, momentum is fading. this often precedes a signal line crossover.
histogram reversals give earlier signals than crossovers but are also more prone to false signals.
4. divergence
when price and MACD move in opposite directions.
- bullish divergence: price makes a lower low, but MACD makes a higher low. suggests selling pressure is weakening despite lower prices.
- bearish divergence: price makes a higher high, but MACD makes a lower high. suggests buying pressure is weakening despite higher prices.
divergence signals potential reversals but doesn't tell you when. price can continue diverging for extended periods before reversing. use divergence as a warning, not a trigger.
MACD indicator trading strategies
here are the most common ways traders use the MACD indicator.
signal line crossover strategy
the simplest approach.
rules:
- buy when MACD line crosses above signal line
- sell when MACD line crosses below signal line
pros: easy to follow, clear signals cons: lags significantly, many false signals in ranging markets
zero line crossover strategy
more selective than signal line crossovers.
rules:
- buy when MACD line crosses above zero
- sell when MACD line crosses below zero
pros: stronger signal, fewer trades, better for trend following cons: even more lag, misses part of the move
improvement: use zero line crossovers to define bias, not entries. when MACD is above zero, look for long setups. when below zero, look for shorts.
MACD divergence strategy
uses divergence to catch potential reversals.
rules:
- bullish divergence at support = potential long
- bearish divergence at resistance = potential short
- wait for price confirmation (break of recent high/low) before entering
pros: can catch reversals early cons: divergence can persist for a long time, many false signals
improvement: only trade divergence at key support/resistance levels. divergence in the middle of nowhere is meaningless.
best MACD indicator settings
the default MACD indicator settings are 12, 26, 9. should you change them?
default settings (12, 26, 9)
best for: swing trading, daily charts, general use
these settings have been the standard for decades. they're what most traders use, which creates a self-fulfilling aspect — everyone watching the same levels.
faster settings (6, 13, 5)
best for: day trading, lower timeframes, more signals
faster settings make MACD more reactive. you'll get earlier signals but also more false signals. if you're trading on 5-minute or 15-minute charts, faster settings may help reduce lag.
slower settings (19, 39, 9)
best for: position trading, weekly charts, filtering noise
slower settings smooth out MACD and give fewer, more significant signals. if you find the default settings too noisy, try slower settings.
the honest answer
fit the settings above to what matches your timeframe and trading style the most. there is no “right answer”, but making sure the period lengths fit you is the best way to find an indicator that works.
common mistakes traders make with the MACD indicator
1. treating crossovers as automatic signals
a crossover doesn't mean "buy now" or "sell now." by the time MACD generates a crossover signal, price has already moved significantly.
use crossovers for confirmation, not prediction.
2. using MACD in ranging markets
MACD is a trend-following tool. in choppy, sideways markets, it will whipsaw you with false signals over and over.
before trusting MACD, ask: is this market trending? if not, the signals are noise.
3. ignoring the lag
every MACD signal is late. it's built on moving averages, which are lagging by definition.
traders who expect MACD to catch exact tops and bottoms will be disappointed. it's better at confirming moves than predicting them.
4. trading divergence without confirmation
divergence looks great in hindsight. in real-time, it's tricky. price can continue making new highs (or lows) while divergence builds for weeks.
never trade divergence alone. wait for price to confirm with a break of structure.
5. using MACD as your only tool
MACD shows momentum. it doesn't show support/resistance, volume, or market structure.
combining MACD with price action and key levels produces better results than using it in isolation.
MACD indicator vs other indicators
how does the MACD indicator compare to other popular tools?
MACD vs RSI
- RSI measures overbought/oversold conditions. it's bounded (0-100) and shows when price may have moved too far.
- MACD measures momentum direction and strength. it's unbounded and shows whether momentum is increasing or decreasing.
when to use which: RSI is better for range-bound markets and mean reversion. the MACD indicator is better for trending markets and trend following.
can you use both? yes. some traders use RSI to identify potential reversal zones and MACD to confirm momentum shift.
MACD vs stochastic
- stochastic compares current price to its range over a period. like RSI, it's bounded and shows overbought/oversold.
- MACD tracks the relationship between two moving averages.
when to use which: stochastic is faster and more sensitive — good for short-term trading. MACD is smoother — good for trend confirmation.
MACD vs moving averages alone
you could argue MACD is just a fancy way to display two EMAs. and you'd be partially right.
the advantage is the histogram, which visualizes momentum changes more clearly than watching two lines cross. the signal line also provides additional smoothing.
if you already trade moving average crossovers, MACD may not add much. if you want a cleaner visual of momentum, it helps.
does the MACD indicator work for day trading?
this is where traders need to be realistic about the MACD indicator.
the lag problem
MACD lags on any timeframe, but the lag hurts more on lower timeframes.
on a daily chart, a signal that's a few hours late doesn't matter much. on a 5-minute chart, a few bars of lag means you're entering after a significant portion of the move.
when MACD adds value intraday
the MACD indicator can help day traders in specific situations:
- trend confirmation: is momentum bullish or bearish overall? MACD above/below zero tells you.
- histogram monitoring: watching for momentum to fade before a reversal
- filtering trades: only taking setups in the direction MACD is pointing
when MACD doesn't help
- scalping (too much lag)
- catching exact reversals (divergence is slow and unreliable)
- choppy, low-volume sessions (too many false signals)
the day trader's honest take
most successful day traders prioritize price action, key levels, and time-based setups over MACD.
that doesn't mean you can't use it for context. but relying on MACD signals as your primary entry method on lower timeframes is probably not the best strategy to implement.
frequently asked questions
what does the MACD indicator tell you?
the MACD indicator tells you the direction and strength of momentum. when MACD is above zero and rising, bullish momentum is strong. when it's below zero and falling, bearish momentum is strong. crossovers signal potential changes in momentum direction.
what is the best setting for MACD?
the default 12, 26, 9 settings work for most traders on most timeframes. day traders sometimes use faster settings like 6, 13, 5. unless you've tested alternatives thoroughly, stick with the defaults.
is MACD good for day trading?
the MACD indicator can add value for day trading as a trend filter or confirmation tool. it's less effective as a primary entry signal on lower timeframes due to lag. most day traders use it for context rather than triggers.
how do you read MACD divergence?
bullish divergence occurs when price makes a lower low but MACD makes a higher low — suggesting selling momentum is weakening. bearish divergence occurs when price makes a higher high but MACD makes a lower high. divergence signals potential reversals but requires confirmation.
what is the difference between MACD and RSI?
the MACD indicator measures momentum direction and strength using moving averages. RSI measures overbought/oversold conditions on a 0-100 scale. MACD is better for trending markets; RSI is better for ranging markets and mean reversion setups.
key takeaways
- the MACD indicator measures momentum using the relationship between two EMAs (12 and 26 by default)
- three components: MACD line, signal line, and histogram — each provides different information
- signal line crossovers are the most common signal but lag significantly
- zero line crossovers indicate trend changes and are more reliable but slower
- histogram reversals give earlier warnings of momentum shifts
- divergence signals potential reversals but needs price confirmation
- MACD works best in trending markets — avoid using it in choppy conditions
- default settings (12, 26, 9) work for most traders — don't over-optimize
- for day trading, use MACD as context, not as your primary entry trigger
- combine with price action and key levels for best results