
green & red streaks
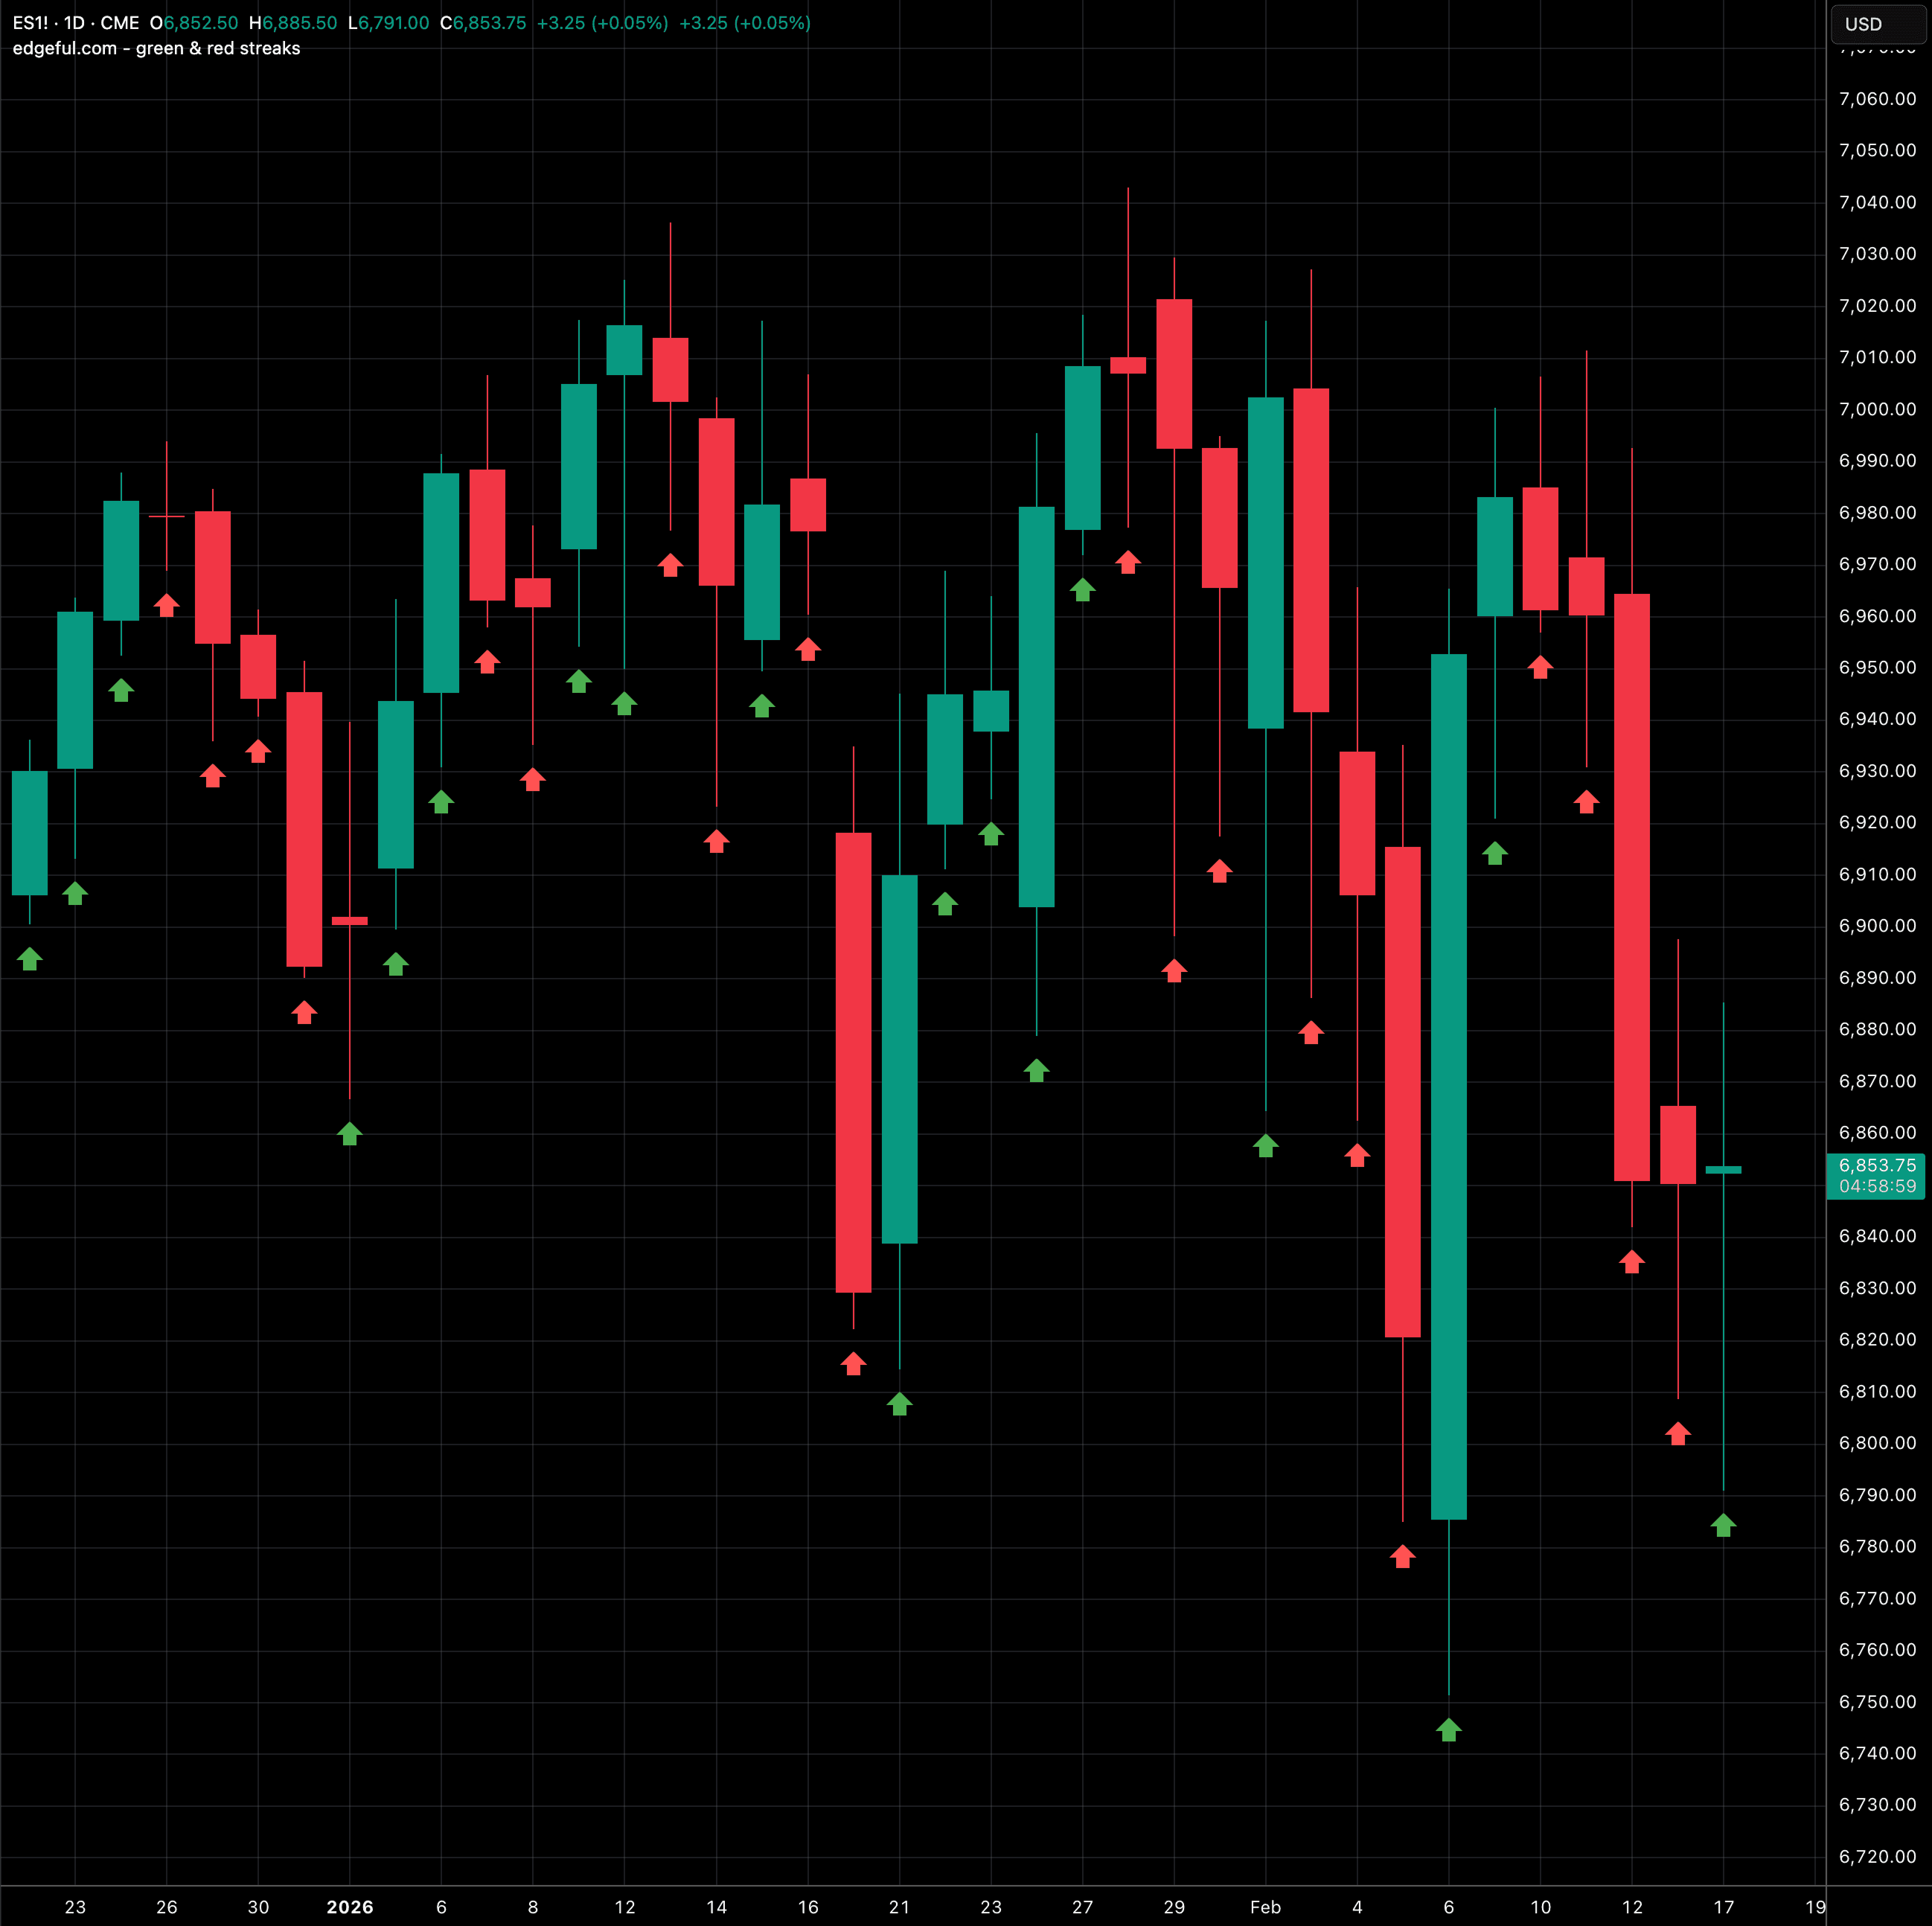
auto-plots consecutive up and down closes on daily, weekly, or monthly timeframes to spot momentum and exhaustion.
what it does
this indicator compares the current close to the previous period's close on daily, weekly, or monthly timeframes. green arrows indicate the period closed higher than the prior period; red arrows indicate it closed lower.
the visual representation makes it easy to identify streaks of consecutive up or down days/weeks/months, useful for identifying overextended moves or momentum continuation patterns.
key features
- works on daily, weekly, and monthly timeframes
- green arrow for closes above previous period
- red arrow for closes below previous period
- visual streak identification
- historical lookback configuration
included with every edgeful plan. add it from your TradingView invite-only scripts in one click.
more price action indicators.
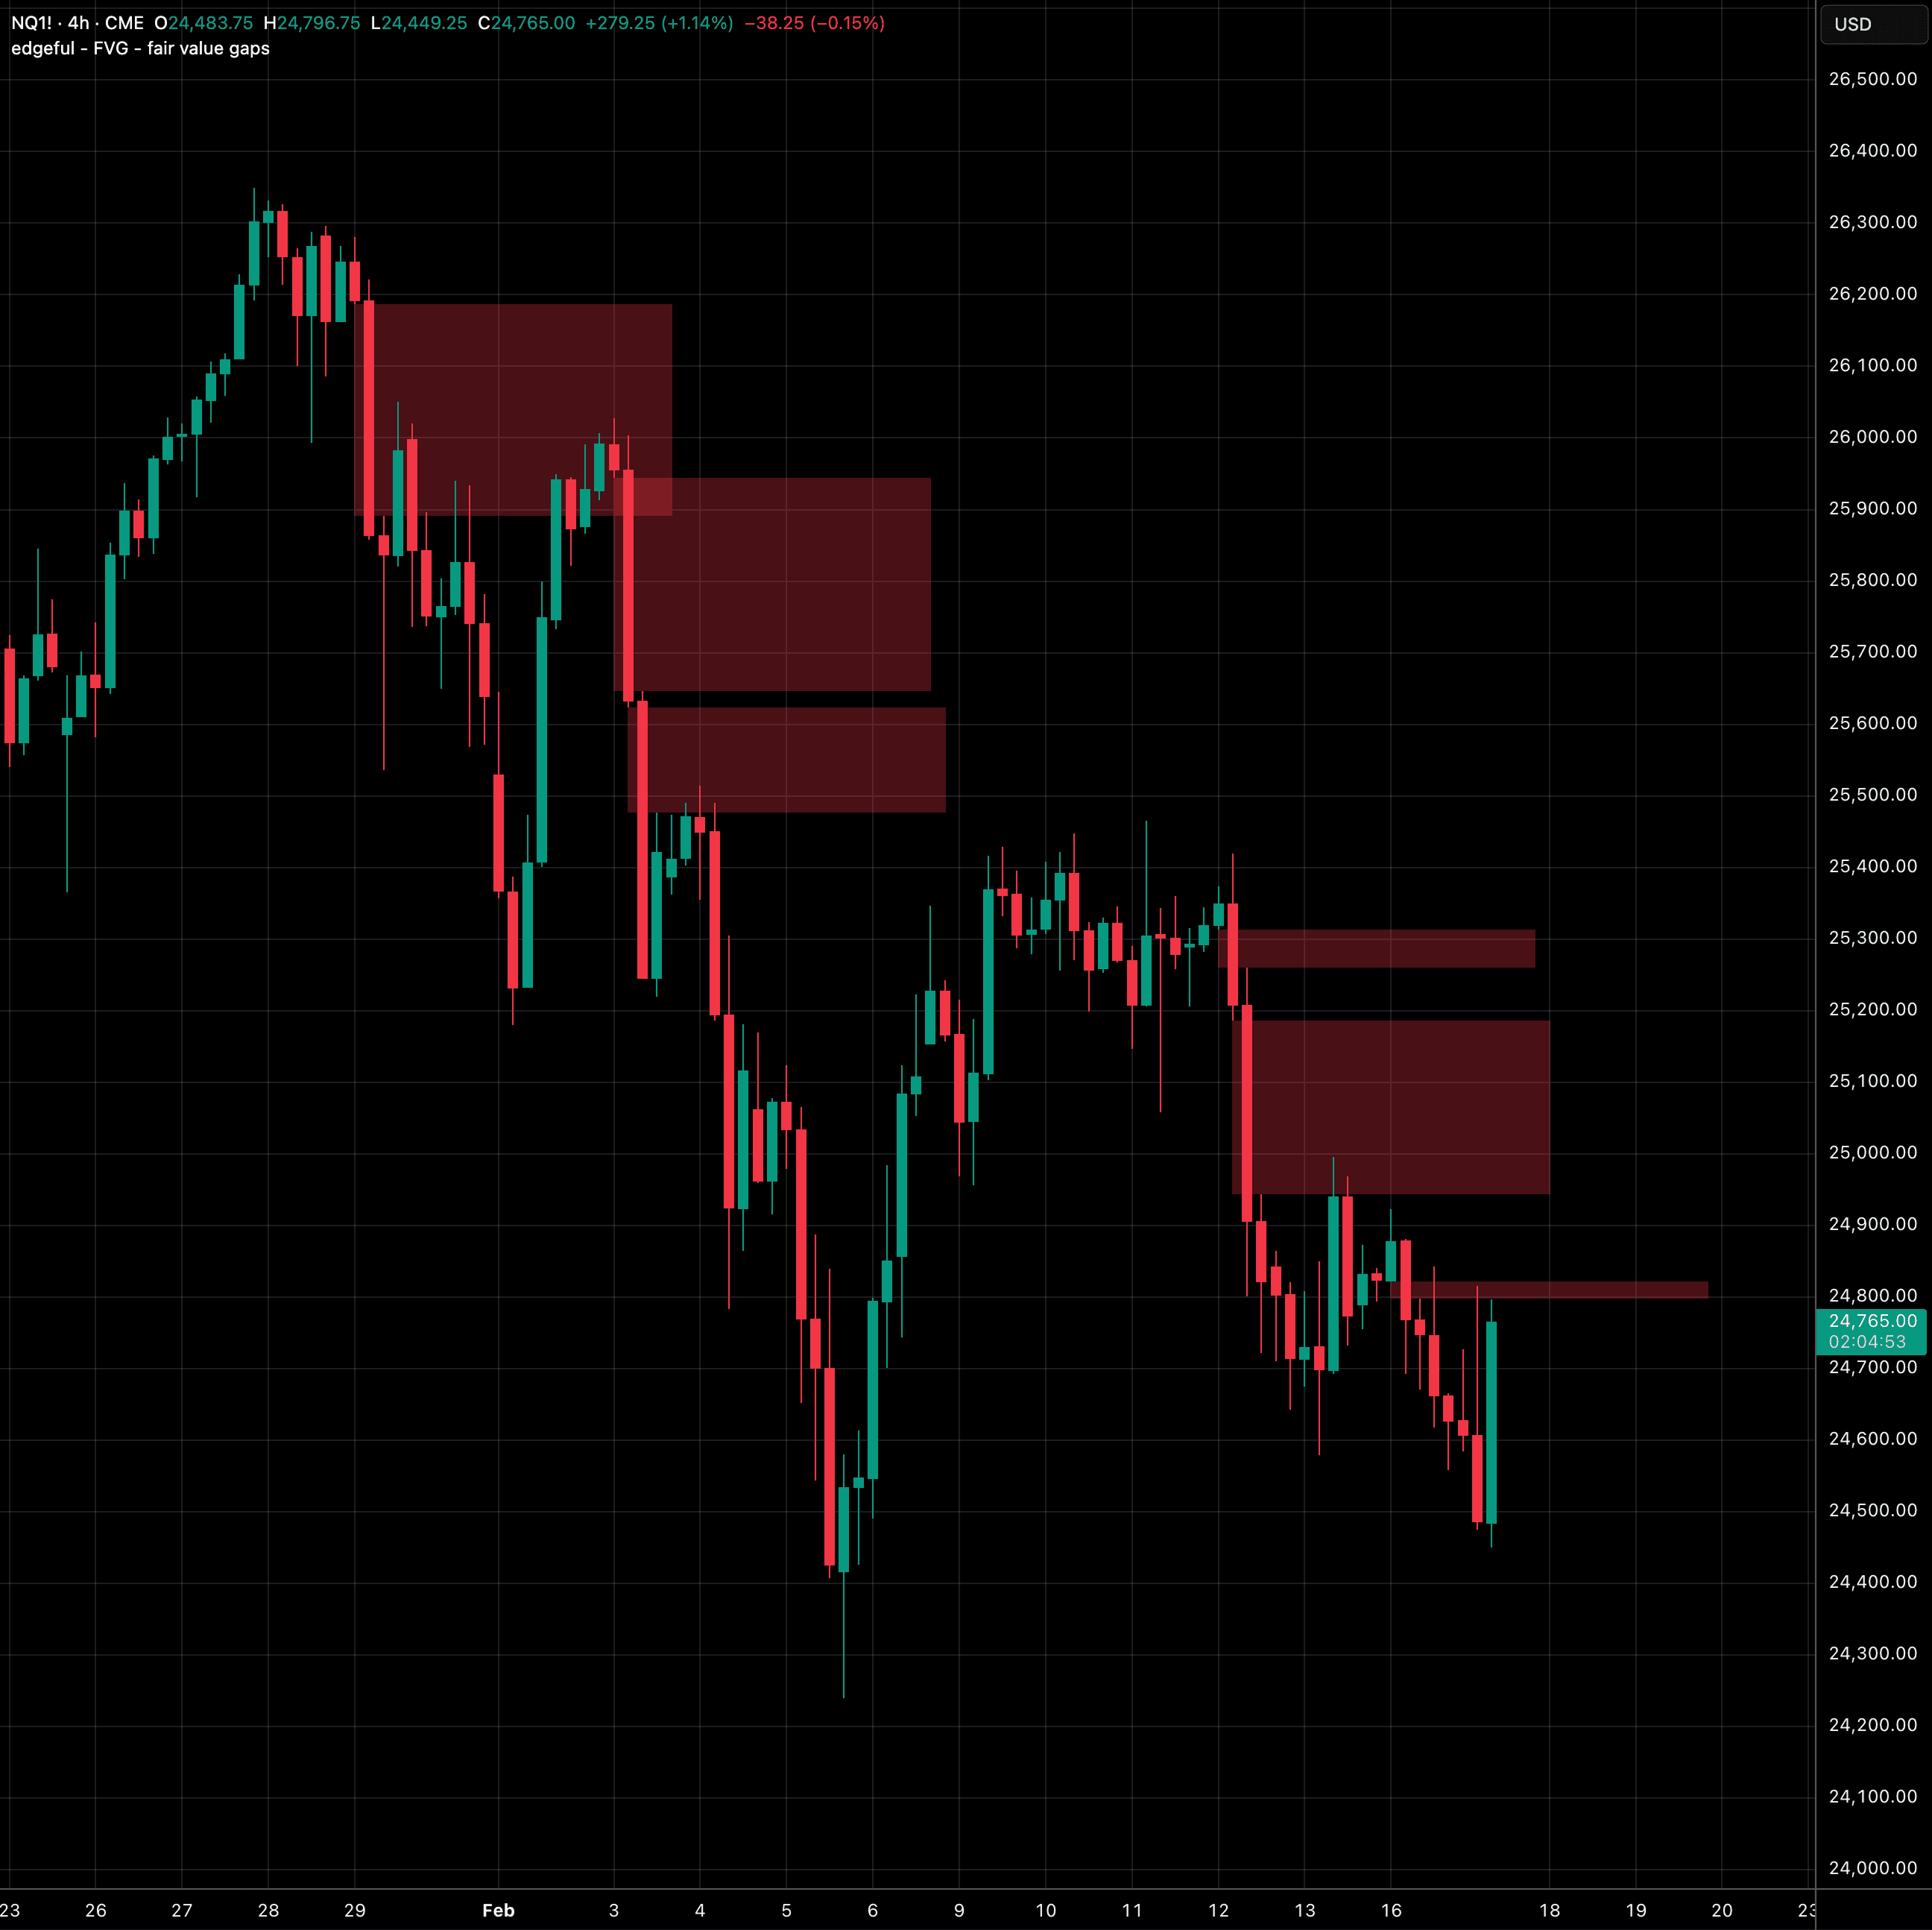
fair value gaps (FVG)
auto-detects FVGs and plots them as boxes, tracking mitigation when price returns to fill each gap.
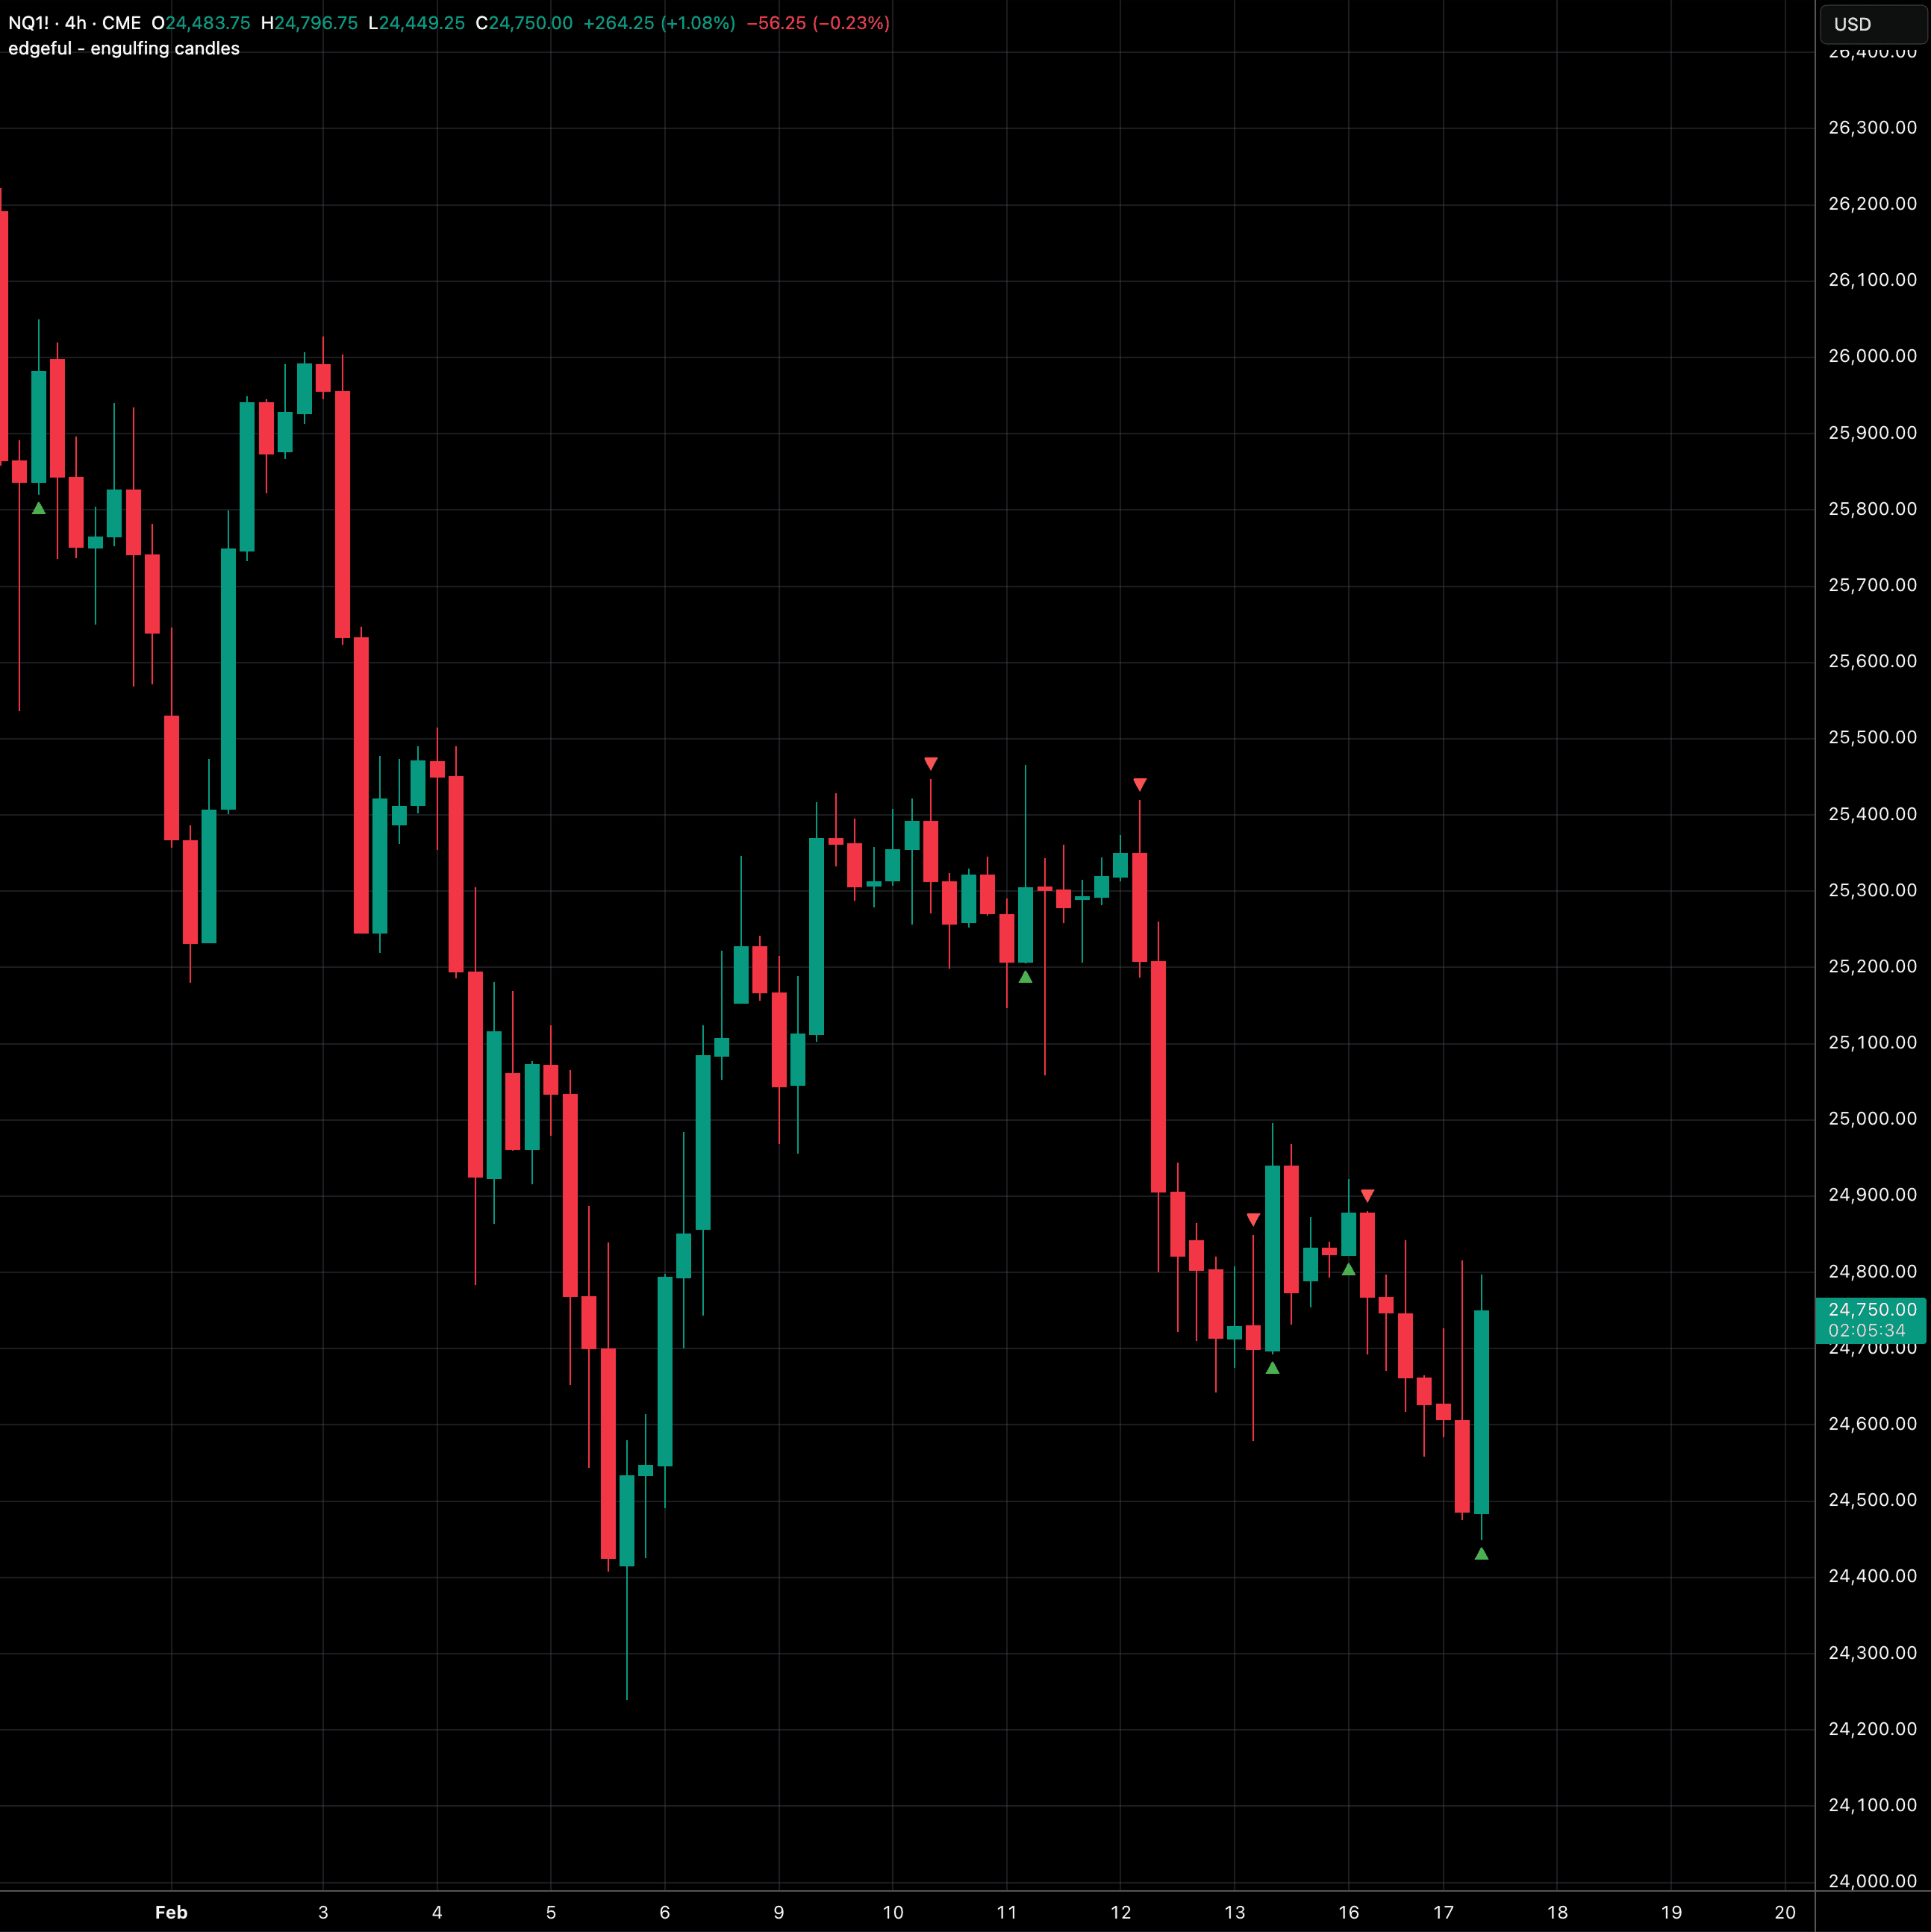
engulfing candles
auto-detects bullish and bearish engulfing patterns with on-chart triangle markers and real-time alert conditions.
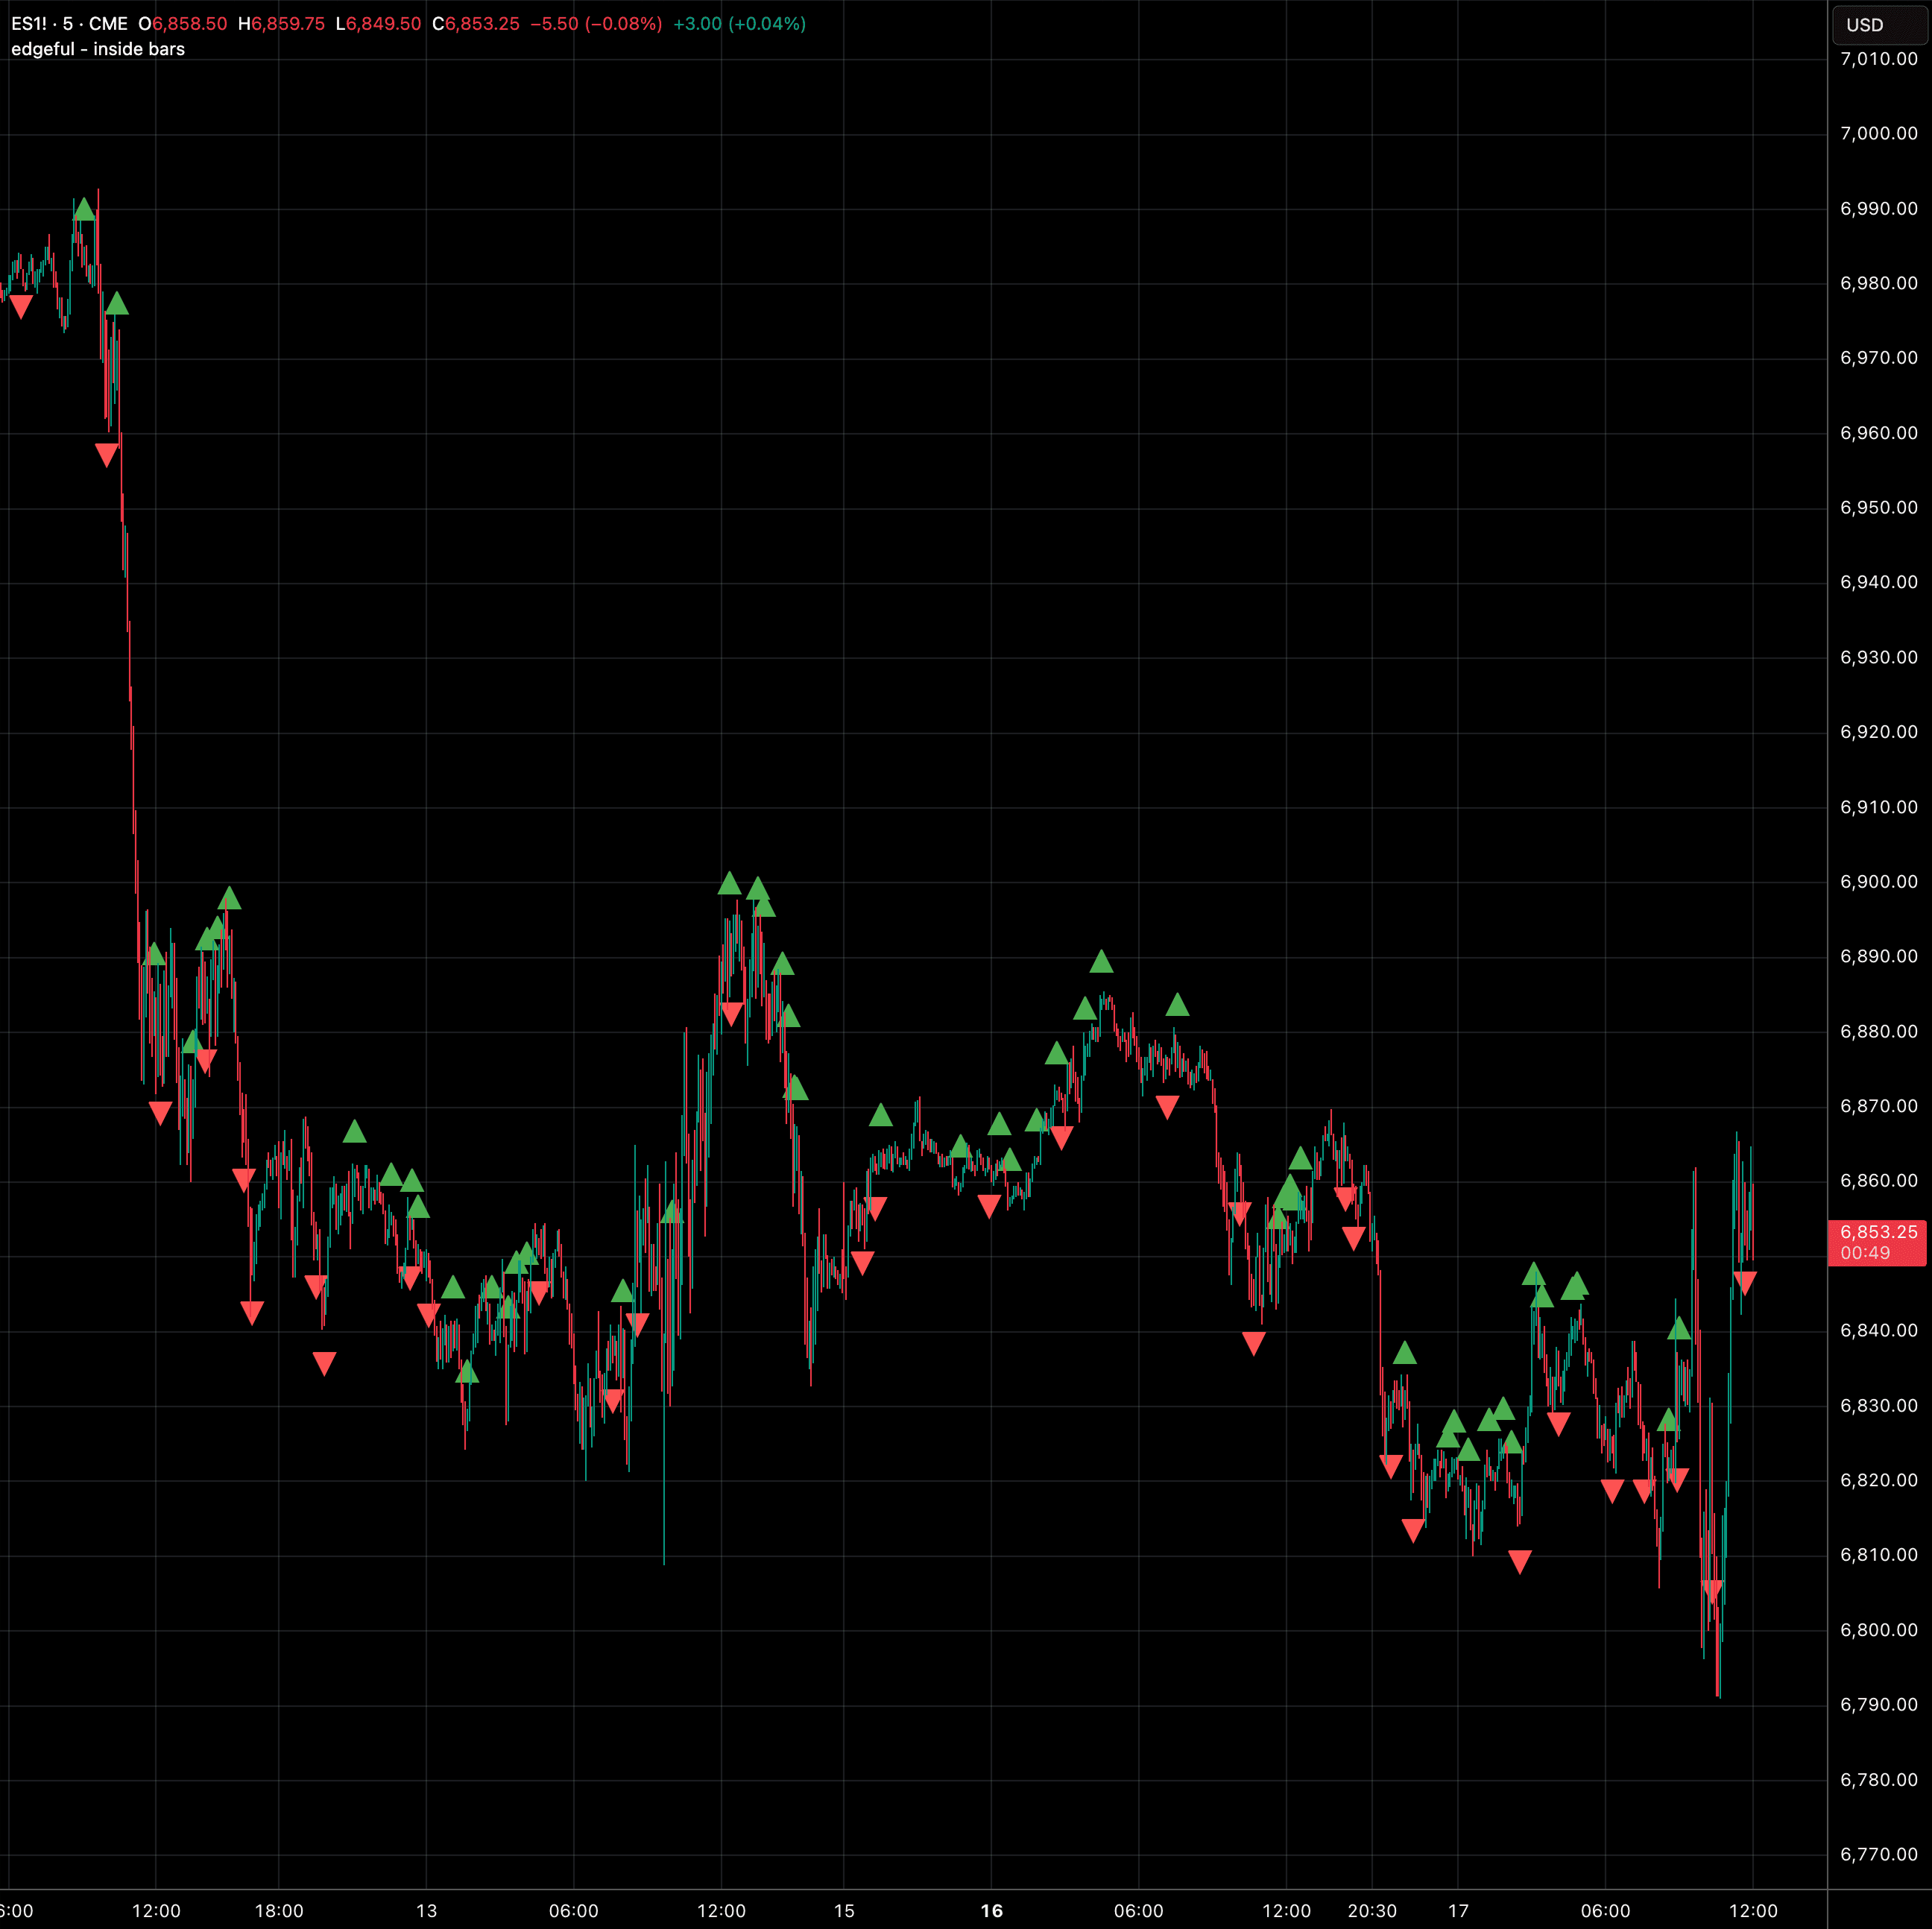
inside bars
auto-detects inside bar patterns and classifies them as bullish or bearish, signaling potential breakout setups ahead.
all of this for $49.
50+ TradingView indicators, 150+ reports, edgeful AI, and every filter you need to trade with data. less than the cost of one bad trade.
4.6/5 on Trustpilot