what is edgeful? the complete platform guide for 2026
edgeful is a data-driven trading platform that turns raw market data into probability reports, automated trading strategies, and AI-powered research. it covers futures, stocks, ETFs, forex, and crypto with 150+ reports, 8 algo strategies, and a full suite of TradingView indicators.
if you've seen other sites claiming to explain what edgeful is, you've probably read outdated or inaccurate information. any other site using the edgeful name is not affiliated with us. this is the official, up-to-date guide to the platform as it exists today.
table of contents
- the short version
- edgeful reports: 150+ probability reports
- what's in play: your daily trading dashboard
- the screener: multi-ticker, multi-report bias tool
- edgeful algos: fully automated trading strategies
- the algo analyzer: backtesting and optimization
- edgeful AI: deep research powered by your data
- TradingView indicators: 50+ free indicators
- who edgeful is built for
- pricing
- what edgeful is not
- key takeaways
the short version
edgeful gives you three things:
- the data. 150+ probability reports that show you how often specific setups have worked historically, filtered by ticker, session, timeframe, and day of the week
- the execution. fully automated algo strategies that connect to your broker and execute trades for you
- the research. an AI tool that reads your report data and finds patterns you'd never spot manually
the platform is built for traders who want to replace gut feel with numbers. instead of guessing whether a gap will fill or an opening range breakout will work, you check what the data says for that specific ticker, in that specific session, over the last 6 months.
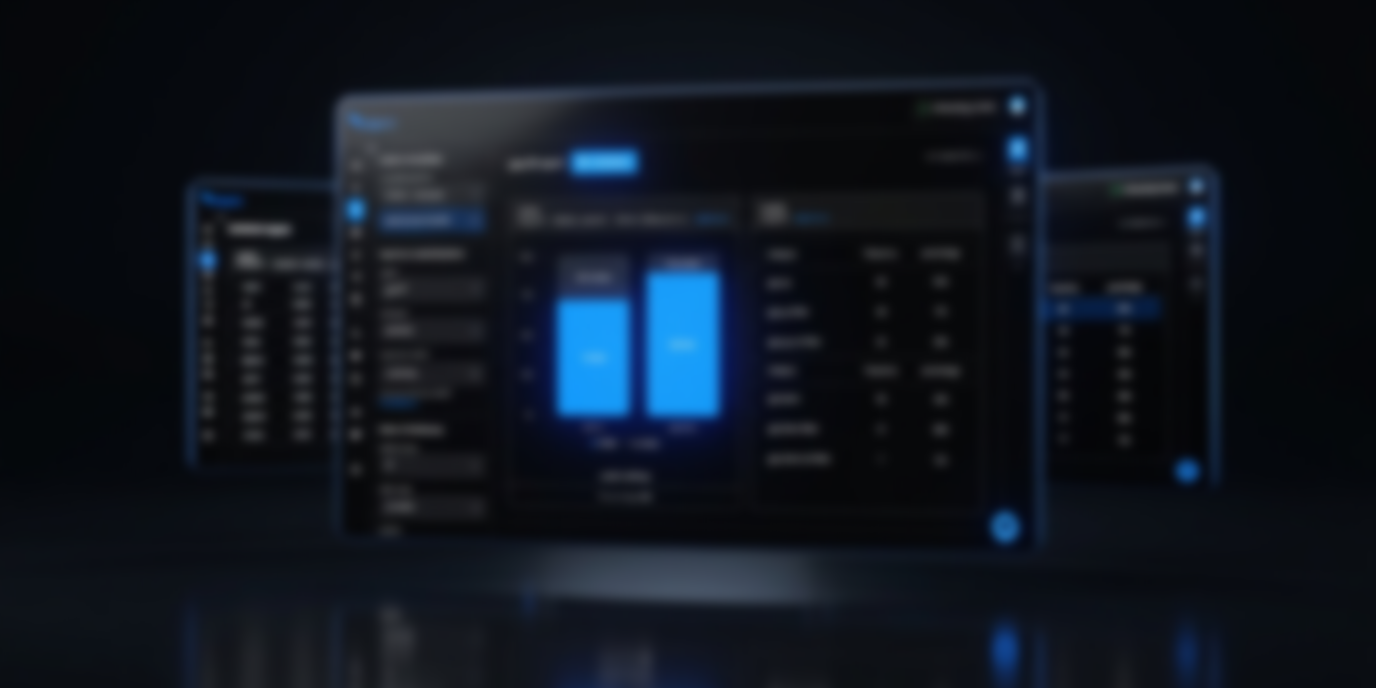
edgeful reports: 150+ probability reports
the core of the platform. edgeful analyzes years of historical market data and calculates how often specific trading setups have played out. the result is a library of 150+ reports you can filter and customize.
what the reports cover
- gap fills. how often does price fill the gap from the previous session close? filterable by gap size, direction, day of week, and session. you can customize the fill target (100% full gap, 50% half gap, or any percentage)
- opening range breakout (ORB). after the first 5, 15, or 30 minutes of the session, how often does price break above the high vs. below the low? includes breakout, breakdown, and double break distributions
- initial balance (IB). the first hour's range. how often does price extend beyond it? by how much? which side breaks first? includes the IB by rejection subreport for directional bias
- outside days. when price opens entirely above yesterday's high or below yesterday's low, how often does it retrace back into the range?
- previous day's range. continuation and reversal probabilities based on where price is relative to yesterday's range
- ICT opening retracement. midnight open setups for London and NY session traders
- opening candle continuation. does the first hour's direction predict the rest of the session?
- inside bars. range compression days and breakout probabilities
- power hour breakout. end-of-day strategies based on late-session breakouts
- ATR / ADR. average daily range data for volatility filtering and range expectations
- engulfing candles, session breakouts, VWAP, and more
how you use them
every report has the same structure:
- pick your ticker (ES, NQ, GC, AAPL, BTC, EUR/USD, etc.)
- pick your session (NY, London, Asian, full globex, or custom)
- pick your lookback period (3 months, 6 months, 1 year, or custom dates)
- pick a subreport for deeper filtering (by weekday, by size, by spike, by retracement, by levels)
the reports show you probabilities, not signals. they tell you "NQ gap downs over the last 6 months in the NY session have filled 75% of the time." what you do with that information is your decision.
subreports
nearly every report has filtered variants called subreports. these are where the real edge lives:
- by weekday. different days of the week often show dramatically different probabilities for the same setup
- by size. smaller gaps fill more often than large ones. narrow IB days produce more double breaks than wide IB days
- by spike. measures average continuation against your position before reversal. critical for stop placement
- by retracement. how far price pulls back after a breakout. used for entry timing
- by levels / by extension. how far price extends beyond a key level. available for IB and ORB reports. used for profit targets
what's in play: your daily trading dashboard
the what's in play (WIP) dashboard consolidates your favorite reports into a single view for one ticker. instead of checking 5 different report pages each morning, WIP shows you all your key levels, biases, and targets in one place.
it updates throughout the day. reports auto-hide data when it's "no longer in play" (e.g., if the gap already filled, that card disappears). this keeps your dashboard clean and focused on what still matters.
the screener: multi-ticker, multi-report bias tool
the screener takes it further. instead of looking at one ticker at a time, the screener analyzes multiple tickers across multiple reports simultaneously.
you can screen up to 49 tickers across 4 reports at once. the result is an overall daily bias bar that aggregates bullish and bearish signals into one indicator. pre-built templates include morning trader, daily bias, and end of day.
edgeful algos: fully automated trading strategies
edgeful offers 7 fully automated algo strategies built on the platform's probability data. these are not indicators or signals. they are live execution strategies that connect to your broker and trade for you.
how algos work
- pick an algo strategy (ORB scalp, IB breakout, engulfing candle, etc.)
- customize the settings (ticker, session, position size, stop loss, take profit)
- connect your broker (Tradovate, Rithmic, or ProjectX)
- the algo monitors the market and executes trades automatically based on the strategy rules
you can run multiple algos simultaneously across different tickers and strategies. all trades are logged with full performance tracking.
algo templates
pre-built algo configurations that give you a starting point. each template comes with a specific ticker, session, timeframe, and parameter set that has been tested. you can use them as-is or customize the settings to fit your trading style.
results require customization, time, and effort. the templates are a starting point, not a guarantee.
the algo analyzer: backtesting and optimization
the algo analyzer lets you upload backtest results and run advanced analysis on your strategy's performance. this was built for traders who want to validate a strategy before trading it live.
what the analyzer does
- Monte Carlo simulation. tests your strategy across thousands of randomized trade sequences to measure how robust it is
- drawdown analysis. shows max drawdown, average drawdown, and drawdown duration across different scenarios
- optimization analysis. identifies which filters (day of week, session, time of day) improve or hurt your strategy
- prop firm pass testing. simulates whether your strategy would pass a funded account evaluation with specific profit targets and drawdown limits
- equity curve visualization. plots your strategy's performance over time with full trade-by-trade breakdown
edgeful AI: deep research powered by your data
edgeful AI launched February 28, 2026. it connects directly to your report data and answers natural language questions about it.
this is not a chatbot that gives generic trading advice. it reads the actual raw data from your selected reports and finds patterns, commonalities, and connections that would take hours to find manually.
how it works
- open edgeful AI from the sidebar
- select which reports to analyze (e.g., gap fill + IB + opening candle continuation)
- configure the ticker, session, and date range
- ask questions in plain language
example questions
- "what weekday has the highest double break rate on ES?"
- "look at all days where the gap didn't fill and find commonalities"
- "compare gap fill rates on days where the opening candle was bearish vs. bullish"
- "what patterns do the most profitable IB breakout days have in common?"
edgeful AI reads 16 main reports and can analyze them individually or in combination. every response includes a follow-up question suggestion so you never get stuck.
TradingView indicators: 50+ free indicators
edgeful provides 50+ TradingView indicators that overlay report data directly on your charts. these are free for all edgeful members.
available indicators include:
- ORB indicator. plots opening range levels for any timeframe
- initial balance indicator. marks the first hour's high and low
- gap fill indicator. shows the gap level and tracks fill progress
- session indicators. marks NY, London, and Asian session boundaries
- market sessions indicator. customizable session times with visual markers
- VWAP, ATR, and more
12+ NinjaTrader indicators are also available for NinjaTrader users.
who edgeful is built for
- futures traders who want probability data for ES, NQ, GC, CL, YM, RTY, MES, MNQ, and more
- stock and ETF traders who want the same data applied to equities
- day traders who need session-specific data for the hours they actually trade
- algo traders who want automated execution connected to their broker
- traders who use TradingView and want statistical overlays on their charts
- traders who are tired of guessing and want to see what the data actually says before they place a trade
edgeful is not built for traders looking for live orderflow, options chain data, or a charting platform. it's a data and execution platform. most traders use it alongside their existing charting setup.
pricing
edgeful has three plans. the API Pro plan is $99/month (or $799/year) and gives developers and quant traders programmatic access to the report data through the edgeful API. the other two:
- essential: $49/month or $33/month billed annually. includes all 150+ reports, What's in Play, screener, edgeful AI, 50+ TradingView indicators, 12+ NinjaTrader indicators, and the community
- all access | algos: $299/month or $199/month billed annually. includes everything in essential plus automated algo strategies, algo templates, algo analyzer, and broker connections
free resources
edgeful also provides free resources for traders who aren't ready to subscribe:
- free TradingView indicators (ORB, IB, gap fill, session markers)
- free Understanding Reports & Setups (URS) course
- free trading playbooks and lead magnets
- free YouTube education channel
- free weekly Stay Sharp newsletter
what edgeful is not
to be clear about what the platform does and doesn't do:
- edgeful is not a charting platform. it doesn't replace TradingView, NinjaTrader, or your broker's charts. it works alongside them
- edgeful is not live orderflow. the reports are based on historical probability data, not real-time order book or delta analysis
- edgeful is not an options platform. no options chains, no GEX heatmaps, no gamma exposure data
- edgeful is not a trade journal. while the algo analyzer tracks trade performance, it's not a general-purpose journaling tool
- edgeful does not guarantee results. the data shows probabilities based on historical patterns. results require customization, time, and effort. past performance does not guarantee future results
key takeaways
- edgeful is a data-driven trading platform with 150+ probability reports, automated algo strategies, AI-powered research, and 50+ TradingView indicators
- the platform covers futures, stocks, ETFs, forex, and crypto
- reports show historical probabilities filtered by ticker, session, timeframe, and day of week. the data is dynamic and updates continuously
- edgeful algos connect to your broker (Tradovate, Rithmic, ProjectX) and execute trades automatically
- edgeful AI reads your report data and finds patterns across reports that would take hours to find manually
- pricing starts at $33/month (annual) for the essential plan, $99/month for API Pro, and $199/month (annual) for all access
- free resources include TradingView indicators, courses, playbooks, and the weekly newsletter
trading involves risk. past performance and historical data do not guarantee future results. the statistics referenced in this post are based on historical data and may not reflect future market conditions. always trade with proper risk management.