why most traders get previous day's range levels completely wrong
most traders think breaks of previous day's high or low are reversal areas — but the previous day's range data shows something completely different. the edgeful previous day's range report reveals that 67% of the time when YM breaks the previous day's high, the session closes green. if you've been treating these levels as resistance and support, you're missing what the data is actually telling you.
here's the truth: the previous day's range isn't about finding reversal opportunities. it's about determining session bias with data-backed probabilities that most traders completely ignore.
table of contents
- the costly mistake with previous day's range levels
- what the previous day's range report actually measures
- understanding the two calculation methods
- how to use previous day's range for session bias
- the by outside close subreport
- weekday variations that change everything
- step-by-step trading application
- key takeaways
- frequently asked questions
the costly mistake most traders make with previous day's range levels
here's something I see all the time:
most traders think breaks of previous day's high or low are areas to take profits or enter reversal trades. they see price break above yesterday's high and immediately think "that's resistance, time to short" or they see their long position hit yesterday's high and panic sell thinking it's going to reverse.
this thinking is completely backwards and is costing you money.
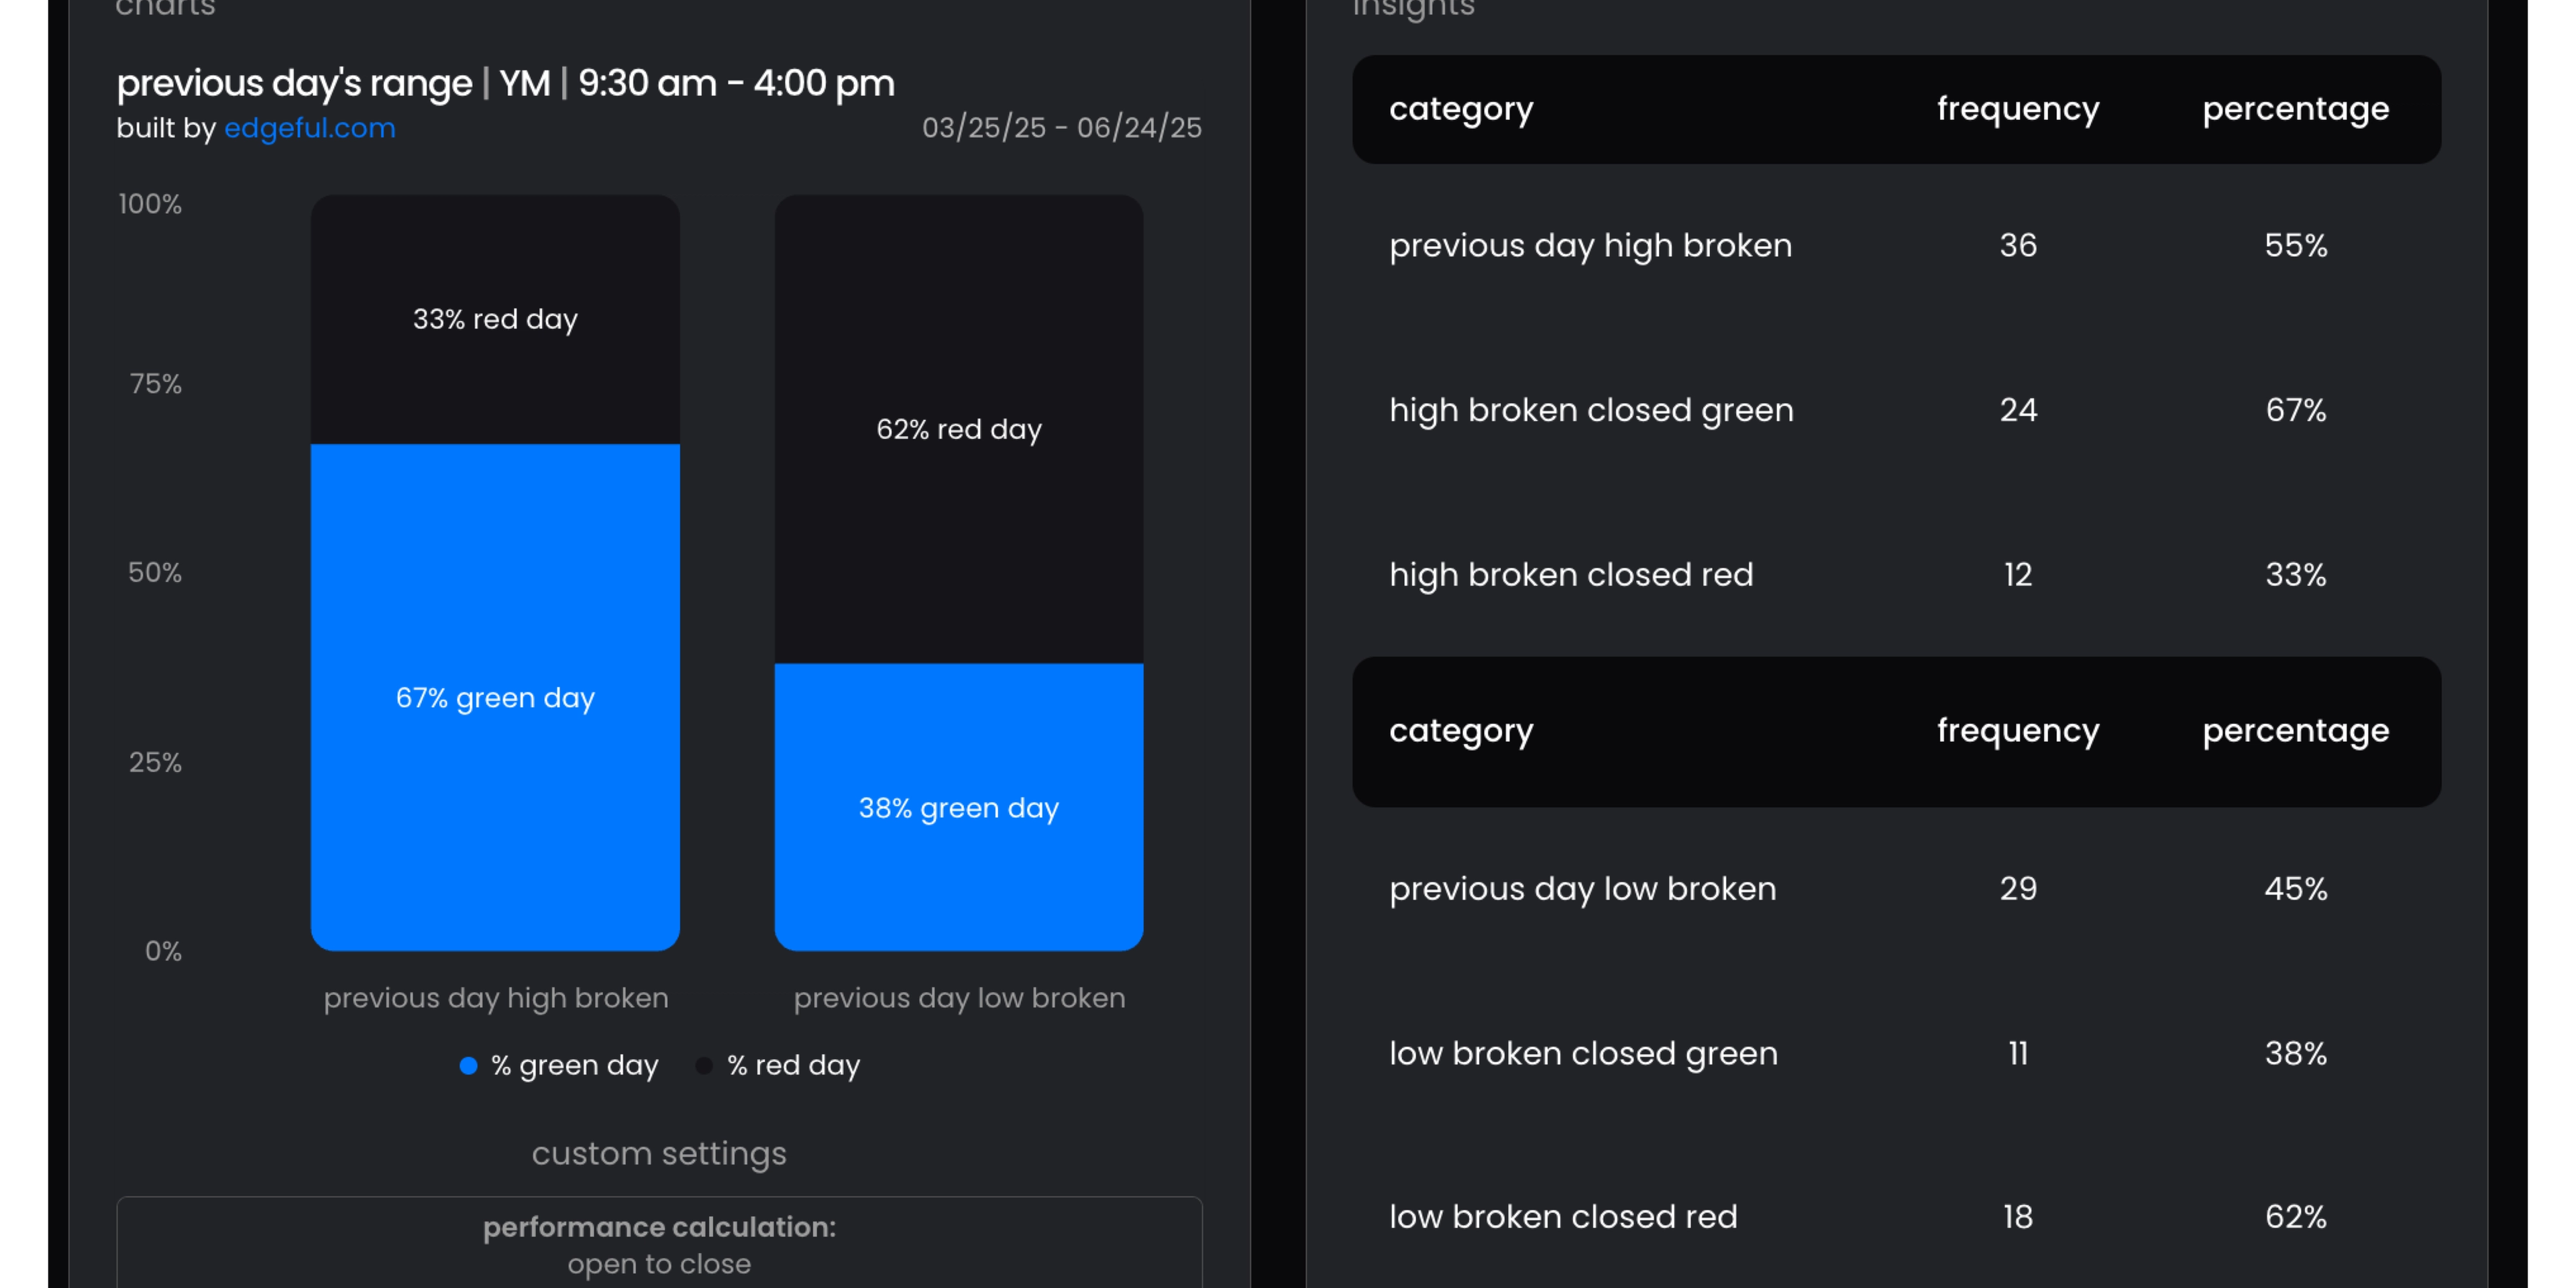
here's what the previous day's range data actually shows on YM over the last 6 months:
- when previous day's high is broken, the session closes green 67% of the time
- when previous day's low is broken, the session closes red 62% of the time
these aren't reversal levels — what they really show you is what your session bias should be.
for example: let's say YM has already broken the previous session's high, but for some reason you're still spamming shorts. not only are you going directly against data — which shows there's a 67% chance of a green close — you're likely going to lose money being on the wrong side of the market.
this is exactly why understanding the previous day's range report is crucial for day trading session bias rather than fighting against it.
what the previous day's range report actually measures
the previous day's range report tracks exactly what happens after price breaks the previous session's high or low during the current session.
it's measuring two key scenarios:
scenario 1: previous day's high is broken — how often does the day close green vs. red?
scenario 2: previous day's low is broken — how often does the day close green vs. red?
important note: we're only looking at the NY session ranges. if you're using this report, you need to understand that we're completely ignoring overnight action and focusing purely on 9:30am-4:00pm ET price action.
this means when I say "previous day's high," I'm referring to the previous NY session's high, not the 24-hour high. same with the low. this session-based approach gives you much cleaner data because it eliminates the noise from overnight moves.
the report then measures whether today's session closes above or below one of two specific data points:
- the prior session's close, or
- the current session's open
this brings us to understanding the two calculation methods that can dramatically impact your futures trading indicators.
understanding the two calculation methods
there are two ways to calculate whether a day is "green" or "red," and understanding the difference is crucial for using the previous day's range effectively:
previous close to close
this method compares today's close to yesterday's close. so if today's close is above yesterday's close, it's a green day. if today's close is below yesterday's close, it's a red day.
FYI – when you hear people on CNBC say "TSLA is up 5.75%" this is the method they use to measure performance. it's always from the previous session's close because it accounts for overnight gaps.
YM stats using previous close to close:
- 81% green day after previous high broken
- 66% red day after previous low broken
open to close
this method compares today's open to today's close. if the close is above the open, it's green. if the close is below the open, it's red.
YM stats using open to close:
- 67% green day after previous high broken
- 62% red day after previous low broken
this method is typically preferred by day traders who are more focused on intraday moves and don't want overnight gaps affecting their calculations.
why previous close to close is stronger
the stats speak for themselves — previous close to close gives you 81% and 66% probabilities vs. 67% and 62% with open to close. that difference might not sound like much, but over hundreds of trades, it adds up.
this makes the previous day's range one of the most reliable support resistance levels trading indicators when used correctly.
how to use previous day's range for session bias
here's the mindset shift you need to make: stop thinking of previous day's high and low as reversal areas and start thinking of them as session bias indicators with extremely high probabilities.
when price breaks previous day's high, the data is telling you there's a 81% chance the session will close green. this means you should have a bullish bias for the rest of the session, not expect a reversal back down.
similarly, when price breaks previous day's low, there's a 66% chance the session will close red — giving you a clear bearish bias.
this is perfect for determining your trading approach for the entire session. if you're looking to go short after previous day's high has broken, you're fighting against incredibly strong data.
this is exactly the type of data-backed decision making that separates profitable traders from everyone else — and it's why I've been emphasizing the importance of risk management frameworks in trading.
the "by outside close" subreport for even stronger bias confirmation
the standard previous day's range report tells you if the session will close green or red after a break. but the "by outside close" subreport goes one step further — it tells you the probability of closing above or below the actual level that was broken.
YM stats for "by outside close":
- 56% of days close above previous high when previous high is broken
- 56% of days close below previous low when previous low is broken
while these aren't the highest probabilities — this report is a good one to track to see if the data improves. this report isn't just about the session being green or red — it's about whether price will actually close above the level that was broken, confirming the strength of the move.
this is crucial because closing above the broken level shows true follow-through, not just a barely green close that might have been influenced by other factors.
weekday variations that change everything
quick reminder that like every edgeful report, these previous day's range stats change dramatically by day of the week.
check out the data for Thursdays:
- when the previous day's high is broken, price closes green 64% of the time
- when the previous day's low is broken, price closes red 67% of the time
compare that to Friday's data:
- when the previous day's high is broken, price closes green 89% of the time
- when the previous day's low is broken, price closes red 77% of the time
always check the "by weekday" subreport before trading any setup — some days might give you massive confidence while others aren't worth trading. this is similar to the market environment changes I discussed in my analysis of changing market conditions.
step-by-step trading application
here's how to actually use the previous day's range report in your daily trading:
step 1: mark previous day's NY session high and low on your charts (use the edgeful "previous day's range by session" TradingView indicator)
step 2: wait for price to break one of these levels during the current session
step 3: instead of looking for reversals, establish your session bias based on the probabilities for your desired ticker
step 4: avoid trading against this bias — if previous day's high breaks, be cautious about shorts. and if previous day's low breaks, be cautious about longs
step 5: combine with inside bars and OCC reports for maximum confidence in your bias
the key is changing your mindset from "break = reversal opportunity" to "break = clear session bias signal."
this approach works particularly well when combined with other reports in what I call the ultimate bullish setup strategy.
key takeaways
the previous day's range report isn't about finding reversal levels — it's about determining session bias with remarkable accuracy:
- breaks of previous day's high/low signal green/red close probabilities of 67%/62%, not reversals
- previous close to close calculation gives stronger probabilities than open to close
- use these levels as session bias indicators, not reversal areas
- the "by outside close" subreport shows probabilities of closing above/below the broken level
- always check weekday variations for maximum edge
- combine with other reports for even stronger confirmation
stop thinking of the previous day's high & low as resistance and support. start thinking of them as data-backed bias levels that tell you the most likely direction for the close.
frequently asked questions
what is the previous day's range report?
the previous day's range report tracks what happens after price breaks the previous session's high or low, measuring how often the current session closes green or red based on these breaks. it's one of the most reliable day trading session bias indicators available.
how accurate is the previous day's range for predicting session direction?
on YM, the previous day's range shows 67% accuracy for green closes when the previous high breaks, and 62% accuracy for red closes when the previous low breaks. using the previous close to close method increases these probabilities to 81% and 66% respectively.
should I use previous day's range as support and resistance levels?
no — this is the biggest mistake traders make. the previous day's range should be used as session bias indicators, not support resistance levels trading signals. the data shows continuation, not reversal, after these levels break.
what's the difference between the two calculation methods?
previous close to close compares today's close to yesterday's close (stronger probabilities), while open to close compares today's close to today's open. futures traders typically prefer previous close to close as it accounts for overnight gaps and provides higher accuracy rates.
ready to start using data-backed session bias instead of guessing? the previous day's range report is available in your edgeful dashboard, along with all the customization options we covered today.
want to master data-driven trading strategies like this? join over 15,000 traders who receive our weekly stay sharp newsletter with actionable trading insights delivered every saturday morning.