how to use Average True Range (ATR) to set precise targets and find high probability reversal trades
what is Average True Range and why should traders care?
Average True Range (ATR) is one of the most underutilized indicators in trading. most traders know it exists, but few apply it effectively in their daily decision-making.
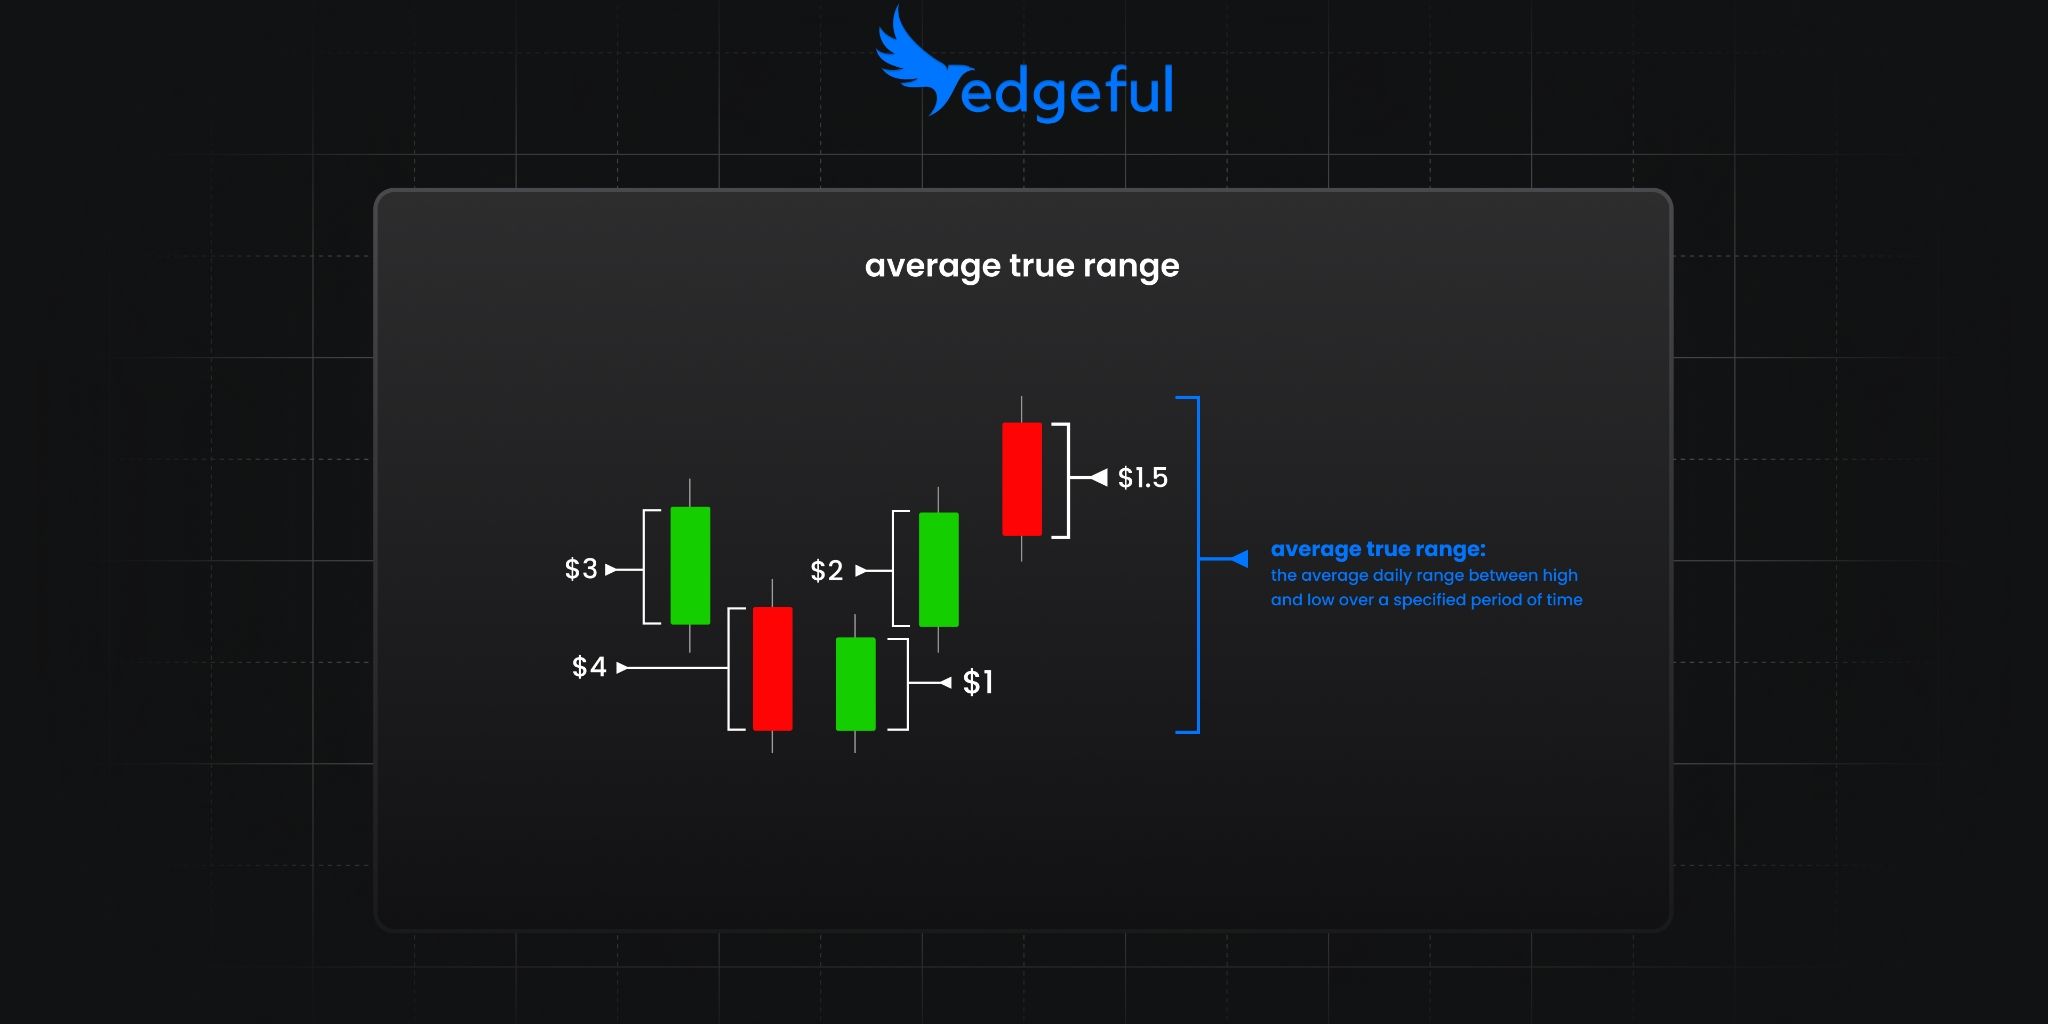
at its core, ATR is a measure of a stock's average high-to-low range over a specified period. it gives you a clear picture of a ticker's typical daily volatility and allows you to do two critical things:
- set better profit targets based on where price is likely to go
- find better entries, especially near high of day (HOD) or low of day (LOD) reversals
in this post, we'll look at how you can apply ATR to make more informed trading decisions, based on actual statistics rather than guesswork or emotion.
the statistics behind ATR: what the data tells us
before diving into examples, let's examine what our ATR report reveals about a popular trading instrument - the QQQ (nasdaq-100 etf).
looking at the standard ATR report over the past 6 months:
here's the breakdown:
- QQQ has a 14-day ATR of $7.24
- over the past 6 months, QQQ respects the 14-day ATR 77% of the time
- over the past 6 months, QQQ exceeds the 14-day ATR only 22.83% of the time
this means that more than two-thirds of the time, QQQ's daily range stays within its 14-day ATR. this data immediately gives you an edge by helping you set realistic expectations for daily movement.
the day of the week effect on ATR
taking our analysis a step further, we can examine how the day of the week impacts ATR behavior. you can select the "by weekday" ATR subreport by using drop down #6 on the left side of your edgeful dashboard.
the differences are striking.
Mondays:
- QQQ respects its 14-day ATR 92% of the time
- QQQ exceeds its 14-day ATR only 8% of the time
Thursdays
- QQQ respects its 14-day ATR 62.5% of the time
- QQQ exceeds its 14-day ATR 28% of the time
that's a 30% difference between Monday and Thursday! this kind of day-specific information can significantly impact your trading decisions, position sizing, and target setting strategy.
how to apply ATR in real-world trading situations
due to how rarely a move outside of the 14-day ATR occurs on major tickers like QQQ, we'll focus on how to effectively trade within the range.
trading ranges comes down to two core principles:
- buying weakness/support
- selling strength/resistance
let's examine three real examples to make these principles tangible:
example 1: QQQ from December 16, 2024
key observations:
- within the first hour, QQQ had already traded 94% of the day's ATR
- with most of the expected range already covered, we can begin looking for reversal signs as the high and low are likely established
- after price stabilizes post-selling, we see 4 higher lows before breaking the trendline
- two hours later, price builds a reversal flag pattern, offering a controlled risk entry for a move back to the upside (targets being HOD or multiples of your risk)
by letting the volatile open price action settle, we can apply ATR effectively, making an educated guess that the day's extremes are in place.
example 2: QQQ from November 27, 2024
key observations:
- price trades 95% of ATR by 12PM after a major selloff
- trendline break allows for entry, with stops below LOD (or outside of ATR)
- this setup resulted in at least a 2R trade by close
- while complete reversals on heavy selling days may not be the most probable outcome, partial retracements offer excellent risk-reward opportunities
example 3: QQQ from November 24, 2024
key observations:
- the day's bias is bullish due to strength on open
- consolidation from 11:30AM-1PM ET provides a trendline entry opportunity
- targets are now within the ATR range, expecting that the low at 9:35AM is LOD
- price gets within $0.05 of the full ATR range, nearly perfectly hitting the take profit level
important note: in real time, you don't actually know the day's high or low in advance. by sitting back and letting price develop while analyzing your ticker's ATR, you can make an educated guess that the day's extremes have been established when price trades approximately 80%+ of the ATR.
setting effective profit targets & finding reversal trades using ATR
the examples above demonstrate how powerful ATR can be for setting realistic profit targets and identifying potential reversal points.
in each case, QQQ traded a significant portion of its ATR (80-95%) within the first few hours of the session. this gave us strong indication that the day's high and low were likely in place.
from there, we could confidently:
- set profit targets and stop loss orders within the established ATR range, knowing price was unlikely to exceed those levels
- look for reversal setups as price approached the extremes of the range, with the expectation that it would struggle to break through
this approach allows you to trade with the odds in your favor, rather than hoping for an unlikely breakout or holding onto a position in a ticker that has already made its expected move for the day.
why this approach works: the psychology behind ATR
ATR works as a reliable guide because it captures the essence of market volatility and participant behavior. on most days, markets tend to respect their typical ranges because:
- institutional traders use similar volatility measures to set their own targets
- algorithmic trading often incorporates volatility filters that limit extended moves
- mean reversion is a powerful force in markets, especially on an intraday basis
by aligning your expectations with these market realities, you position yourself to trade with greater precision and confidence.
putting it all together: your ATR trading framework
by combining data from ATR reports with real-time price analysis, you can set smarter profit targets and catch high-probability reversals without relying on emotions.
here's a quick recap of the process:
- check the standard ATR report to gauge the likelihood of price respecting the range
- review the ATR report by weekday to identify any day-specific tendencies
- monitor price action in the first few hours to see how much of the ATR has been traded
- once a significant portion (80%+) of the ATR is reached, assume the day's high and low are likely set
- target profits within the established range and watch for reversal setups at the extremes
with practice, this approach will become second nature, and you'll find yourself trading with more confidence and better precision.
your 3-step ATR action plan
you're now ready to put ATR to work in your trading. here's your simplified action plan:
- identify the standard and day-specific ATR levels for your favorite tickers
- start each trading day by noting these key levels and watching how quickly price approaches them
- as price develops, use the ATR framework to guide your target placement and look for reversal setups
the more you integrate ATR into your process, the more natural it will feel—and the more effective your trading will become.
fine-tuning your approach
keep in mind that the lookback period used to calculate ATR can significantly impact your results. in the examples above, we used a 14-day ATR calculation period, but you may find that shorter or longer periods work better for your specific trading style and timeframe.
experiment with different lookback periods to find what works best for your approach, whether you're a scalper, day trader, or swing trader.
want to access ATR reports and analytics for your favorite trading instruments? explore our trading platform to start trading with data-backed precision.
p.s. all examples in this post use a 14-day calculation period for ATR. changing this lookback period can significantly affect the results, so we recommend experimenting to find what fits your trading style best.