volume weighted average price (VWAP): definition, formula, and trading strategies
volume weighted average price is one of the most popular indicators I see beginner traders asking about. and for good reason... it's straightforward, it's on every platform, and institutions actually use it.
here's how VWAP works, when it's useful, and how to avoid the common mistakes that trip up most traders when they first start using it.
table of contents
- what is volume weighted average price (VWAP)?
- how is VWAP calculated? (formula and inputs)
- VWAP example: step-by-step calculation
- how to use VWAP in the market
- why VWAP matters: benefits and limitations
- VWAP vs twap vs moving averages
- anchored VWAP vs session VWAP
- common VWAP mistakes and how to avoid them
- frequently asked questions
- key takeaways
what is volume weighted average price (VWAP)?
volume weighted average price (VWAP) is a trading indicator that shows the average price of a security based on both price AND volume. unlike simple moving averages that only consider price, VWAP gives more weight to price levels where more volume traded.
here's the thing... VWAP represents the "fair value" of an asset during a specific time period. when price is above VWAP, buyers are in control. when price is below VWAP, sellers have the edge.
institutional traders use VWAP as their benchmark for execution quality. if they can buy below VWAP or sell above VWAP, they consider it a good fill. that's why VWAP often acts as dynamic support and resistance throughout the trading session.
why VWAP resets daily
VWAP typically resets at the beginning of each trading session because it calculates a volume-weighted average from the session start. this daily reset makes it particularly useful for intraday trading strategies, which is why you'll see VWAP being most effective on timeframes from 1-minute to 60-minute charts.
how is VWAP calculated? (formula and inputs)
the VWAP formula might look intimidating at first, but it's actually pretty straightforward once you break it down.
VWAP formula
VWAP = Σ(Typical Price × Volume) / Σ(Volume)
where:
- typical price = (high + low + close) / 3
- Σ = sum of all periods from session start
inputs and session settings
the calculation requires three key inputs:
price data: most platforms use the typical price (HLC/3), though some use just the close price. the typical price is generally preferred because it captures the full price action of each period.
volume data: actual shares or contracts traded during each time period. this is what gives VWAP its "weighted" characteristic.
session definition: when does VWAP reset? common options include:
- regular trading hours only (9:30am-4:00pm ET for stocks)
- extended hours included (pre-market and after-hours)
- 24-hour sessions (for futures and forex)
calculation steps (intraday reset vs multi-session)
here's how VWAP builds throughout the trading day:
- period 1: calculate typical price × volume, store both values
- period 2: add new (typical price × volume) to running total, add new volume to running total
- period 3: continue accumulating both totals
- current VWAP: divide cumulative (typical price × volume) by cumulative volume
the key difference between session VWAP and anchored VWAP is when this calculation resets. session VWAP resets daily, while anchored VWAP continues from a specific point in time that you choose.
how to use VWAP in the market
now that you understand what VWAP is and how it's calculated, let's talk about the practical applications that actually make money in live markets.
trend confirmation above/below VWAP
the simplest VWAP strategy is using it as a trend filter. when price is consistently above VWAP, you want to focus on long setups. when price is consistently below VWAP, you're looking for short opportunities.
here's what I've learned from working with thousands of traders: don't just look at where price is relative to VWAP right now... look at the slope of VWAP itself. rising VWAP suggests ongoing buying pressure throughout the session. falling VWAP indicates persistent selling.
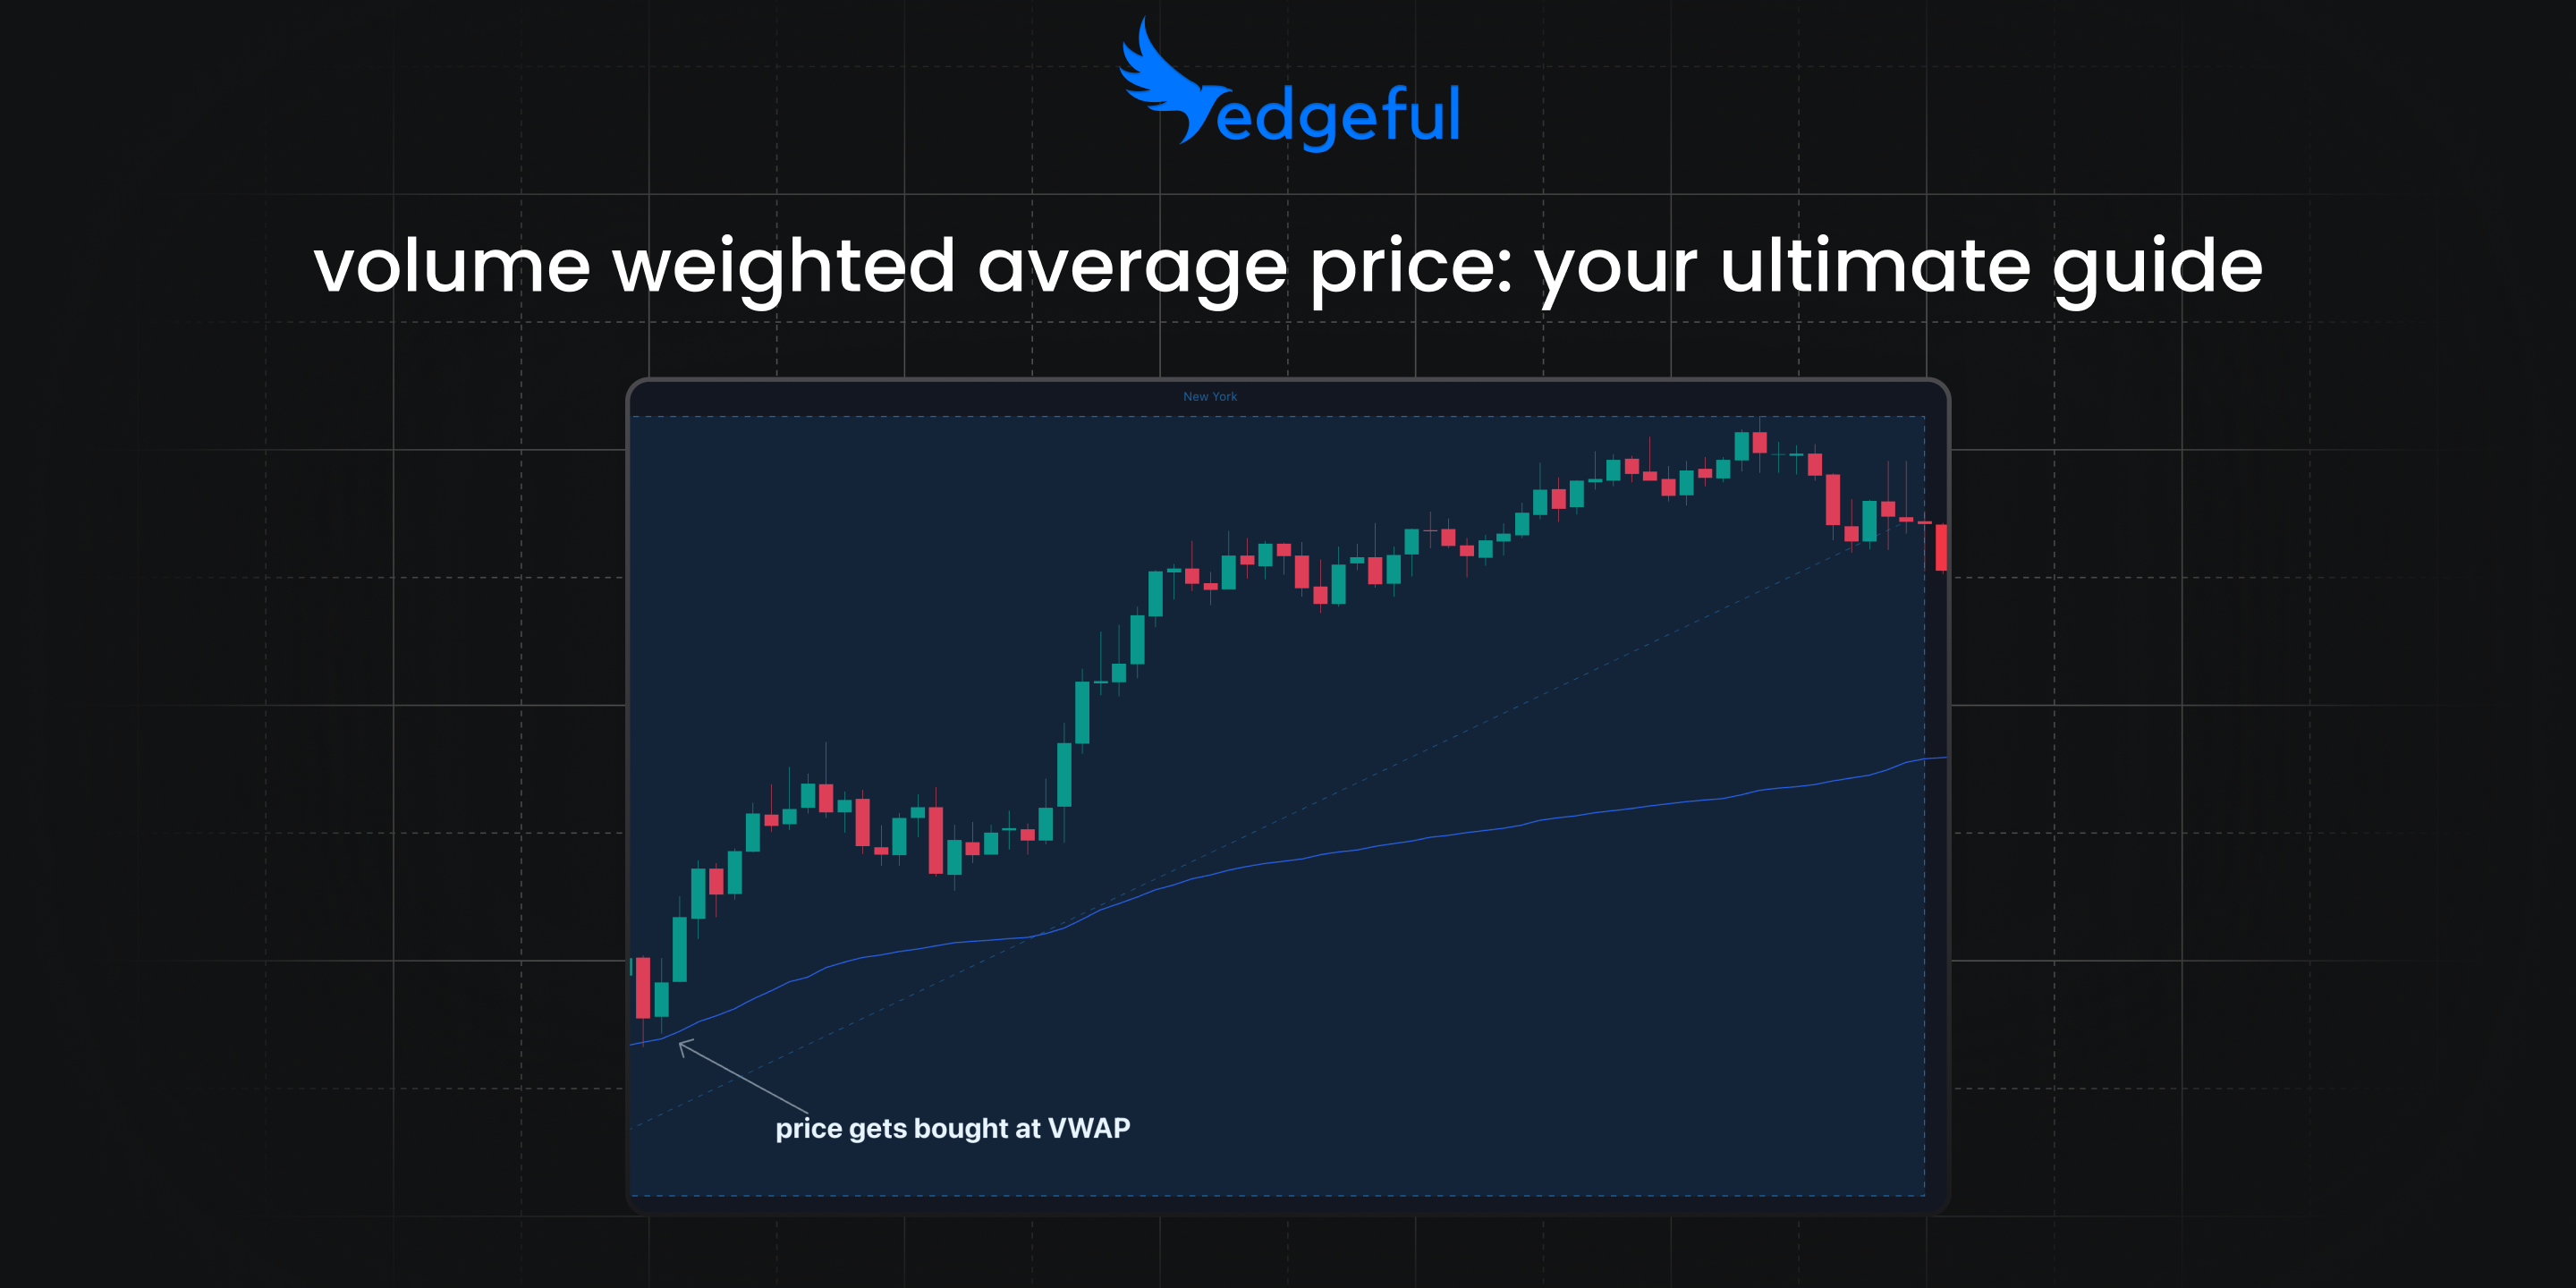
dynamic support and resistance at VWAP
VWAP acts as dynamic support and resistance because it represents institutional fair value. large traders who bought above VWAP are underwater, creating potential selling pressure. those who sold below VWAP are underwater on their shorts, creating potential buying pressure.
this is why you'll often see price bounce off VWAP multiple times during a trading session. it's not magic... it's math. institutions are using VWAP as their benchmark, creating natural buy and sell zones.
mean reversion and pullback entries
one of my favorite VWAP strategies involves waiting for price to deviate significantly from VWAP, then looking for entries back toward the mean. this works particularly well in range-bound markets where price tends to oscillate around fair value.
the key is defining "significantly" with actual data, not gut feeling. some traders use a fixed dollar amount (like $2 away from VWAP on ES), while others prefer percentage-based thresholds.
VWAP bands and standard deviations
many platforms offer VWAP bands, which are just standard deviations plotted above and below the VWAP line. these bands help identify when price is at extremes relative to volume-weighted fair value.
when price hits the upper band, it might be overbought on a volume-adjusted basis. when it hits the lower band, it could be oversold. but remember... trends can persist longer than you think, so don't automatically fade these levels without additional confirmation.
instrument-specific notes (stocks, futures, crypto)
VWAP behaves differently across asset classes:
stocks: VWAP works best on liquid names with consistent volume patterns. avoid using it on low-volume stocks where a single large trade can skew the calculation.
futures: since futures trade nearly 24/7, you need to decide which session's VWAP matters most. for ES, many traders focus on RTH (regular trading hours) VWAP rather than globex.
crypto: with 24/7 trading, traditional session-based VWAP is less meaningful. consider using anchored VWAP tied to specific events or time periods instead.
why VWAP matters: benefits and limitations
let's be honest about what VWAP can and can't do for your trading. after years of watching traders use (and misuse) this indicator, here are the real pros and cons.
benefits of using VWAP
objective reference point: VWAP eliminates guesswork about fair value. instead of wondering if a stock is "expensive" or "cheap," you have a volume-weighted average that accounts for actual trading activity.
institutional relevance: since many large traders benchmark their executions against VWAP, it tends to be a self-fulfilling prophecy as support and resistance.
works across timeframes: whether you're scalping 1-minute charts or swing trading daily charts, VWAP provides consistent reference levels.
combines price and volume: unlike moving averages that only consider price, VWAP incorporates the volume component, giving you a more complete picture of market activity.
limitations and common misconceptions
intraday only: traditional session VWAP resets daily, making it less useful for swing trading or position trading strategies.
lagging indicator: VWAP is calculated from historical data, so it can't predict future price movements. it tells you where fair value WAS, not where it's going.
volume dependency: in low-volume periods, VWAP can be less reliable because a few large trades can skew the entire calculation.
not a crystal ball: many new traders think VWAP guarantees price will return to the line. that's not how markets work. VWAP shows you fair value, but price can stay away from fair value longer than you expect.
the biggest mistake I see is traders treating VWAP like a magic line that price must respect. it's a tool, not a trading system by itself.
VWAP vs twap vs moving averages
understanding the differences between these price indicators will help you choose the right tool for your specific trading situation.
VWAP vs twap (benchmarking vs execution)
VWAP (volume weighted average price): weights each price by the volume traded at that level. gives more importance to prices where actual business was conducted.
TWAP (time weighted average price): simply averages prices over time without considering volume. treats every time period equally regardless of trading activity.
when to use each:
- VWAP: when you care about the price level where most volume occurred
- TWAP:: when you want a simple average price over time without volume bias
institutions often use VWAP for benchmarking (did we get a good price?) and TWAP for execution (spread our orders evenly over time).
VWAP vs sma/ema (differences in weighting and lag)
simple moving average (SMA): averages closing prices over a set number of periods. treats each period equally.
exponential moving average (EMA): gives more weight to recent prices, making it more responsive to current market conditions.
VWAP: weights prices by volume AND time, resetting at each session.
the key difference is that VWAP considers actual trading volume, while traditional moving averages only look at price. this makes VWAP more representative of where institutional money actually changed hands.
when each measure excels
use VWAP when:
- trading intraday strategies
- looking for institutional fair value
- needing dynamic support/resistance levels
- volume patterns matter to your strategy
use moving averages when:
- swing trading or position trading
- analyzing longer-term trends
- volume data is unreliable or unavailable
- you need consistent levels that don't reset daily
use TWAP when:
- implementing algorithmic execution strategies
- needing simple time-based averages
- volume weighting isn't relevant to your analysis
anchored VWAP vs session VWAP
while standard VWAP resets at each session, anchored VWAP starts from a specific point you choose and continues calculating from there. this creates some powerful trading applications.
when to anchor (events, breakouts, gaps)
the most effective anchored VWAP setups start from significant market events:
earnings releases: anchor VWAP from the first bar after earnings to see how price trades relative to the post-earnings fair value.
breakouts: anchor from a significant breakout candle to track whether the move is sustainable or just noise.
gap opens: anchor from the gap open to see if the gap fills or if price continues in the gap direction.
high/low breaks: anchor from when price breaks a key support or resistance level to gauge the strength of the move.
the key is choosing anchor points that represent meaningful shifts in market structure, not random price levels.
parameter choices and data windows
when setting up anchored VWAP, you need to decide:
anchor point: the exact bar where calculation begins session inclusion: do you include overnight/extended hours data? time limit: some traders set maximum lookback periods to prevent very old data from skewing current levels
the longer your anchor period, the more data points VWAP includes, making it less responsive to recent price action. shorter anchor periods make VWAP more sensitive to current trading activity.
if you're serious about using VWAP in your trading, having the right indicators matters. our top tradingview indicators for futures trading includes several VWAP variations that work seamlessly with popular platforms.
common VWAP mistakes and how to avoid them
after watching thousands of traders implement VWAP strategies, I've seen the same mistakes over and over. here's how to avoid the most common pitfalls.
mistake #1: treating VWAP as support/resistance 100% of the time
many traders assume price will always bounce off VWAP like it's a concrete wall. that's not how markets work. VWAP is a reference level, not a guarantee.
solution: use VWAP as one factor in your analysis, not the only factor. look for additional confirmation before entering trades based solely on VWAP interaction.
mistake #2: using wrong session settings
trading futures but using stock market hours for VWAP calculation. or including overnight session data when your strategy focuses on regular trading hours only.
solution: match your VWAP session settings to your actual trading time frame. if you only trade RTH, use RTH VWAP. if you trade around the clock, use 24-hour VWAP.
mistake #3: ignoring volume context
using VWAP on low-volume instruments where a single large trade can completely skew the calculation. or treating holiday/low-volume VWAP the same as normal session VWAP.
solution: pay attention to volume patterns. if today's volume is significantly different from normal, VWAP might not be as reliable.
mistake #4: over-relying on VWAP in trending markets
expecting mean reversion to VWAP when price is in a strong trending phase. trends can persist much longer than VWAP suggests they should.
solution: combine VWAP analysis with trend identification. in strong trends, VWAP works better as a trailing reference than a reversal signal.
mistake #5: not adjusting for different market conditions
using the same VWAP strategy in range-bound markets and trending markets. what works in consolidation often fails in breakouts.
solution: adapt your VWAP approach based on current market environment. mean reversion strategies work better in ranges, while trend-following approaches work better in directional markets.
the key is understanding that VWAP is a tool, not a complete trading system. it works best when combined with proper market analysis and risk management.
speaking of proper analysis, understanding market structure is crucial for VWAP success. our opening range breakout (orb) trading strategy explains how VWAP interacts with key support and resistance levels during the most volatile part of the trading session.
frequently asked questions
what is volume weighted average price and how does it work?
volume weighted average price (VWAP) is a trading indicator that calculates the average price of a security based on both price and volume. it works by multiplying each price by its corresponding volume, summing those values, and dividing by total volume. this gives more weight to prices where more trading activity occurred, making it more representative of true market value than simple price averages.
how do you calculate VWAP step by step?
to calculate VWAP: 1) multiply each period's typical price (high+low+close)/3 by its volume, 2) sum all these price×volume values from session start, 3) sum all volume from session start, 4) divide cumulative price×volume by cumulative volume. the calculation continues throughout the session, with each new period adding to the running totals.
is VWAP a good indicator for intraday trading?
yes, VWAP is excellent for intraday trading because it resets at each session and represents institutional fair value. many large traders benchmark their executions against VWAP, making it a self-fulfilling prophecy for support and resistance. however, it works best on liquid instruments with consistent volume patterns and should be combined with other analysis techniques.
VWAP vs TWAP: when should each be used?
use VWAP when volume matters to your analysis - it shows where most trading activity occurred and is better for benchmarking trade quality. use TWAP when you need a simple time-based average without volume bias - it's better for algorithmic execution strategies that spread orders evenly over time. VWAP is generally preferred for discretionary trading strategies.
how does anchored VWAP compare to session VWAP?
session VWAP resets daily at the start of each trading session, making it ideal for intraday strategies. anchored VWAP starts from a specific event or time you choose and continues calculating from there, making it better for analyzing price action relative to breakouts, earnings, or other significant market events. anchored VWAP doesn't reset automatically.
key takeaways
here's what you need to remember about volume weighted average price:
- VWAP represents volume-weighted fair value, giving more importance to prices where actual trading occurred
- the formula is cumulative (price × volume) divided by cumulative volume, resetting at each session
- price above VWAP suggests buyer control, while price below VWAP indicates seller pressure
- VWAP works as dynamic support and resistance because institutions use it as an execution benchmark
- session VWAP resets daily, while anchored VWAP continues from specific events or breakouts
- combine VWAP with other analysis - it's a reference tool, not a complete trading system
- match your VWAP settings to your actual trading timeframe and session preferences
- works best on liquid instruments with consistent volume patterns
VWAP isn't a magic indicator that guarantees profits, but it's one of the most reliable reference points available to intraday traders. when you understand what it represents and how institutions use it, you can incorporate it effectively into your trading strategy.
the real power comes from combining VWAP with proper market structure analysis and risk management. if you're looking to implement systematic approaches that work with VWAP, check out our what's in play trading feature that identifies high-probability setups in real-time.
remember... successful trading isn't about finding the perfect indicator. it's about understanding market dynamics and using tools like VWAP to make more informed decisions based on actual data, not emotions.