green & red streaks

auto-plots consecutive up and down closes on daily, weekly, or monthly timeframes to spot momentum and exhaustion.

futures
forex
crypto
stocks

information

green & red streaks|edgeful.com

what it does

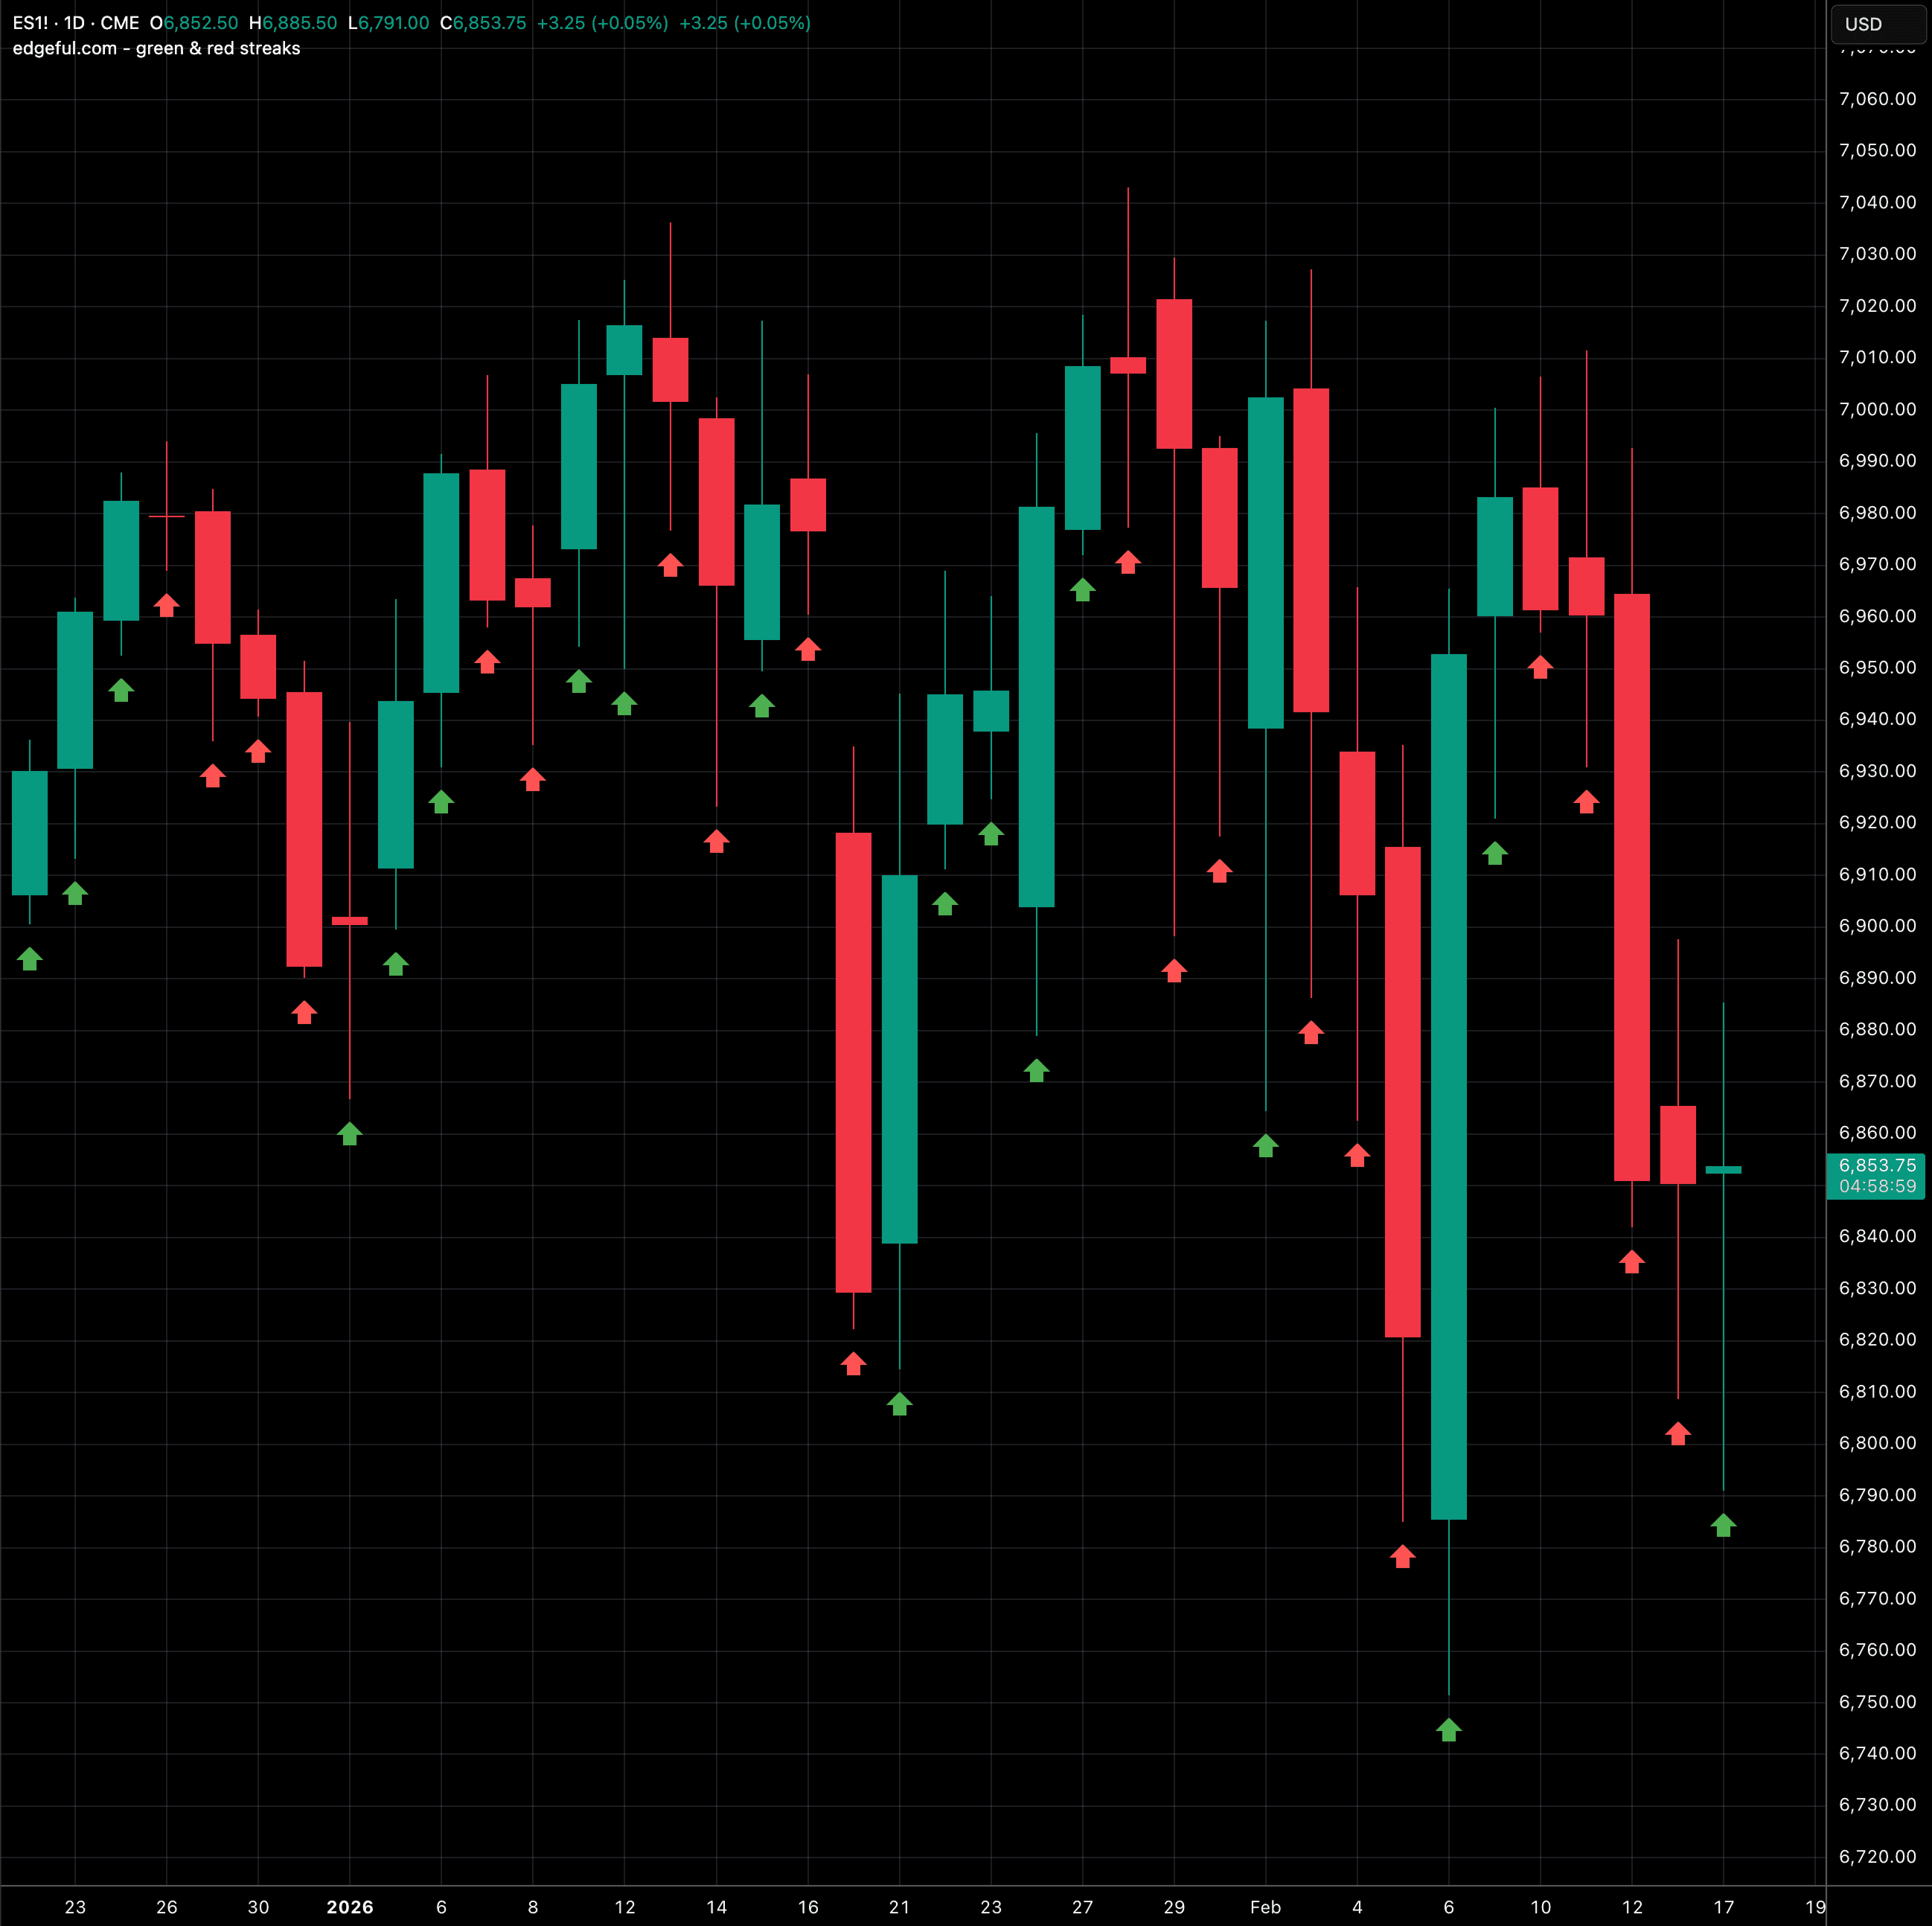
this indicator compares the current close to the previous period's close on daily, weekly, or monthly timeframes. green arrows indicate the period closed higher than the prior period; red arrows indicate it closed lower.

the visual representation makes it easy to identify streaks of consecutive up or down days/weeks/months, useful for identifying overextended moves or momentum continuation patterns.

key features

works on daily, weekly, and monthly timeframes

green arrow for closes above previous period

red arrow for closes below previous period

visual streak identification

historical lookback configuration

explainer chart

green & red streaks|edgeful.com

green & red streaks

all of this for $49

less than the cost of one bad trade.

★★★★★ 4.5/5 TrustPilot

real data, every Saturday.
free forever.

follow us on social media

copyright © 2026 edgeful. all rights reserved.

risk disclosure: futures and forex trading contains substantial risk and is not for every investor. an investor could potentially lose all or more than the initial investment. risk capital is money that can be lost without jeopardizing ones' financial security or life style. only risk capital should be used for trading and only those with sufficient risk capital should consider trading. past performance is not necessarily indicative of future results. testimonials appearing on this website may not be representative of other clients or customers and is not a guarantee of future performance or success.