
choppy market or trend day: the early data points to check
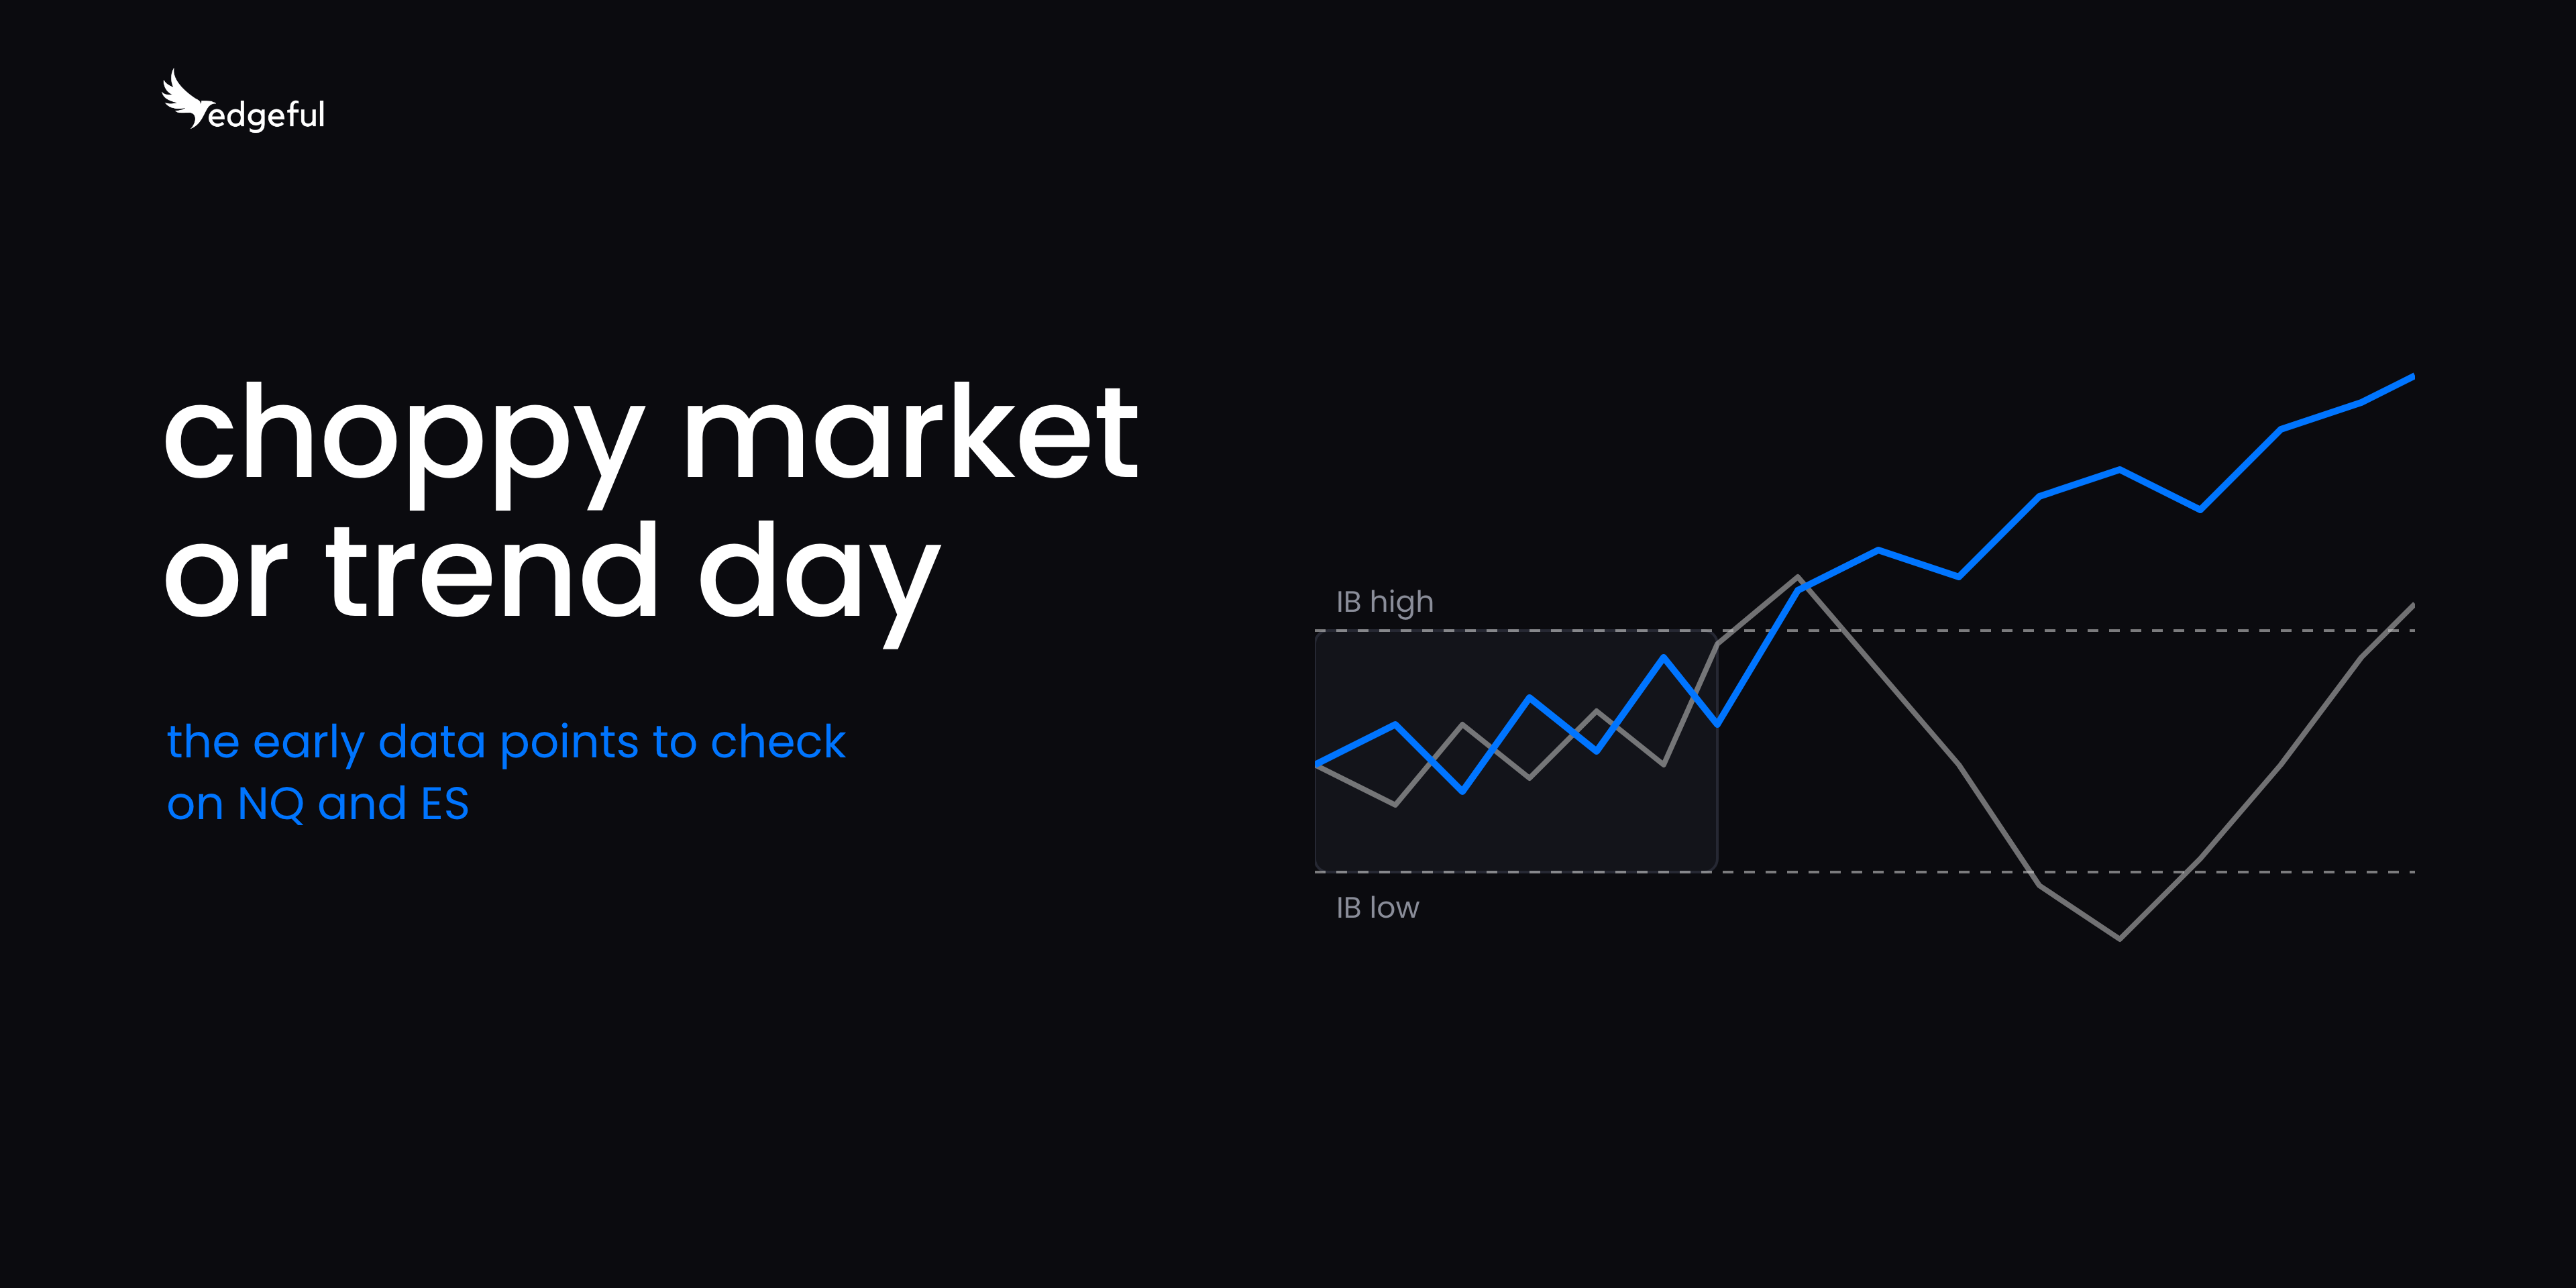
you can't tell at the open whether the day will trend or turn into a choppy market, but by 10:30 AM ET you have the opening candle color and the initial balance (IB) levels, and the first IB break comes after that. according to edgeful data, over the last 6 months of NY sessions (May 14 to Nov 13, 2026), once NQ broke one side of its first-hour IB, it didn't break the other side for the rest of the session on 86.0% of those days (104 of 121).
traders describe the problem in their own words: "my biggest challenge is determining the actual bias" and "I come to sessions well prepared but struggle to adapt when market dynamics change."
table of contents
- what is a choppy market?
- what is the initial balance in futures trading?
- how often is NQ a one-way day vs a choppy market?
- what does the opening candle say about the rest of the day?
- how does the overnight session affect the NY session?
- what is an inside day and what happens the next day?
- how to identify a trend day or a choppy market early: 5 steps
- key takeaways
what is a choppy market?
a choppy market is a session where price breaks out in one direction, then turns and breaks the other way, without holding a direction for long. a trend day is the opposite of a choppy market: price moves one way and keeps going.
edgeful data doesn't label a day "trend" or "chop." the closest measure is the IB by double break report, which records whether a session broke one side of the initial balance or both. a one-way day broke one side only. a two-way day broke both sides, which is the closest match in the data to a chop day.
you only know whether a day was one-way or a choppy market at the close, because the other side can break at 3:45 PM ET. what you know during the session is which side broke first.
every number here covers the NY session (New York, 9:30 AM to 4:00 PM eastern time, ET) on NQ (Nasdaq-100 E-mini futures) and ES (S&P 500 E-mini futures).
what is the initial balance in futures trading?
the initial balance is the high and low of the first hour of the NY session, from 9:30 to 10:30 AM ET. once 10:30 hits, those 2 levels are set for the day.
the IB report tracks how often price does one of these:
- breaks above the IB high (a breakout)
- breaks below the IB low (a breakdown)
- breaks both
- breaks neither
a session that breaks both the IB high and the IB low is the closest measure of a choppy market in edgeful data. the IB window is customizable from 5 minutes to 3 hours in 5-minute steps, plus 4 hours, and the default is 1 hour. the IB numbers below use the 1-hour IB with a wick break, which means any touch past the level counts.
if you want the full setup, our post on the initial balance breakout strategy walks through how traders use the IB levels.
how often is NQ a one-way day vs a choppy market?
measured by the IB, on NQ over the last 6 months the IB broke one side only on 78.8% of NY sessions (104 of 132), both sides on 12.9% (17 of 132), and neither side on 8.3% (11 of 132).
here's the NQ breakdown by the first break, which is the part you know during the session:
- the IB high broke first on 53.0% of sessions (70 of 132)
- didn't break the IB low later: 87.1% (61 of 70)
- broke the IB low later (a two-way day): 12.9% (9 of 70)
- the IB low broke first on 38.6% of sessions (51 of 132)
- didn't break the IB high later: 84.3% (43 of 51)
- broke the IB high later (a two-way day): 15.7% (8 of 51)
ES had more two-way days in the same window, so a choppy market by this measure showed up more often on ES. the IB broke one side only on 71.2% of ES NY sessions (94 of 132), both sides on 22.7% (30 of 132), and neither on 6.1% (8 of 132).
- the IB high broke first on 50.0% of ES sessions (66 of 132)
- didn't break the IB low later: 78.8% (52 of 66)
- broke the IB low later: 21.2% (14 of 66)
- the IB low broke first on 43.9% of ES sessions (58 of 132)
- didn't break the IB high later: 72.4% (42 of 58)
- broke the IB high later: 27.6% (16 of 58)
data: edgeful initial balance breakout report, by double break subreport, NQ and ES, NY session (9:30 AM to 4:00 PM ET), 60-minute IB, 5-minute candles, wick breaks, May 14 to Nov 13, 2026, 132 sessions each (includes 4 shortened holiday sessions), pulled Nov 16, 2026.
the report records which side broke first and whether the other side broke later. it doesn't record the time of either break, so it can't tell you how late the second break came.
on NQ NY sessions over the last 6 months, the other side broke after the first break on 14.0% of sessions that broke a side (17 of 121). on ES it was 24.2% (30 of 124).
what does the opening candle say about the rest of the day?
on NQ over the last 6 months, the NY session closed the same color as its first 60-minute candle on 78.0% of sessions (103 of 132).
split by color:
- green opening candle (closed above its 9:30 open at 10:30 AM ET): 51.5% of sessions (68 of 132)
- the session closed green: 73.5% (50 of 68)
- red opening candle: 48.5% of sessions (64 of 132)
- the session closed red: 82.8% (53 of 64)
the session's close already includes the first hour's move.
data: edgeful opening candle continuation report, NQ, NY session (9:30 AM to 4:00 PM ET), 60-minute opening candle, May 14 to Nov 13, 2026, 132 sessions (includes 4 shortened holiday sessions), pulled Nov 16, 2026.
the opening candle report measures direction, meaning whether the session closed above or below its open. it doesn't measure a choppy market: a session can close green after breaking both sides of the IB.
the opening candle gives you a direction at 10:30 AM ET, and the IB first break comes after that. our post on continuation vs reversal reports covers how the continuation reports fit together.
how does the overnight session affect the NY session?
on ES over the last 6 months, the NY session closed in the same direction as the overnight move on 55.3% of sessions (73 of 132).
in this report, the overnight move is today's 9:30 AM ET open compared with the prior NY session's 4:00 PM ET close. a green overnight means ES opened above the prior close. like the opening candle, it measures direction.
- green overnight: 58.3% of ES sessions (77 of 132)
- the NY session closed green: 53.2% (41 of 77)
- the NY session closed red: 46.8% (36 of 77)
- red overnight: 41.7% of ES sessions (55 of 132)
- the NY session closed red: 58.2% (32 of 55)
- the NY session closed green: 41.8% (23 of 55)
data: edgeful overnight continuation report, ES, NY session open vs prior NY session close, May 14 to Nov 13, 2026, 132 sessions (includes 4 shortened holiday sessions), pulled Nov 16, 2026. the report shows whole percentages; the one-decimal figures here are computed from its counts.
the overnight report also has a by weekday subreport, which splits the 55.3% by day. if you trade ES, check that split before you build a bias from the overnight move alone.
what is an inside day and what happens the next day?
an inside day is a session whose high and low both stay inside the prior session's range. on NQ over the last 6 months, 12.1% of NY sessions were inside days (16 of 132), and on the session after those 16 days, the IB broke both sides on 18.8% (3 of 16), against 12.9% across all 132 NQ NY sessions.
the inside bars report looks at every day that opens inside the prior NY session's range, then tracks what that day did:
- NQ opened inside the prior range on 55.3% of NY sessions (73 of 132)
- touched the prior high only: 39.7% (29 of 73)
- touched the prior low only: 32.9% (24 of 73)
- touched both: 5.5% (4 of 73)
- didn't touch the prior high or the prior low (an inside day): 21.9% (16 of 73)
data: edgeful inside bars report, NQ, NY session (9:30 AM to 4:00 PM ET), prior NY session high and low, May 14 to Nov 13, 2026, 132 sessions, pulled Nov 16, 2026.
the inside bars report doesn't track the day after. to get that, I matched the session after each of the 16 inside days against the IB double break data for the same window:
- the IB broke one side only: 68.8% (11 of 16)
- the IB broke both sides, a two-way day: 18.8% (3 of 16)
- the IB didn't break: 12.5% (2 of 16)
across all 132 NQ NY sessions, those numbers were 78.8%, 12.9%, and 8.3%. 16 sessions is too small to read much into the gap, and 3 of the 16 inside days were shortened holiday sessions (Jun 19, Jul 3, Sep 7). our inside bar pattern post covers how traders use the prior day's high and low on these days.
data: inside day dates from the edgeful inside bars report, next-session results from the edgeful initial balance breakout report by double break, NQ, NY session, 60-minute IB, wick breaks, May 14 to Nov 13, 2026, pulled Nov 16, 2026.
how to identify a trend day or a choppy market early: 5 steps
you build the picture by checking a short list of reports in order, from the open to the first IB break. here's the order:
- at the open, check the overnight move. open the overnight continuation report for your ticker and look at the by weekday subreport. on ES the overall same-direction number was 55.3% over the last 6 months of NY sessions, and the by weekday subreport splits it by day.
- check whether today opened inside yesterday's range. the inside bars report is live on the what's in play dashboard. on NQ over the last 6 months, 55.3% of NY sessions opened inside the prior range, and 21.9% of those never touched the prior high or low.
- at 10:30 AM ET, note the opening candle color. the what's in play dashboard shows the opening candle direction once the first hour closes. on NQ over the last 6 months, the session closed the same color as the opening candle on 78.0% of NY sessions.
- mark the IB high and low, then note which side breaks first. the what's in play IB card shows the IB size, which side has broken, and the extension, and it hides the IB data once both sides have broken. on NQ over the last 6 months, the other side broke after the first break on 14.0% of NY sessions that broke at least one side.
- put it together on the screener. the screener's built-in "daily bias" template runs these reports across 15 tickers, ES and NQ included, in one view:
- opening candle continuation
- IB standard
- IB by rejection
- previous day's range
edgeful AI is trained on 8+ years of verified market data and analyzes all of our 150+ reports in real time. if you name a report in your question, it runs that report, and it can also help with your daily prep.
our post on how to build a trading bias with real-time data covers how the screener and the what's in play dashboard work together.
key takeaways
- you can't call a trend day or a choppy market at the open. by 10:30 AM ET you have the opening candle color and the IB levels, and the IB first break comes after that.
- once NQ broke one side of its first-hour IB, it didn't break the other side on 86.0% of those NY sessions over the last 6 months (104 of 121), so 14.0% broke both sides. on ES it was 75.8% (94 of 124).
- NQ's NY session closed the same color as its 60-minute opening candle on 78.0% of sessions (103 of 132).
- the ES overnight move lined up with the NY session close on 55.3% of sessions (73 of 132), so check the by weekday split before you build a bias on it.
- the NQ NY session after an inside day broke both sides of the IB on 18.8% of the 16 sessions in the window, against 12.9% across all sessions. 16 sessions is too small to read much into the gap.
edgeful provides historical performance data to help traders make informed decisions. this does not constitute financial advice. past performance is not indicative of future results. all trading involves risk. always do your own analysis and manage your risk accordingly.
