
gap down fill data: big ES gaps down filled 19% of the time
according to edgeful data, a gap down on ES in the New York session filled 63% of the time from January to July 2026, and only 38% of the time over the last 6 months. ES gaps up filled 57% of the time in both windows.
I've been tracking the gap fill report for the last couple of weeks, and that shift on ES is big enough to change how you trade the open. this is the whole point of the reports: you see when a setup goes in and out of favor as the market environment changes.
this post covers:
- what a gap down is
- how edgeful measures a gap fill
- the ES data across 3 windows this year
- how the gap size changes the data
- a real example from ES on Tuesday 11/10/26
table of contents
- what is a gap down?
- how the gap fill report measures a gap down
- gap down fill data on ES: 3 windows in 2026
- gap size: big gaps down vs small gaps down on ES
- the half gap on big ES gaps down
- a gap down example: ES on Tuesday 11/10/26
- how to trade a gap down on ES
- how to check the gap size on your own ticker
- common mistakes when trading a gap down
- key takeaways
what is a gap down?
a gap down is when price opens below the previous session's close. on ES, that means the New York session opens at 9:30AM ET below the 4PM ET close from the day before.
the space between the prior close and the open is the gap. if price trades back up to the prior close during the session, the gap filled. if it never gets there, the gap didn't fill.
a gap up is the same thing in the other direction: price opens above the prior close, and the gap fills if price trades back down to it.
gap traders care about this because the prior close is a clear level to trade toward. if you trade toward the fill, the prior close is your target. if you're new to gap trading in general, here's our full gap fill trading strategy guide.
how the gap fill report measures a gap down
edgeful's gap fill report counts every gap up and down in the window you pick, then shows how often price touched the previous session's close in the same session.
a few settings matter for everything in this post:
- session: New York, 9:30AM to 4PM ET. a gap only counts as filled if price touched the prior close inside that window
- fill percentage: 100% by default, which means price has to trade all the way back to the prior close. you can set it to 50% to see how often price filled half the gap
- gap size: the by size subreport splits every gap by its size, as a % of the previous close. you can also set your own range
a 0.1% gap and a 1% gap count the same in the overall data, and they behaved very differently on ES over the last 6 months.
for the full breakdown of the report and all its subreports, see the gap fill report: what it measures and how traders use it.
gap down fill data on ES: 3 windows in 2026
here's how often ES gaps down filled in the New York session, across 3 windows this year:
- January to July (1/5/26 to 7/3/26): 63% of the time (36 of 57)
- April to October (4/6/26 to 10/2/26): 47% (25 of 53)
- last 6 months (5/13/26 to 11/12/26): 38% (21 of 55)
and here's how often ES gaps up filled over the same windows:
- January to July: 57% of the time (41 of 72)
- April to October: 57% (43 of 76)
- last 6 months: 57% (43 of 76)
gaps up filled about the same amount of the time all year. gaps down dropped from 63% to 38%.
my take is that the market has been news driven to the downside recently, and the big gaps down just aren't filling, and the gap size data below shows it.
if you checked the gap fill report on ES earlier this year and haven't looked since, ES gaps down are filling a lot less often now.
gap size: big gaps down vs small gaps down on ES
the gap fill by size report splits every gap by its size, as a % of the previous close. I set a custom range of 0.4% to 1.5% to look at the big gaps.
over the last 6 months on ES (5/13/26 to 11/12/26), New York session:
- gaps down of 0.4% to 1.5% filled 19% of the time (5 of 26)
- gaps up of 0.4% to 1.5% filled 35% of the time (9 of 26)
- gaps down under 0.4% filled 55% of the time (16 of 29)
- gaps up under 0.4% filled 68% of the time (34 of 50)
so when ES gapped down 0.4% or more, the gap filled about 1 in 5 times.
here's the same 6 months split into the report's own gap size buckets, for ES gaps down:
- 0% to 0.19%: filled 60% of the time (12 of 20)
- 0.2% to 0.39%: filled 44% (4 of 9)
- 0.4% to 0.69%: filled 21% (4 of 19)
- 0.7% to 0.99%: filled 33% (1 of 3)
- 1.0% to 1.49%: filled 0% (0 of 4)
the bigger buckets have small samples, which is why I grouped them into one custom range. 0.4% to 1.5% gives you 26 gaps down to work with, and only 5 of them filled.
one more thing on gap size: on ES around 7,500, a 0.4% gap is about 30 points. a 10 point gap on ES is only about 0.13%. that's why the by size subreport uses % of the previous close and not points. the same gap in points means something different when price is at a different level.
if you trade ES gaps down, check the size of the gap at the open before you trade it. the overall 38% mixes small gaps that filled 55% of the time with big gaps that filled 19% of the time.
for the same idea on another ticker, here's how often gaps fill on NQ, by gap size.
the half gap on big ES gaps down
the full fill isn't the only target. if you set the fill percentage to 50%, the report shows how often price traded back to the halfway point of the gap.
over the last 6 months on ES, New York session:
- gaps down of 0.4% to 1.5% filled the half gap 65% of the time (17 of 26)
- gaps down under 0.4% filled the half gap 72% of the time (21 of 29)
on the big gaps down, that's 65% for the half gap vs 19% for the full fill. if you still want to trade a big gap down toward the prior close, the half gap level is the target the data backs.
I wrote a full breakdown of how the setting changes the data in half gaps vs full gaps.
a gap down example: ES on Tuesday 11/10/26
a great example of all of this happened on Tuesday 11/10/26.
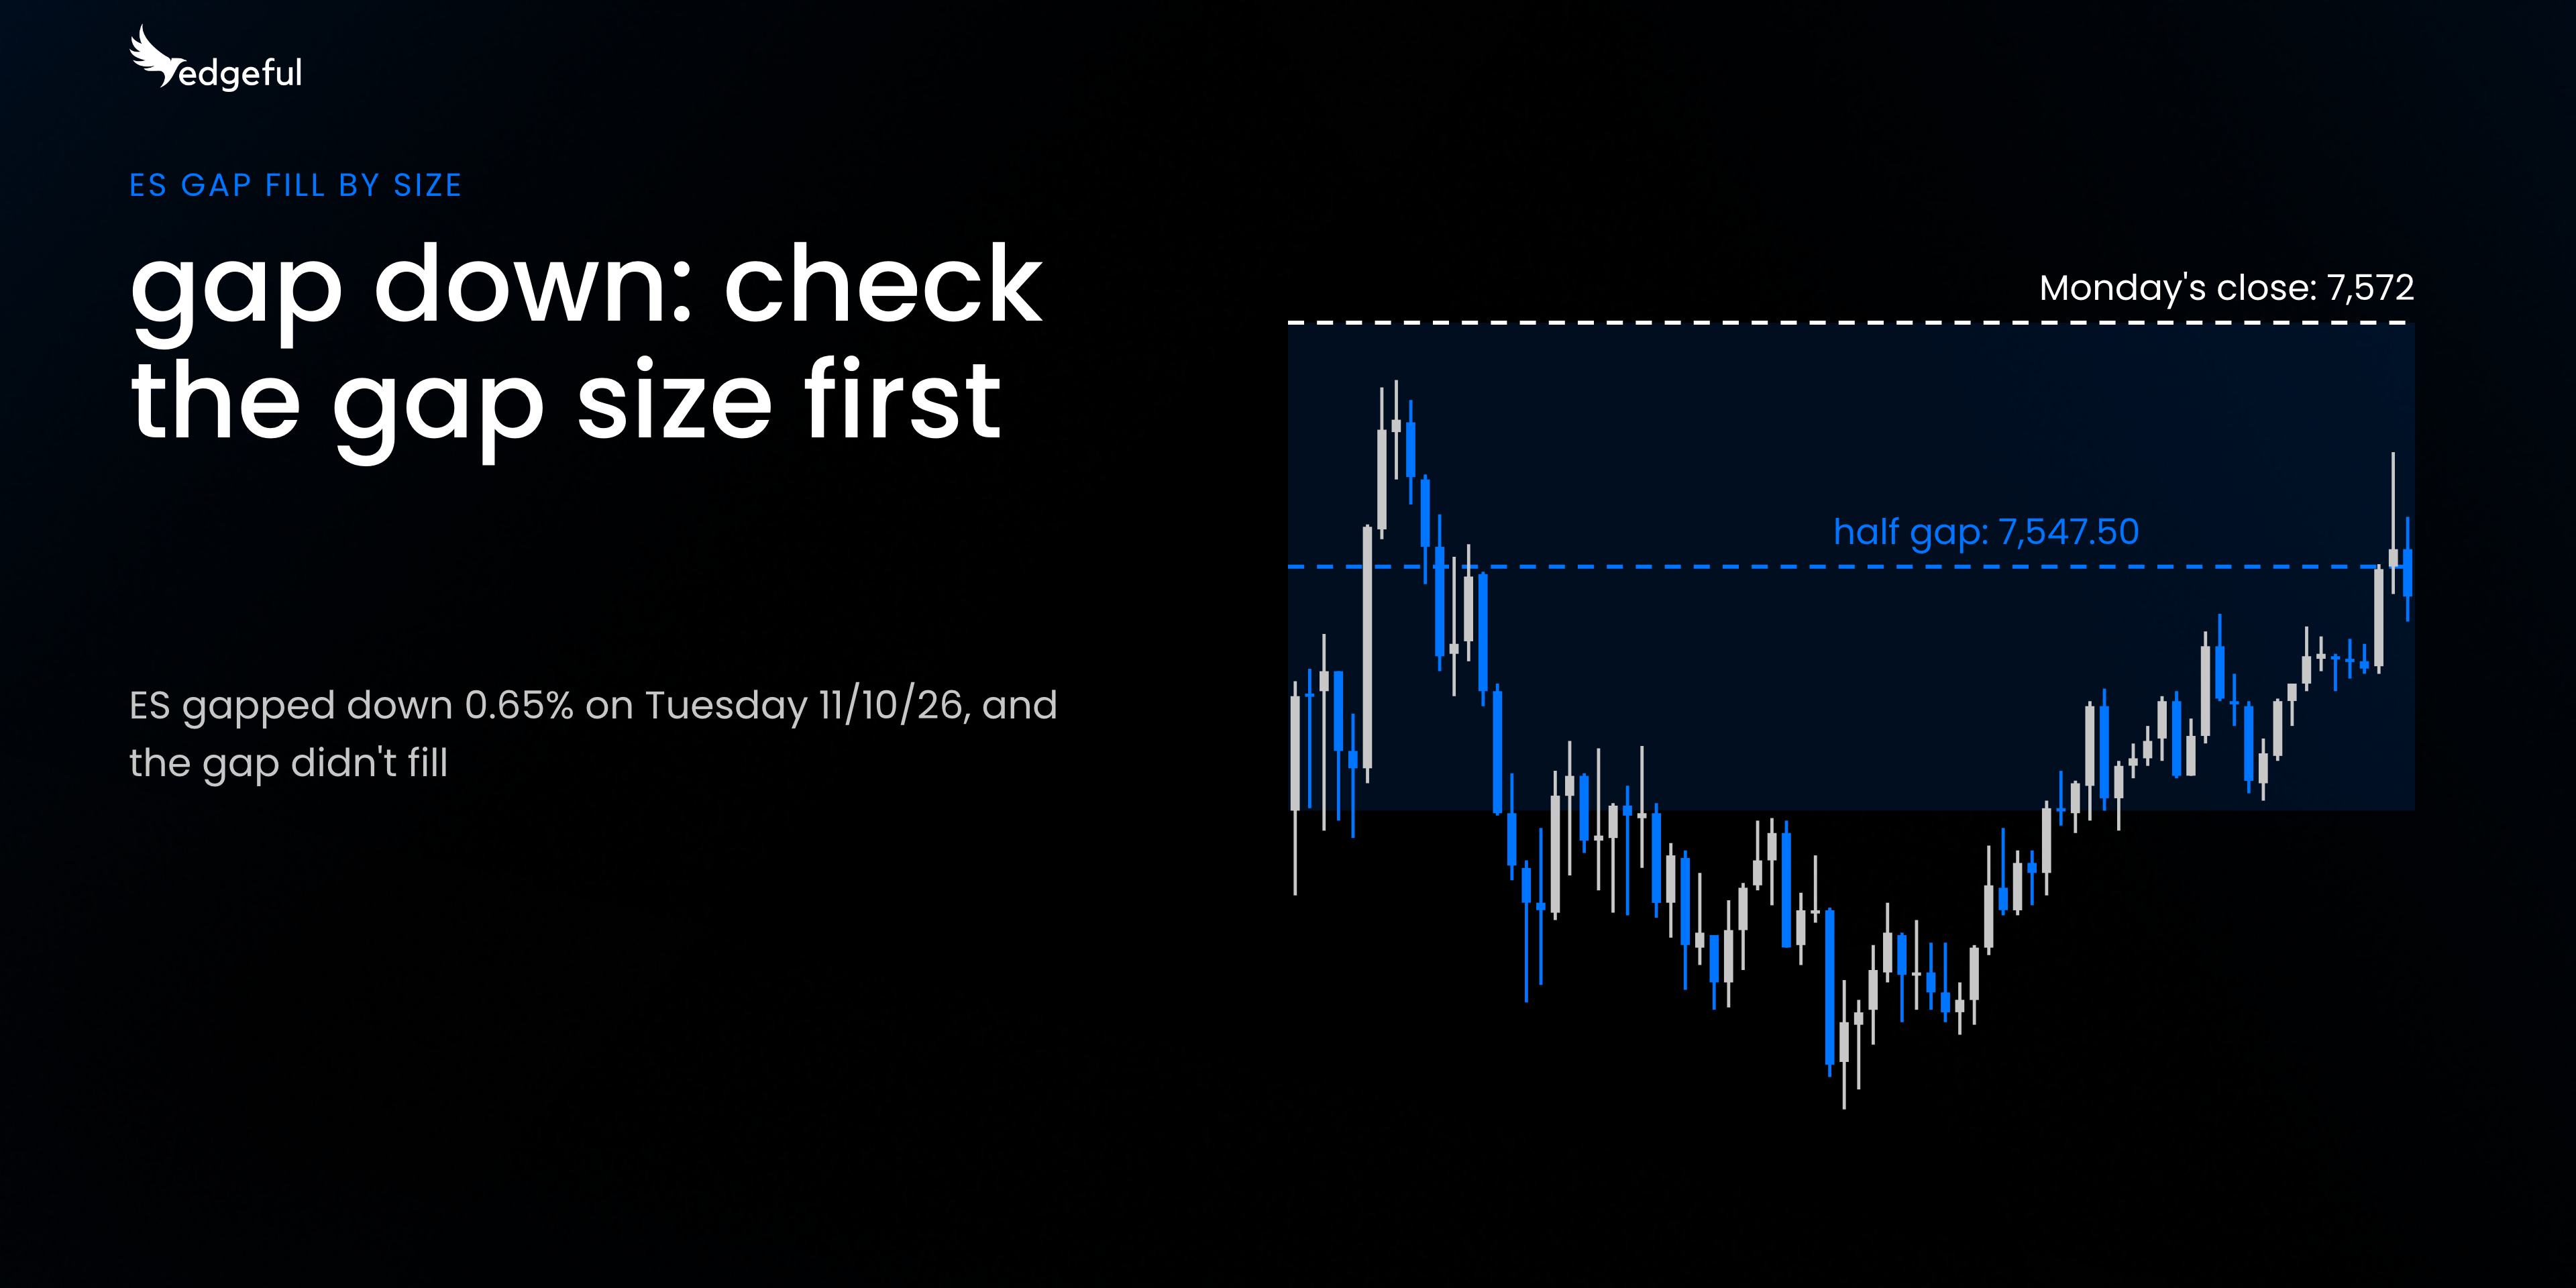
CPI came out at 8:30AM ET, and it came in hotter than expected: CPI month over month was 0.4% vs a 0.3% forecast. an hour later, ES opened 0.65% below Monday's close.
here's how Tuesday played out on ES:
- Monday's 4PM ET close: 7,572
- Tuesday's 9:30AM ET open: 7,523, a 49 point gap down (0.65%)
- half gap level: 7,547.50
- New York session high: 7,566.25 at 10:05AM ET, 5.75 points short of the prior close
- New York session low: 7,493 at 12:40PM ET
- close: 7,544.50
the gap didn't fill. price touched the half gap level on the 9:45AM ET 15 minute candle, pushed up to 7,566.25, and then reversed lower.
again, over the last 6 months on ES, gaps down of 0.4% to 1.5% filled 19% of the time. 11/10 was one of the 21 big gaps down that didn't fill.
how to trade a gap down on ES
here are 3 ways you could have traded the 11/10 gap with the data above.
- sit it out. you easily could've decided that you weren't going to buy the dip, knowing that gaps down this size didn't fill 81% of the time over the last 6 months on ES.
- trade the half gap. the half gap level on Tuesday was 7,547.50, and price touched it on the 9:45AM ET 15 minute candle. over the last 6 months on ES, gaps down of 0.4% to 1.5% filled the half gap 65% of the time (17 of 26), vs 19% for the full fill.
- short the push toward the prior close. knowing that gaps down this size didn't fill 81% of the time, you could have watched the buying pressure into the prior close. when price reversed with 2 15 minute candles near Monday's close, you could have gotten short for a scalp.
there are many ways to trade a gap down using data. the first step is knowing when the data is changing and how it applies to the way you trade.
if you also trade the news itself, our CPI trading strategy guide covers how to trade CPI releases.
how to check the gap size on your own ticker
the ES data above won't match every ticker. before you decide how to trade a gap down on your own ticker, check the gap size data on that ticker:
- open the gap fill report on your ticker, New York session, last 6 months
- compare gaps up and gaps down. if one side filled a lot less often than the other, that's the side to look at closer
- switch to the by size subreport and set a custom range. 0.4% to 1.5% is what I used on ES
- check the half gap. set the fill percentage to 50% and compare it to the full fill on the same gap size
- switch the date range to January to July and compare it to the last 6 months. if the two windows disagree, the data changed
then, at 9:30AM ET on your next session, check the gap size before you trade the gap.
common mistakes when trading a gap down
using the overall gap fill % for every gap. over the last 6 months in the New York session, the 38% for all ES gaps down mixes small gaps (55%) with big gaps (19%). the gap size at the open tells you which data applies.
using a stat you checked months ago. ES gaps down filled 63% of the time from January to July and 38% over the last 6 months. if your plan still uses the January to July data, it's out of date.
measuring gap size in points. a 30 point gap on ES at 7,500 is about 0.4%. the same 30 points meant a bigger % when ES was lower. the by size subreport uses % of the previous close so the buckets stay the same as price moves.
only targeting the full fill. on big ES gaps down over the last 6 months, the half gap filled 65% of the time and the full fill 19%. check both before you pick a target.
key takeaways
- a gap down is when price opens below the previous session's close. it fills when price trades back to that close in the same session
- ES gaps down filled 38% of the time over the last 6 months (5/13/26 to 11/12/26) in the New York session, down from 63% from January to July. ES gaps up filled 57% of the time in both windows
- on ES over the last 6 months, gaps down of 0.4% to 1.5% filled 19% of the time. gaps down under 0.4% filled 55% of the time
- on the same big ES gaps down, the half gap filled 65% of the time
- before you trade an ES gap down, check its size in the gap fill by size report
- switch the date range to January to July on your ticker and compare it to the last 6 months
this content is for educational purposes only and is not financial advice. trading futures involves substantial risk of loss. past results don't guarantee future results.
