
15 min ORB strategy: which side of the opening range breaks first
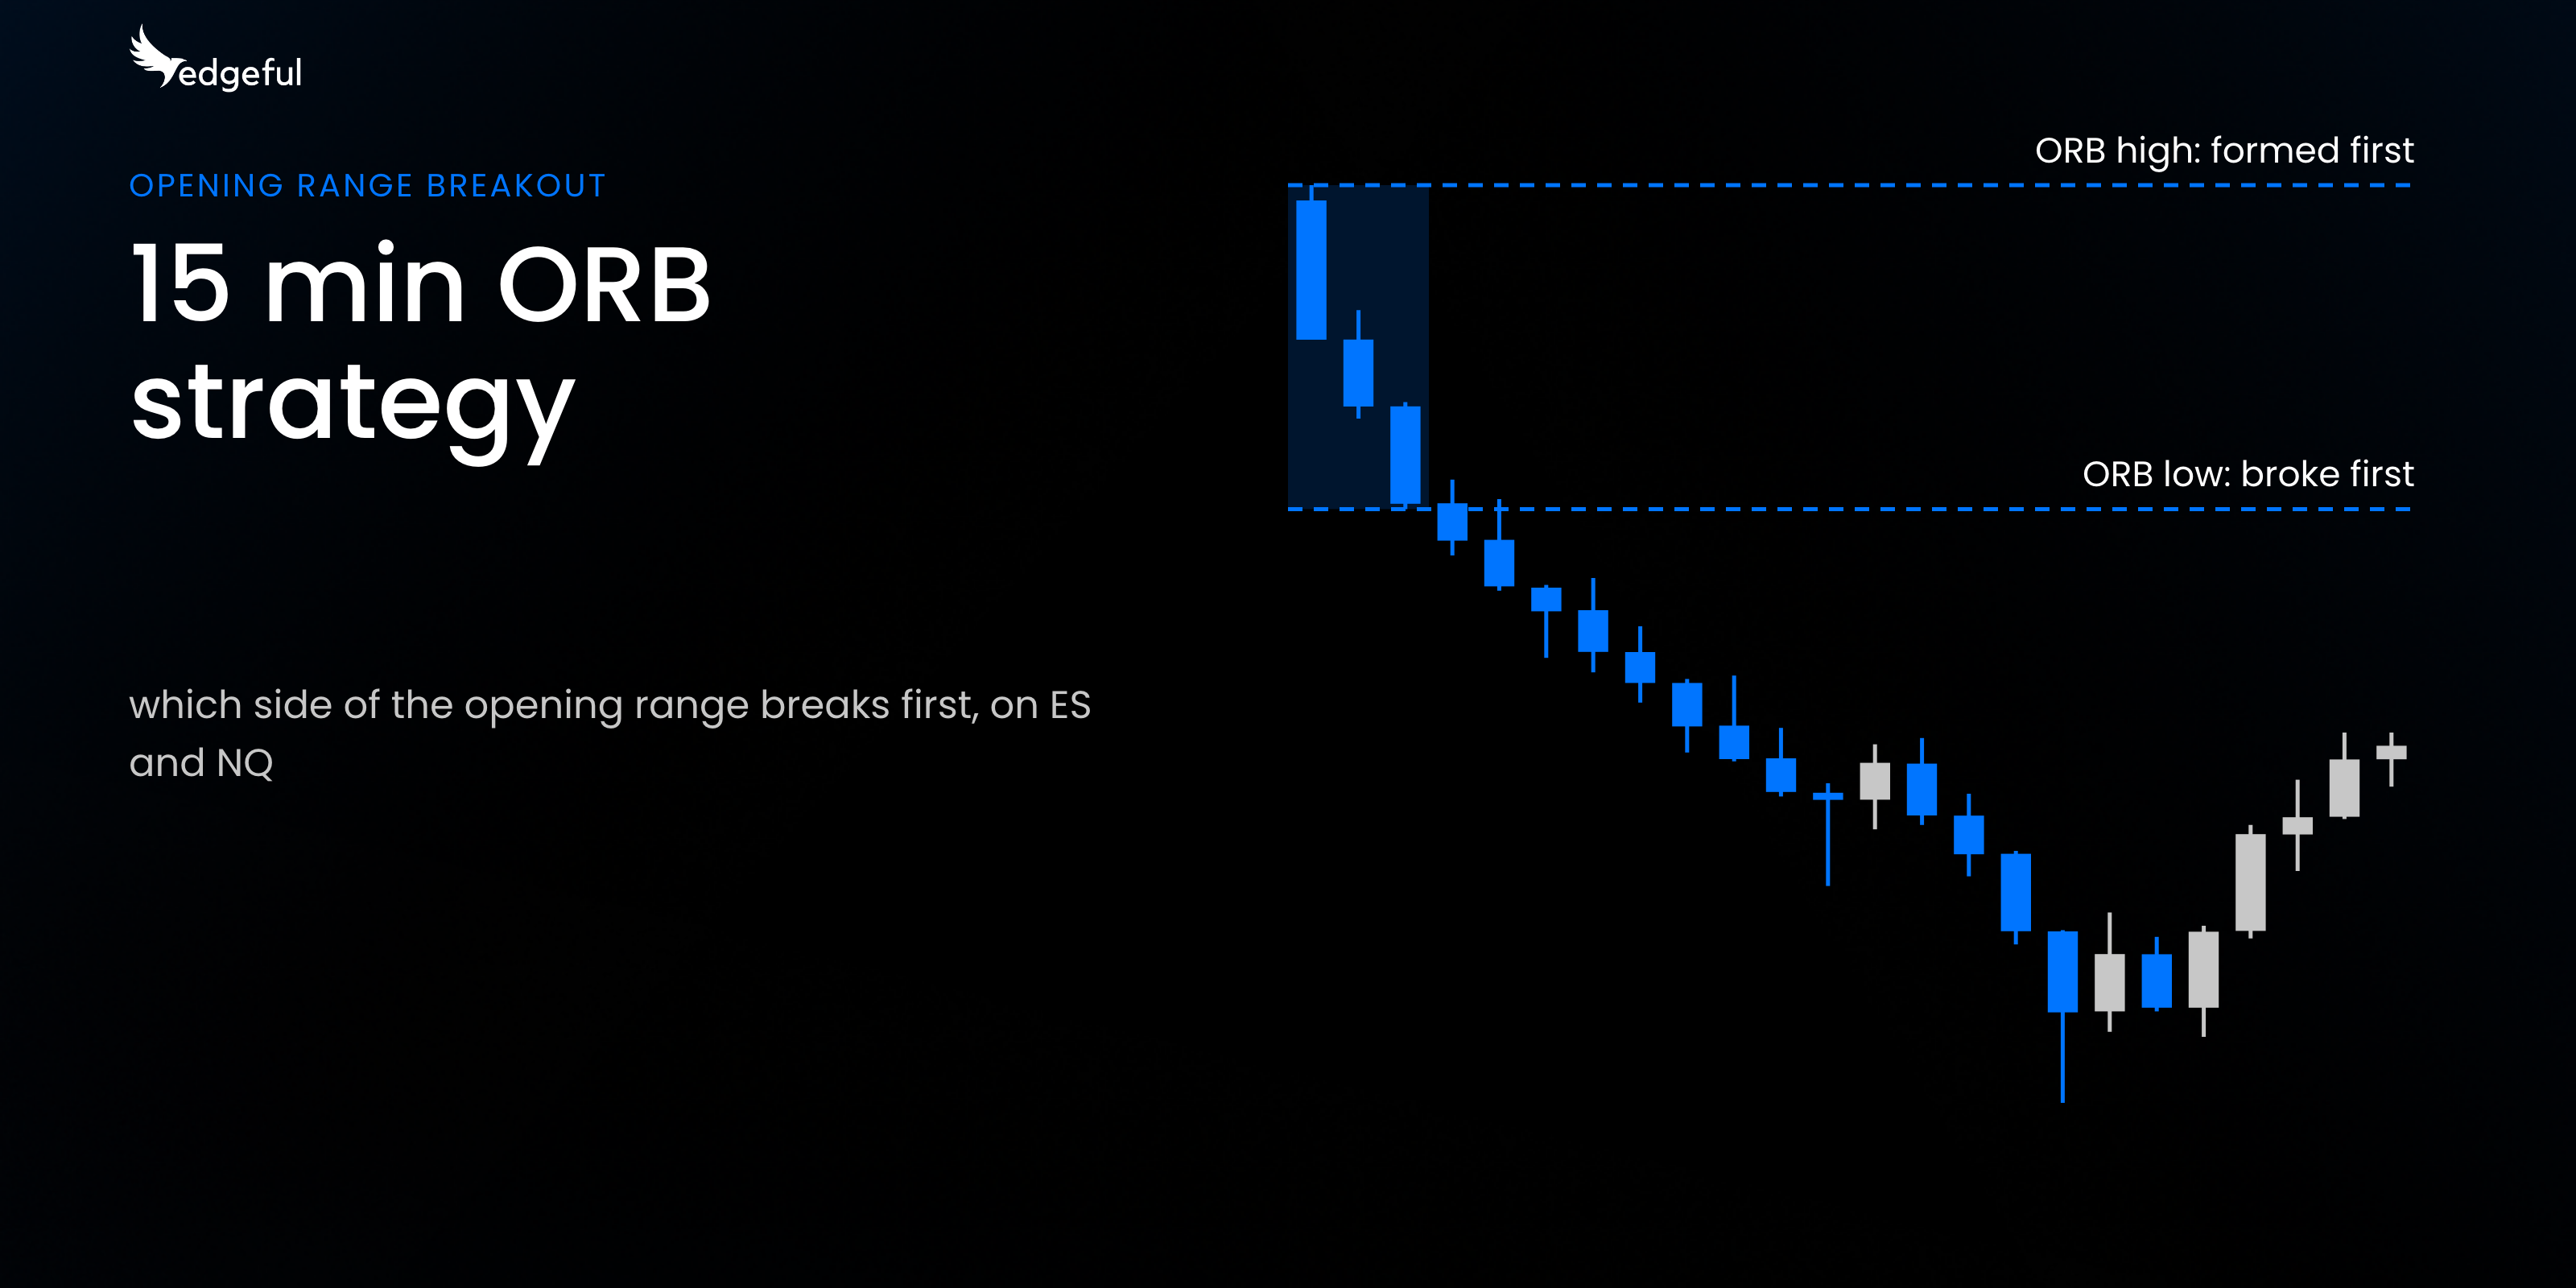
a 15 min ORB strategy starts with the high and the low of the first 15 minutes of the New York session, 9:30AM to 9:45AM ET. once that range is set, you have to decide which side to trade the break, and this post shows how to make that call with data.
inside those 15 minutes, one side of the range always forms first. the side that formed first tells you a lot about which side breaks first after 9:45AM ET. according to edgeful data, on NQ over the last 6 months in the New York session, when the ORB low formed first, the ORB high broke first 79.71% of the time.
this post covers how the 15 minute opening range breakout works, why the side that forms first matters, the numbers on ES and NQ, one extra filter that changes those numbers, and a real example from NQ on Thursday 11/5/26.
table of contents
- what is a 15 min ORB strategy?
- which side of the 15 minute ORB forms first
- the 15 min ORB strategy numbers on ES and NQ
- the ending zone: where price closed the 15 minute ORB
- a 15 min ORB strategy example: NQ on 11/5/26
- how to trade the 15 min ORB strategy
- how to build your own 15 min ORB strategy
- key takeaways
what is a 15 min ORB strategy?
ORB stands for opening range breakout. the opening range is the high and the low of the first few minutes of a session. in a 15 min ORB strategy, that's the first 15 minutes of the New York session, 9:30AM to 9:45AM ET.
after 9:45AM ET, the range is set. ORB trading is built around what price does next: it breaks above the ORB high, breaks below the ORB low, or both.
you also choose how a break counts. by wick means any touch past the level counts as a break. by close means a candle has to close outside the range.
if you're new to ORB trading in general, here's our full guide to the opening range breakout trading strategy. this post goes narrower: the 15 minute opening range breakout, and one way to decide which side to trade.
the hard part of any 15 min ORB strategy is picking the direction. a break can go either way, and if you pick the wrong side, you're stopped out before the real move starts.
which side of the 15 minute ORB forms first
inside the first 15 minutes, price always sets one side of the range before the other.
some days price pushes up and sets the high, then comes back down and sets the low. other days it sets the low first, then comes back up and sets the high.
edgeful's ORB by rejection report splits every session by that:
- high formed first: the ORB high printed before the ORB low
- low formed first: the ORB low printed before the ORB high
then it shows which ORB level price broke first after 9:45AM ET.
the idea is the same as the IB by rejection setup, applied to the 15 minute opening range breakout. the side that formed first got rejected, so you look for a trade toward a break of the other side:
- if the ORB high formed first, you look for a trade toward a break of the ORB low
- if the ORB low formed first, you look for a trade toward a break of the ORB high
the useful part is the timing. by 9:45AM ET, you already know which side formed first, so you can check the data before price breaks either level.
the 15 min ORB strategy numbers on ES and NQ
here's the ORB by rejection report for the 15 minute ORB over the last 6 months (5/11/26 to 11/6/26), New York session, 130 sessions on each ticker.
NQ:
- when the ORB low formed first, the ORB high broke first 79.71% of the time (55 of 69 sessions)
- when the ORB high formed first, the ORB low broke first 68.85% of the time (42 of 61 sessions)
ES:
- when the ORB low formed first, the ORB high broke first 73.91% of the time (51 of 69 sessions)
- when the ORB high formed first, the ORB low broke first 75.41% of the time (46 of 61 sessions)
over the last year (11/7/25 to 11/6/26, 258 sessions per ticker, New York session), the numbers were close:
- NQ: when the low formed first, the high broke first 77.17% of the time. when the high formed first, the low broke first 67.18% of the time
- ES: when the low formed first, the high broke first 73.48% of the time. when the high formed first, the low broke first 73.02% of the time
on ES, and on NQ when the low formed first, the side opposite the one that formed first broke first 73.91% to 79.71% of the time over the last 6 months. NQ when the high formed first is the weakest case, at 68.85% over 6 months and 67.18% over the last year.
the ending zone: where price closed the 15 minute ORB
the ORB by rejection report also has an ending zone filter. it splits sessions by where price closed the 15 minute ORB at 9:45AM ET, in 25% steps of the range.
the 0-24.99% zone means price closed the ORB in the quarter of the range closest to the side you expect to break, the side opposite the one that formed first.
when you add that filter to the 15 min ORB strategy, the numbers go up on both tickers (last 6 months, New York session):
- NQ, when the ORB low formed first and the ORB closed in the 0-24.99% zone, the ORB high broke first 93.02% of the time (40 of 43 sessions)
- NQ, when the ORB high formed first and the ORB closed in the 0-24.99% zone, the ORB low broke first 93.10% of the time (27 of 29 sessions)
- ES, when the ORB low formed first and the ORB closed in the 0-24.99% zone, the ORB high broke first 90.24% of the time (37 of 41 sessions)
- ES, when the ORB high formed first and the ORB closed in the 0-24.99% zone, the ORB low broke first 89.47% of the time (34 of 38 sessions)
it works the other way too. when price closed the ORB back near the side that formed first (the 75-100% zone), that side broke first in most of those sessions. those are small samples, 2 to 5 sessions per row over the last 6 months, so I wouldn't build a 15 min ORB strategy on them.
the 0-24.99% zone is also the most common one. on ES, 79 of the 130 sessions closed the ORB in that zone over the last 6 months. on NQ, it was 72 of 130.
a 15 min ORB strategy example: NQ on 11/5/26
here's NQ on Thursday 11/5/26, on a 5 minute chart:
- the ORB high formed first: 28,228.25, in the 9:30AM ET candle
- price came down and set the ORB low at 27,700
- at 9:45AM ET, price closed the ORB at 27,708.75, in the 0-24.99% zone, near the low
- the ORB low broke first, on the 9:45AM ET candle
so at 9:45AM ET, you knew the high formed first and price closed the ORB in the 0-24.99% zone. on NQ over the last 6 months in the New York session, the ORB low broke first 93.10% of the time after that.
from there, NQ kept going lower. the New York session low was 26,718 at 3:55PM ET, 982 points below the ORB low, and price never got back to the ORB high.
not every day runs that far. the ORB by rejection report tells you which side broke first, not how far price went after the break. for targets, the ORB by performance subreport shows how far price ran past the range.
how to trade the 15 min ORB strategy
in ORB trading, the ORB by rejection report tells you which side to watch. the other ORB subreports help you plan the rest of the trade:
- entry: the break of the ORB level opposite the side that formed first. if you'd rather enter on a pullback after the break, the ORB by retracement subreport shows how often price pulled back to each level of the range after the break. the 25% level is the usual pullback entry
- stop: the ORB by retracement subreport also shows how often price pulled back past the 75% level after the break. a stop beyond that level is based on the data
- target: the ORB by levels subreport shows how often price reached the 0.5x, 1.0x, and 1.5x extensions of the range after the break
set all three to the same ticker, session, and ORB length so the numbers line up. on 11/5, by 9:45AM ET you knew which side to watch and where the ORB low was, and the by levels subreport showed how far NQ ran past the range on past breaks.
how to build your own 15 min ORB strategy
the numbers above are for ES and NQ. before you use a 15 min ORB strategy on your own ticker, check the data on that ticker:
- open the ORB by rejection report on the ticker you trade, with the 15 minute ORB in the New York session
- see which side breaks first more often, after the high forms first and after the low forms first
- set the ending zone filter to 0-24.99% and see how the numbers change
- switch the date range to the last year and compare it to the last 6 months. if the two windows disagree, be careful with the shorter one
- try a different ORB length, like 5, 10, or 30 minutes, and see how the numbers change compared to the 15 minute ORB
then, at 9:45AM ET on your next session, check which side formed first and where price closed the ORB, before either level breaks.
if you want the levels on your chart instead of drawing them by hand, the edgeful ORB indicator for TradingView plots the opening range for you.
the report doesn't take the trade for you. you still decide your entry, your stop, and your size, and you should still test the 15 min ORB strategy on your own ticker before you trade it with real money.
key takeaways
- a 15 min ORB strategy uses the high and low of 9:30AM to 9:45AM ET in the New York session
- one side of the 15 minute ORB always forms first, and the ORB by rejection report shows how often the other side broke first after 9:45AM ET
- on NQ over the last 6 months in the New York session, when the ORB low formed first, the ORB high broke first 79.71% of the time
- the ending zone filter is the extra check: when price closed the ORB near the side you expect to break, the numbers were 89.47% to 93.10% on ES and NQ over the last 6 months in the New York session
- for how far price ran after the break, use the ORB by performance subreport
- check the data on your own ticker and time window before you trade any 15 min ORB strategy
edgeful provides historical performance data to help traders make informed decisions. this does not constitute financial advice. past performance is not indicative of future results. all trading involves risk. always do your own analysis and manage your risk accordingly.
