how to build a trading bias with real-time data
you're 45 minutes into the session. you've got three charts open, a couple of indicators loaded, and you still don't know if you should be looking for longs or shorts. you've got setups forming, but no real sense of whether the broader market agrees with any of them.
that's not a strategy problem. that's a trading bias problem — and most traders try to solve it with gut feel, Twitter, or whatever someone posted in a Discord room. none of that is a real bias. a real trading bias is built from data that updates throughout the session, not a decision you make before the open and hope holds up.
here's how to actually build one — step by step, from the open to the close — using two tools that do completely different jobs.
table of contents
- what a trading bias actually is (and what it isn't)
- the two tools that build your bias
- before the open: set up your session
- 9:30 – 10:30: find the setups
- after 10:30: build the broader bias
- how they work together (the full workflow)
- common mistakes traders make with session bias
- key takeaways
what a trading bias actually is (and what it isn't)
a trading bias is a directional lean backed by data. it's not a prediction. it's not a morning call from a chat room. and it's definitely not "I feel like NQ is going up today."
a real bias tells you: based on multiple data points across multiple reports, the market is leaning in this direction right now.
the key word there is "right now." a trading bias isn't something you set once before the bell and stick with all day. the best biases update as the session unfolds — because the data that builds them doesn't all arrive at the same time. some reports are live from the open. others need the first hour to fully form. your bias should reflect what's actually happening, not what you thought would happen at 9:25 AM.
that's why you need two different tools, not one. one for finding specific setups as they trigger. one for reading the broader direction of the market after enough data has formed.
the two tools that build your bias
on edgeful, there are two tools that do this — and they're not the same thing, even though traders sometimes confuse them.
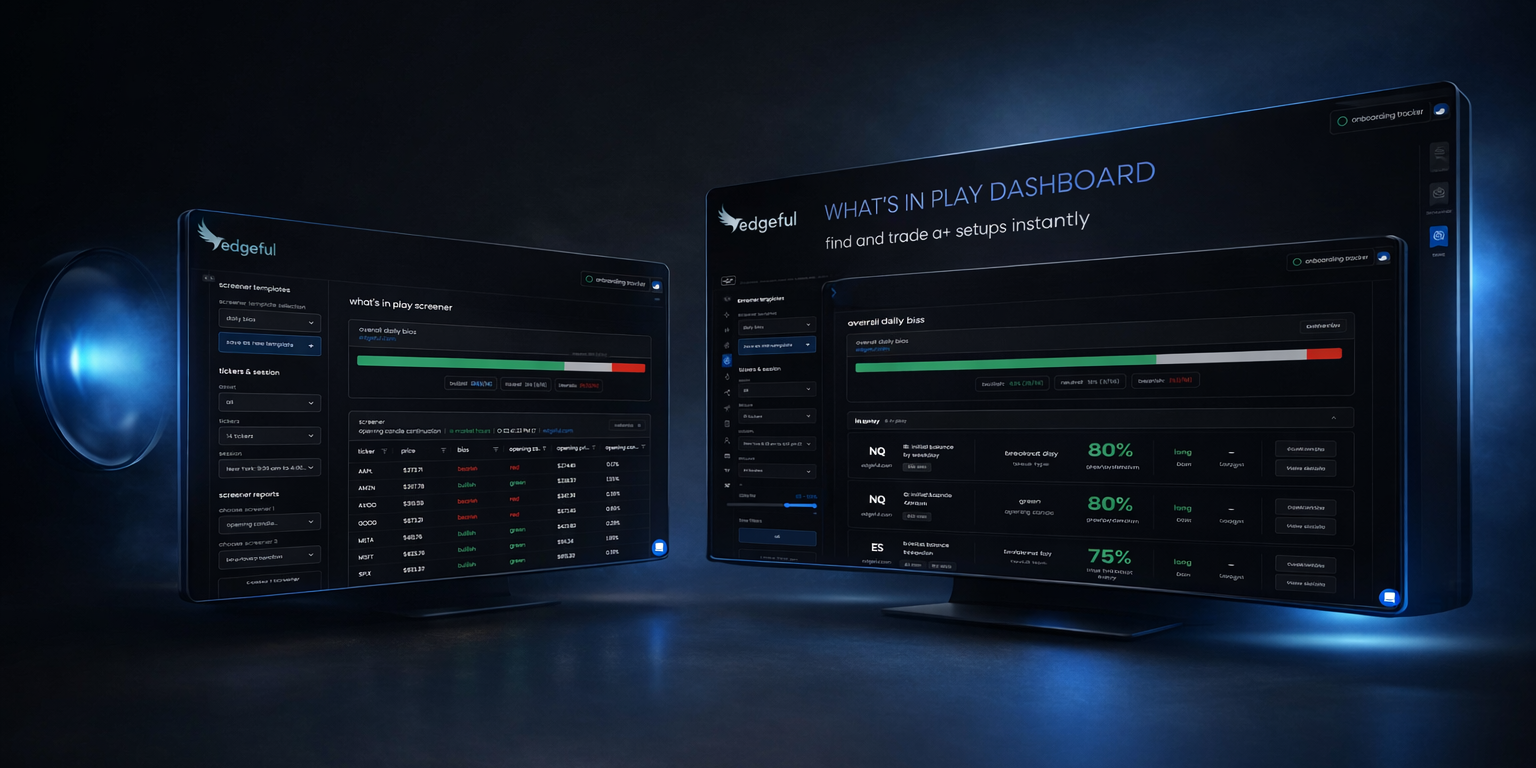
the what's in play dashboard (your setup finder)
think of the what's in play dashboard as your home base for the entire session. you select the tickers you want to track, the reports you want to run them through, and a threshold so you're only seeing the setups that are actually worth paying attention to.
from there, the dashboard organizes everything into three sections:
- in play — the setup has triggered and the data is live. this is what you can act on right now.
- forming — the setup isn't ready yet. the ORB is still building, the IB hasn't closed, the opening candle is still printing. check back.
- completed — the setup has already played out. if you missed it, you missed it. move on.
for each setup that's in play, you get the bias, the targets, and both live and historical data — all without leaving the page or searching through reports individually.
this is where you find specific trades. it answers the question: what's setting up right now on the tickers I trade?
the screener (your bias builder)
the screener is a completely different tool. instead of showing you individual setups on specific tickers, it gives you a broad view of where the market is leaning across multiple reports and multiple tickers at once.
the screener is best used after 10:30 AM ET. the reports that matter most for building a session bias — IB standard, IB by rejection, and opening candle continuation — all need the first hour to fully form. before 10:30, you don't have a complete picture. after 10:30, you do.
once those reports have finished forming, the sentiment bar at the top of the screener gives you a simple, broad read: mostly bullish, mostly bearish, or mixed.
this is where you read the room. it answers the question: based on everything that's formed so far, where is the market leaning for the rest of the session?
the key distinction
the what's in play bias bar only pulls from the reports you've selected for a specific ticker. it's targeted.
the screener sentiment bar pulls from multiple reports across multiple tickers. it's broad.
they're answering different questions, and you need both.
before the open: set up your session
before the market opens, your job is simple: get your tools ready so you're not scrambling at 9:30.
- load the what's in play dashboard. select the tickers you trade, the reports you want to track, and set your threshold. if you've already done this before, you can save it as a template and load the whole thing in one click. edgeful also has pre-built templates if you want a starting point — the ES NQ most popular template is a good one to try.
- check the premarket view. this gives you early context before the bell — what's already developing based on overnight action and pre-market data.
- look at previous day's range. this is the one report that's available from the open and can start informing your bias right away, before the other reports finish forming.
that's it for pre-market. you're not making trading decisions yet — you're just getting set up so the data is ready when the session starts.
9:30 – 10:30AM: find the setups
the bell rings. this first hour is where the what's in play dashboard is extremely valuable.
you're watching setups move through the three stages — forming, in play, completed. as the ORB window closes, as the opening candle finishes printing, setups start triggering and moving from "forming" to "in play."
for each setup that hits "in play," you've got the data right there:
- the bias,
- the targets,
- and how the setup has performed historically.
you're not searching through individual reports or flipping between tabs. everything is on one page.
one thing I use all the time: if I'm running late and miss the first 15-20 minutes, I pull up the dashboard and check the "completed" section. instantly I know what already played out vs. what I can still look forward to trading. no guessing, no scrambling.
what the bias bar is telling you
the bias bar at the top of the what's in play dashboard is specific to your configuration. if you've got gap fill, IB, and ORB loaded up, the bias bar is reflecting those setups specifically. it's not giving you a broad market picture — just a clean, real-time read on the exact setups you're watching that session.
this matters because it keeps you focused. you're not drowning in data from 14 tickers. you're seeing exactly what's relevant to the trades you're looking to take.
after 10:30: build the broader bias
now the first hour is done. the IB has formed. the opening candle continuation data is in. the IB by rejection report has data. this is when the screener becomes useful.
flip to the screener and load the daily bias template. this pulls IB standard, IB by rejection, opening candle continuation, and previous day's range across 14 of the market's most important tickers automatically. if you're not sure which reports to load, the daily bias template is what I'd recommend — it covers the reports that matter most for reading session direction.
once those reports are fully formed, the sentiment bar at the top tells you where the market is leaning for the rest of the day. mostly bullish across 14 tickers? that's a strong directional lean. mixed? maybe it's a day to be selective. mostly bearish? you've got a clear read.
the sentiment bar vs. the WIP bias bar
this is worth calling out directly because it trips people up.
the what's in play bias bar is specific to the individual reports you've selected and the ticker you're watching. the screener sentiment bar is giving you a broad market view across multiple reports and multiple tickers at once.
use both to inform your trading with data — just know what each one is actually telling you. once you understand that distinction, the whole workflow makes sense.
how they work together (the full workflow)
here's the simplest way to think about it:
- what's in play is your setup finder. open it before the market opens, keep it up throughout the session, and use it to track exactly what's setting up on the tickers you trade — with the bias, targets, and key levels already calculated for you.
- the screener is your bias builder. after 10:30 AM, once the IB has formed and the first hour has played out, open it up, load the daily bias template, and let the data tell you whether to be bullish, bearish, or to sit on your hands for the rest of the session.
the decision framework
this is where it all comes together:
- setup + broad bias aligned — what's in play shows a bullish setup on NQ, and the screener confirms 10 of 14 tickers are leaning bullish. that's confluence. higher conviction.
- setup live but broad bias is mixed — you've got a trade forming, but the broader market isn't clearly directional. maybe you take it with reduced size, or you pass and wait for more clarity.
- no setups in play + strong directional sentiment — the screener says bearish, but nothing has triggered on your dashboard yet. don't force it. wait for a setup to actually form.
- broad bias bearish but your setup is bullish — the data is conflicting. this is where discipline matters. either skip the trade or have a very clear plan for managing risk.
use what's in play to find the trade. use the screener to make sure the broader market is with you. that's it.
and the best part is — this entire workflow updates throughout the session. as new reports form, as setups trigger and complete, your bias evolves with the data. you're not stuck with whatever you decided at 9:25. you're reading the session as it unfolds.
this is what a data-driven trading routine actually looks like. not checking your phone for someone else's opinion on direction. building your own bias from real data, in real time.
common mistakes traders make with session bias
mistake 1: treating your bias as a one-time decision
a lot of traders decide "I'm bullish today" before the open and then ignore any data that comes in after that. that's not a bias — that's a bet. the whole point of having real-time data is that your bias updates as the session unfolds. the IB forms at 10:30. the opening candle finishes. new setups trigger. if you're not updating your read on the session as this data comes in, you're leaving the best part of the workflow on the table.
mistake 2: using the screener before 10:30
the screener's power comes from reports that need time to form. IB standard, IB by rejection, opening candle continuation — these all need the first hour of the session. if you check the screener at 9:45, you're looking at incomplete data. previous day's range is the exception — that one's available from the open. but for the full picture, wait until after 10:30. that's when the screener actually has something meaningful to tell you.
mistake 3: confusing the WIP bias bar with the screener sentiment bar
this is the most common one. the what's in play bias bar reflects only the reports you've selected for a specific ticker. the screener sentiment bar reflects multiple reports across 14+ tickers. they're different tools answering different questions. if you treat them as interchangeable, you're going to misread the data. the WIP bias bar tells you about your setups. the screener tells you about the broader market. use both — just know which one you're looking at.
key takeaways
- a trading bias is a data-backed directional lean, not a feeling or prediction — and it should update throughout the session as new reports form
- the what's in play dashboard is your setup finder — use it to track specific setups on specific tickers from the open
- the screener is your bias builder — use it after 10:30 AM when IB, IB by rejection, and opening candle continuation reports have fully formed
- the WIP bias bar and the screener sentiment bar are not the same thing — one is targeted to your configuration, the other is broad market
- use templates to load your configuration in one click every session — saves time and keeps your process consistent
- the strongest trades happen when your individual setup aligns with the broader session bias — that's real confluence
- if the data is mixed or nothing is triggering, sit on your hands — sometimes the best trade is no trade
edgeful provides historical data and statistics to help inform trading decisions. past performance does not guarantee future results. all trading involves risk, and results depend on your strategy, customization, and risk management.