
revenge trading: how to stop it with a hard daily rule
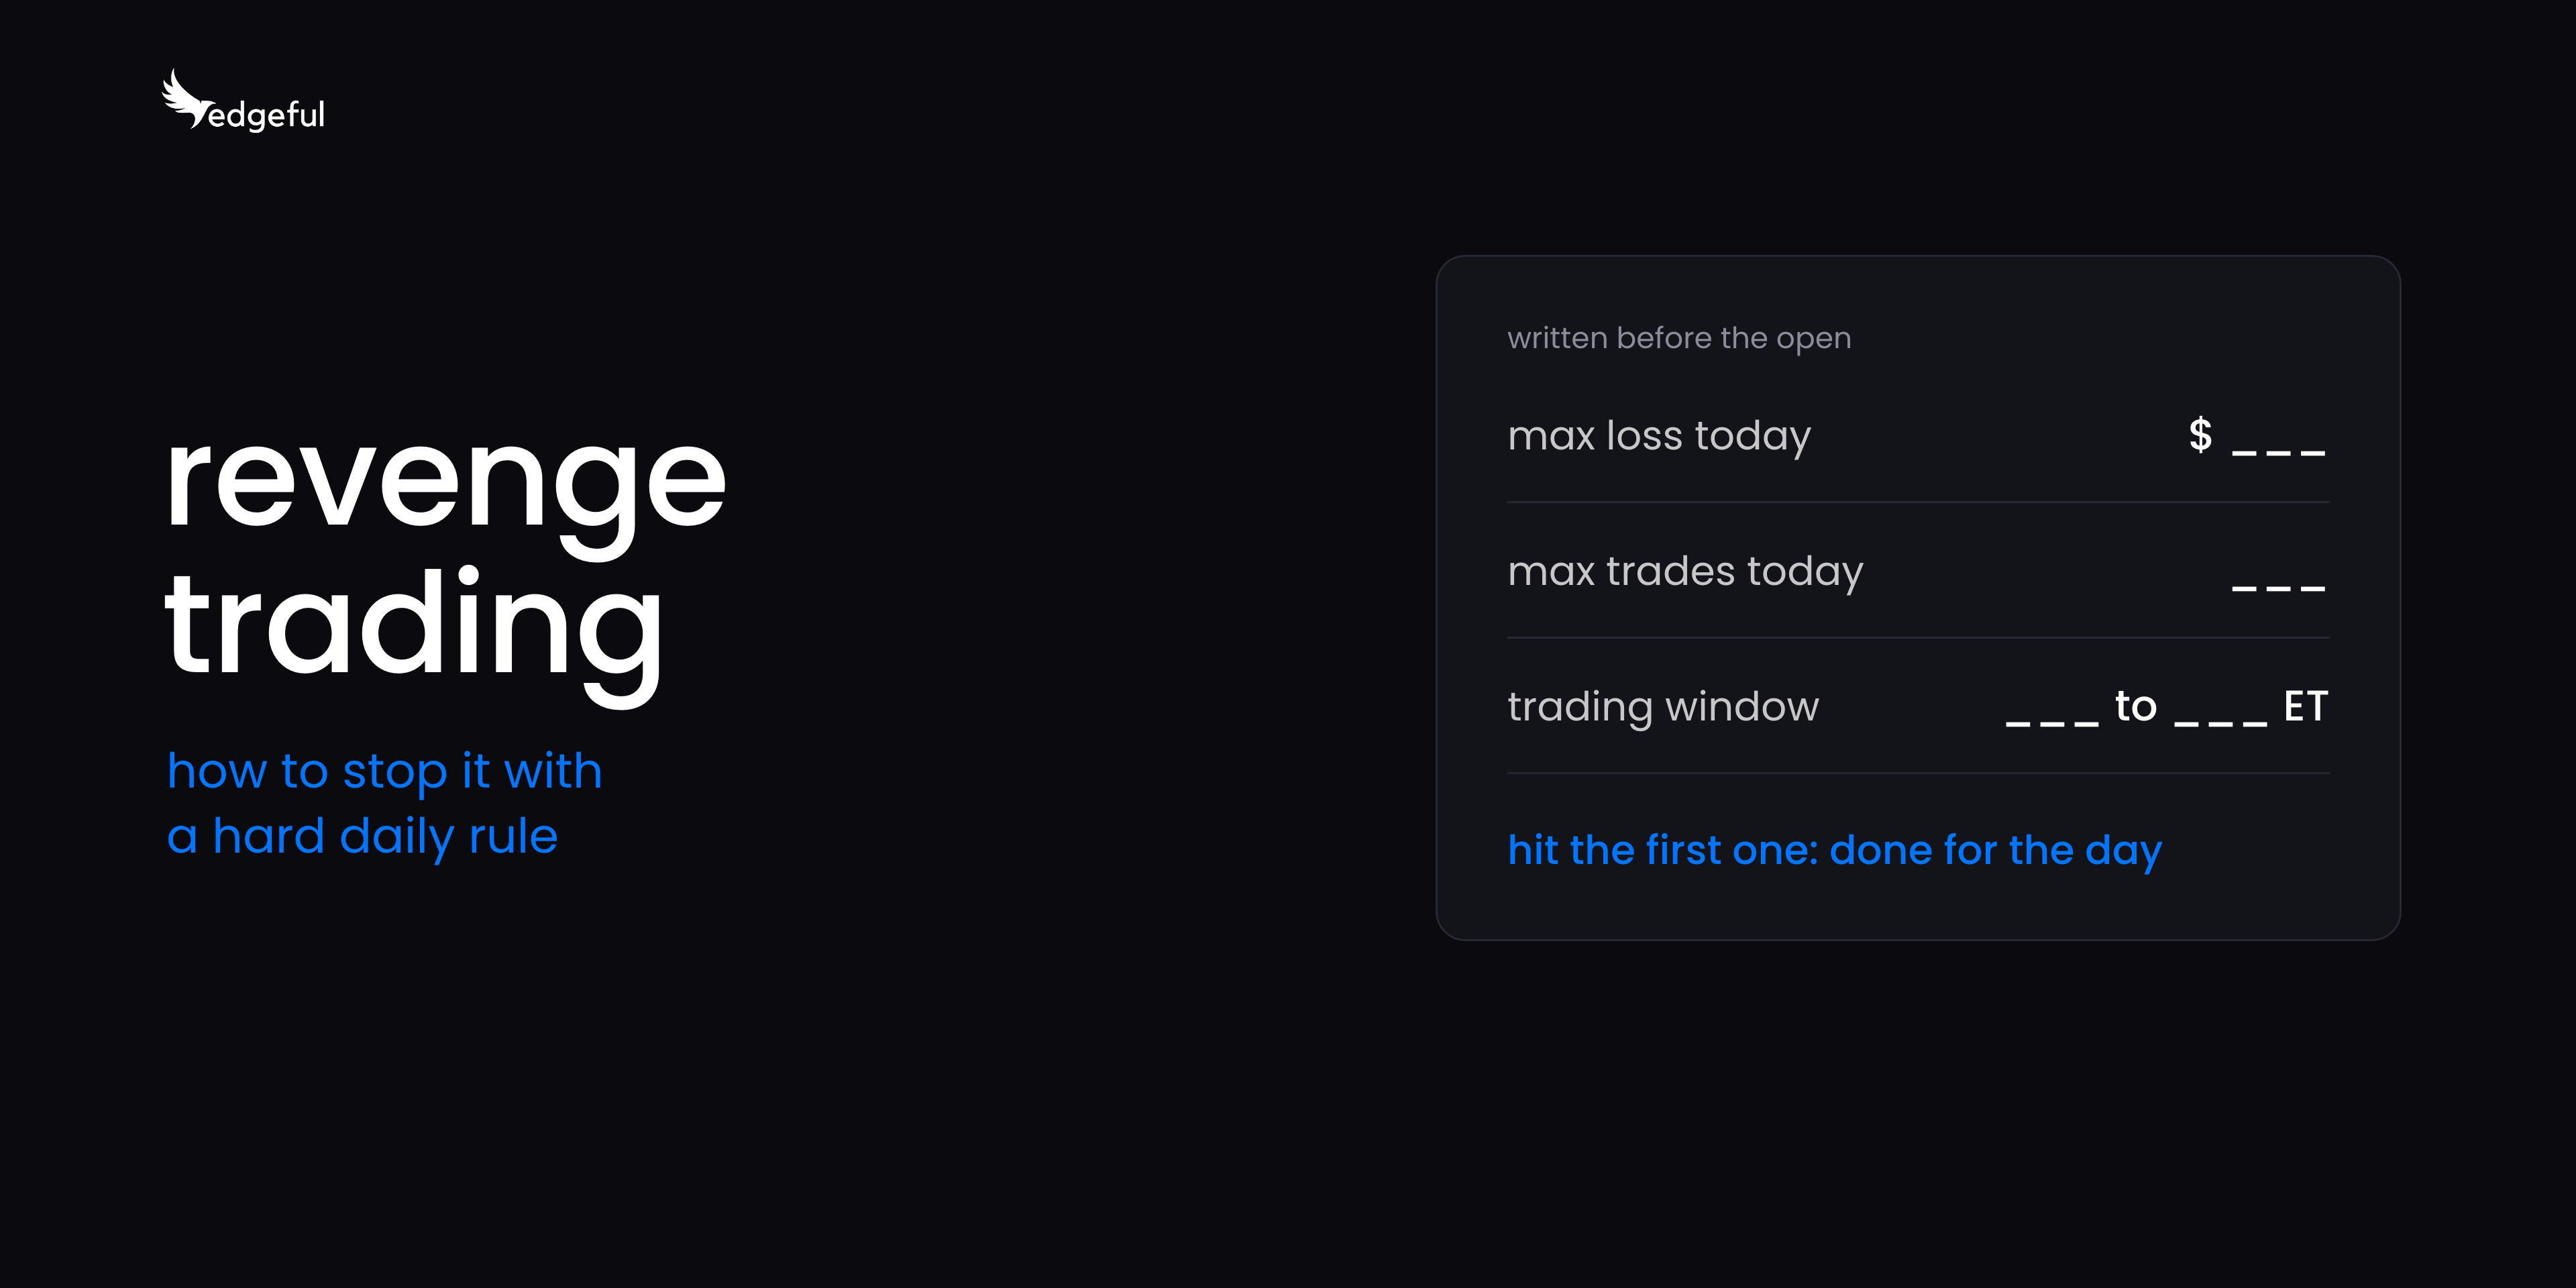
you stop revenge trading by writing down your max loss and your max number of trades before the open, and treating whichever one you hit first as the end of your session.
traders describe revenge trading in the same few words: a small loss, then a bigger trade to get it back, then a bigger loss. "revenge trading is my biggest issue" and "I do well and get funded but then may lose a few and go on tilt" are two ways traders have put it to us.
table of contents
- why do I trade worse after a loss?
- when do the high and low of the day form?
- how often does NQ's range go past its 5-session average?
- how do I stop revenge trading? 5 steps
- what should you check before trading after a loss?
- how many trades should I take after a losing trade?
- can automation stop revenge trading?
- key takeaways
why do I trade worse after a loss?
traders tell us the next entry after a loss is about winning the money back, so it goes in without their setup behind it, often at bigger size.
the sequence traders describe with revenge trading is:
- small loss,
- a bigger trade to win it back,
- then a bigger loss.
some traders trace it to doubt about the setup itself: "I believe that it is rooted in not being 100% confident in my setups." others describe a good stretch, a few losses, and then a spiral they call tilt.
we don't have your trades, so edgeful data can't tell you how often revenge trading happens to you. the reports measure the market, and they give you numbers to set a rule with: how big a day usually is (the ADR report) and when the day's high and low form (the intraday timing report).
if you trade a prop firm account, the daily loss limit and the trailing drawdown already put a hard number on how many bad trades fit in a day. the rule below does the same job on any account.
if you want the psychology side of consistent trading, our post on the base hit approach covers it.
when do the high and low of the day form?
the high of the day formed in the first 30 minutes of the NY session on 30.3% of NQ sessions, versus 18.2% across all 6 half-hour windows from 12:00 to 3:00 PM ET combined.
here's what the intraday timing report shows on NQ over the last 6 months, across 132 NY sessions:
- the first 30 minutes (9:30 to 10:00 AM ET)
- high of the day: 30.3% of sessions (40 of 132)
- low of the day: 36.4% of sessions (48 of 132)
- the first hour (9:30 to 10:30 AM ET)
- high of the day: 40.9% of sessions (54 of 132)
- low of the day: 54.5% of sessions (72 of 132)
- 12:00 to 3:00 PM ET, all 6 half-hour windows combined
- high of the day: 18.2% of sessions (24 of 132)
- low of the day: 13.6% of sessions (18 of 132)
- the last 30 minutes (3:30 to 4:00 PM ET)
- high of the day: 12.9% of sessions (17 of 132)
- low of the day: 10.6% of sessions (14 of 132)
and the same report on ES, same window and same 132 sessions:
- the first 30 minutes (9:30 to 10:00 AM ET)
- high of the day: 27.3% of sessions (36 of 132)
- low of the day: 31.8% of sessions (42 of 132)
- the first hour (9:30 to 10:30 AM ET)
- high of the day: 37.9% of sessions (50 of 132)
- low of the day: 45.5% of sessions (60 of 132)
- 12:00 to 3:00 PM ET, all 6 half-hour windows combined
- high of the day: 21.2% of sessions (28 of 132)
- low of the day: 17.4% of sessions (23 of 132)
- the last 30 minutes (3:30 to 4:00 PM ET)
- high of the day: 9.8% of sessions (13 of 132)
- low of the day: 10.6% of sessions (14 of 132)
data: edgeful intraday timing report, NQ and ES, NY session (9:30 AM to 4:00 PM ET), 30-minute buckets, May 14 to Nov 13, 2026, 132 sessions, pulled Nov 16, 2026.
the report records the 30-minute window where each session's high printed and the 30-minute window where each session's low printed. it doesn't say which way the day closed or how big the move was.
54.5% of NQ highs (72 of 132) formed from 11:00 AM ET on, and so did 38.6% of NQ lows (51 of 132). to see whether your setup works at a given time of day, check its own report (step 3).
how often does NQ's range go past its 5-session average?
over the last 6 months, NQ's NY session range went past the average range of the prior 5 sessions on 45.5% of days (60 of 132) and didn't go past it on 54.5% of days (72 of 132).
the ADR report compares each session's high to low range with the average range of the 5 sessions before it. as of Nov 13, 2026, that average on NQ was 639.3 points.
that average moves a lot. over the same 6 months it ran from 192.5 points on Sep 14 to 976.4 points on Jun 12, so the ADR report is worth checking each morning before you set your max loss.
the report measures full sessions, so it can't tell you what NQ did after it reached the average. it shows how often a full day went past the average, which was 45.5% of days.
the 2 biggest NQ sessions in the window were Jun 9 (1,620.5 points against a 519.85 point average) and Nov 5 (1,510.25 points against a 496.2 point average).
data: edgeful ADR report, NQ, NY session (9:30 AM to 4:00 PM ET), 5-session baseline, May 14 to Nov 13, 2026, 132 sessions, pulled Nov 16, 2026.
how do I stop revenge trading? 5 steps
you stop revenge trading with a rule you write before the open and a report behind each number in it. here's the order:
- set your max loss for the day. open the ADR report for the ticker you trade and see how big a normal day is on that ticker, so you can judge a day's loss against it. NQ's 5-session average range in the NY session was 639.3 points as of Nov 13, 2026. then write your max loss in dollars where you can see it, and when you hit it, you're done for the day on every account.
- set your max number of trades and the window you trade them in. the intraday timing report shows when the day's high and low form on your ticker. on NQ the high formed in the first hour on 40.9% of sessions and the low on 54.5% over the last 6 months. the report shows when the extremes form, and your setup's report shows when it works. pick your window with both reports for the ticker you trade, write it next to your max loss, and stop trading outside it.
- check the setup in its report before every entry, including the entry after a loss. across 150+ reports and 8+ years of data, the setup's report shows how often it worked and how often it didn't over the window you pick. edgeful AI reads all 150+ reports: name the report in your question and it runs it, and it can help with your daily prep before the open. if the report doesn't back the setup, sit out.
- if you'd rather not place the entries by hand, let an algo take them. edgeful has 7 automated trading algos, and each one takes the trade on the settings you pick, including the session.
- refresh the numbers. check the ADR report each morning and re-pull the intraday timing report each week. the 5-session average on NQ ran from 192.5 to 976.4 points in the window above, so a max loss sized in one month may be the wrong size in the next.
this is what the revenge trading rule looks like written down:
- max loss today: $___
- max trades today: ___
- trading window: ___ to ___ ET
- when I hit the first one, I'm done for the day
what should you check before trading after a loss?
a trade after a loss gets the same 4 checks as the trade before it, and all 4 have to be true.
- the time is inside your trading window
- you're under your max number of trades
- a full stop on this trade still fits under your max loss for the day
- the setup's report backs it, and the size is the same as your last trade
if any one of them isn't true, you sit out.
how many trades should I take after a losing trade?
take as many as your daily limit has left, and none once you've hit your max loss for the day.
you pick the number before the open. a loss uses 1 of your trades and part of your max loss, and your rule says what's left. our post on futures risk management walks through 9 risk rules for futures traders, and it's a good place to look when you're deciding how much of your account a single day can cost.
if your max is 3 trades and the first one loses, you have 2 trades left and the same 4 checks apply to both. if the first trade hits your max loss, you have 0 trades left.
can automation stop revenge trading?
an edgeful algo takes its trades on the settings you pick, so the entries it takes don't depend on how your last trade went. it doesn't stop you from placing trades by hand, so your max loss and max trades still come from your written rule.
edgeful has 7 automated trading algos, built on 3 strategies: ORB, IB, and engulfing candles. they're part of all access. the algos are for:
- traders who struggle with letting emotions like fear, greed, or tilt get in the way of their trading
- traders who have full time jobs, or want to spend less time in front of the screens
the algos run as TradingView strategies and connect to Tradovate, NinjaTrader, and ProjectX, on paper and live accounts. you pick the settings and the tickers, including the session, and you can run as many strategies as you want. stop losses execute as market orders, and the live trade log shows every executed trade with its entry, exit, and P&L.
if you run the algos, you still keep your written max loss and max trades from your revenge trading rule, you stop for the day when you hit one, and you still check the ADR report each morning. our guide to automated trading strategies covers the algos and how to set them up.
key takeaways
- write your max loss and your max number of trades before the open, and treat the first one you hit as the end of your session.
- the ADR report shows the size of an average day to judge your max loss against: 639.3 points on NQ in the NY session as of Nov 13, 2026, and 45.5% of NQ sessions over the last 6 months went past their prior 5-session average.
- the intraday timing report shows when the high and low form on the ticker you trade. on NQ, the high formed in the first hour on 40.9% of sessions and the low on 54.5%, and across 12:00 to 3:00 PM ET combined, 18.2% and 13.6%.
- a trade after a loss gets the same 4 checks as the trade before it: window, trade count, max loss, and the setup's report.
- if you'd rather not place the entries by hand, the 7 algos in all access take them on the settings you pick.
edgeful provides historical performance data to help traders make informed decisions. this does not constitute financial advice. past performance is not indicative of future results. all trading involves risk. always do your own analysis and manage your risk accordingly.
