
max drawdown: how to pick a trading strategy your account can handle
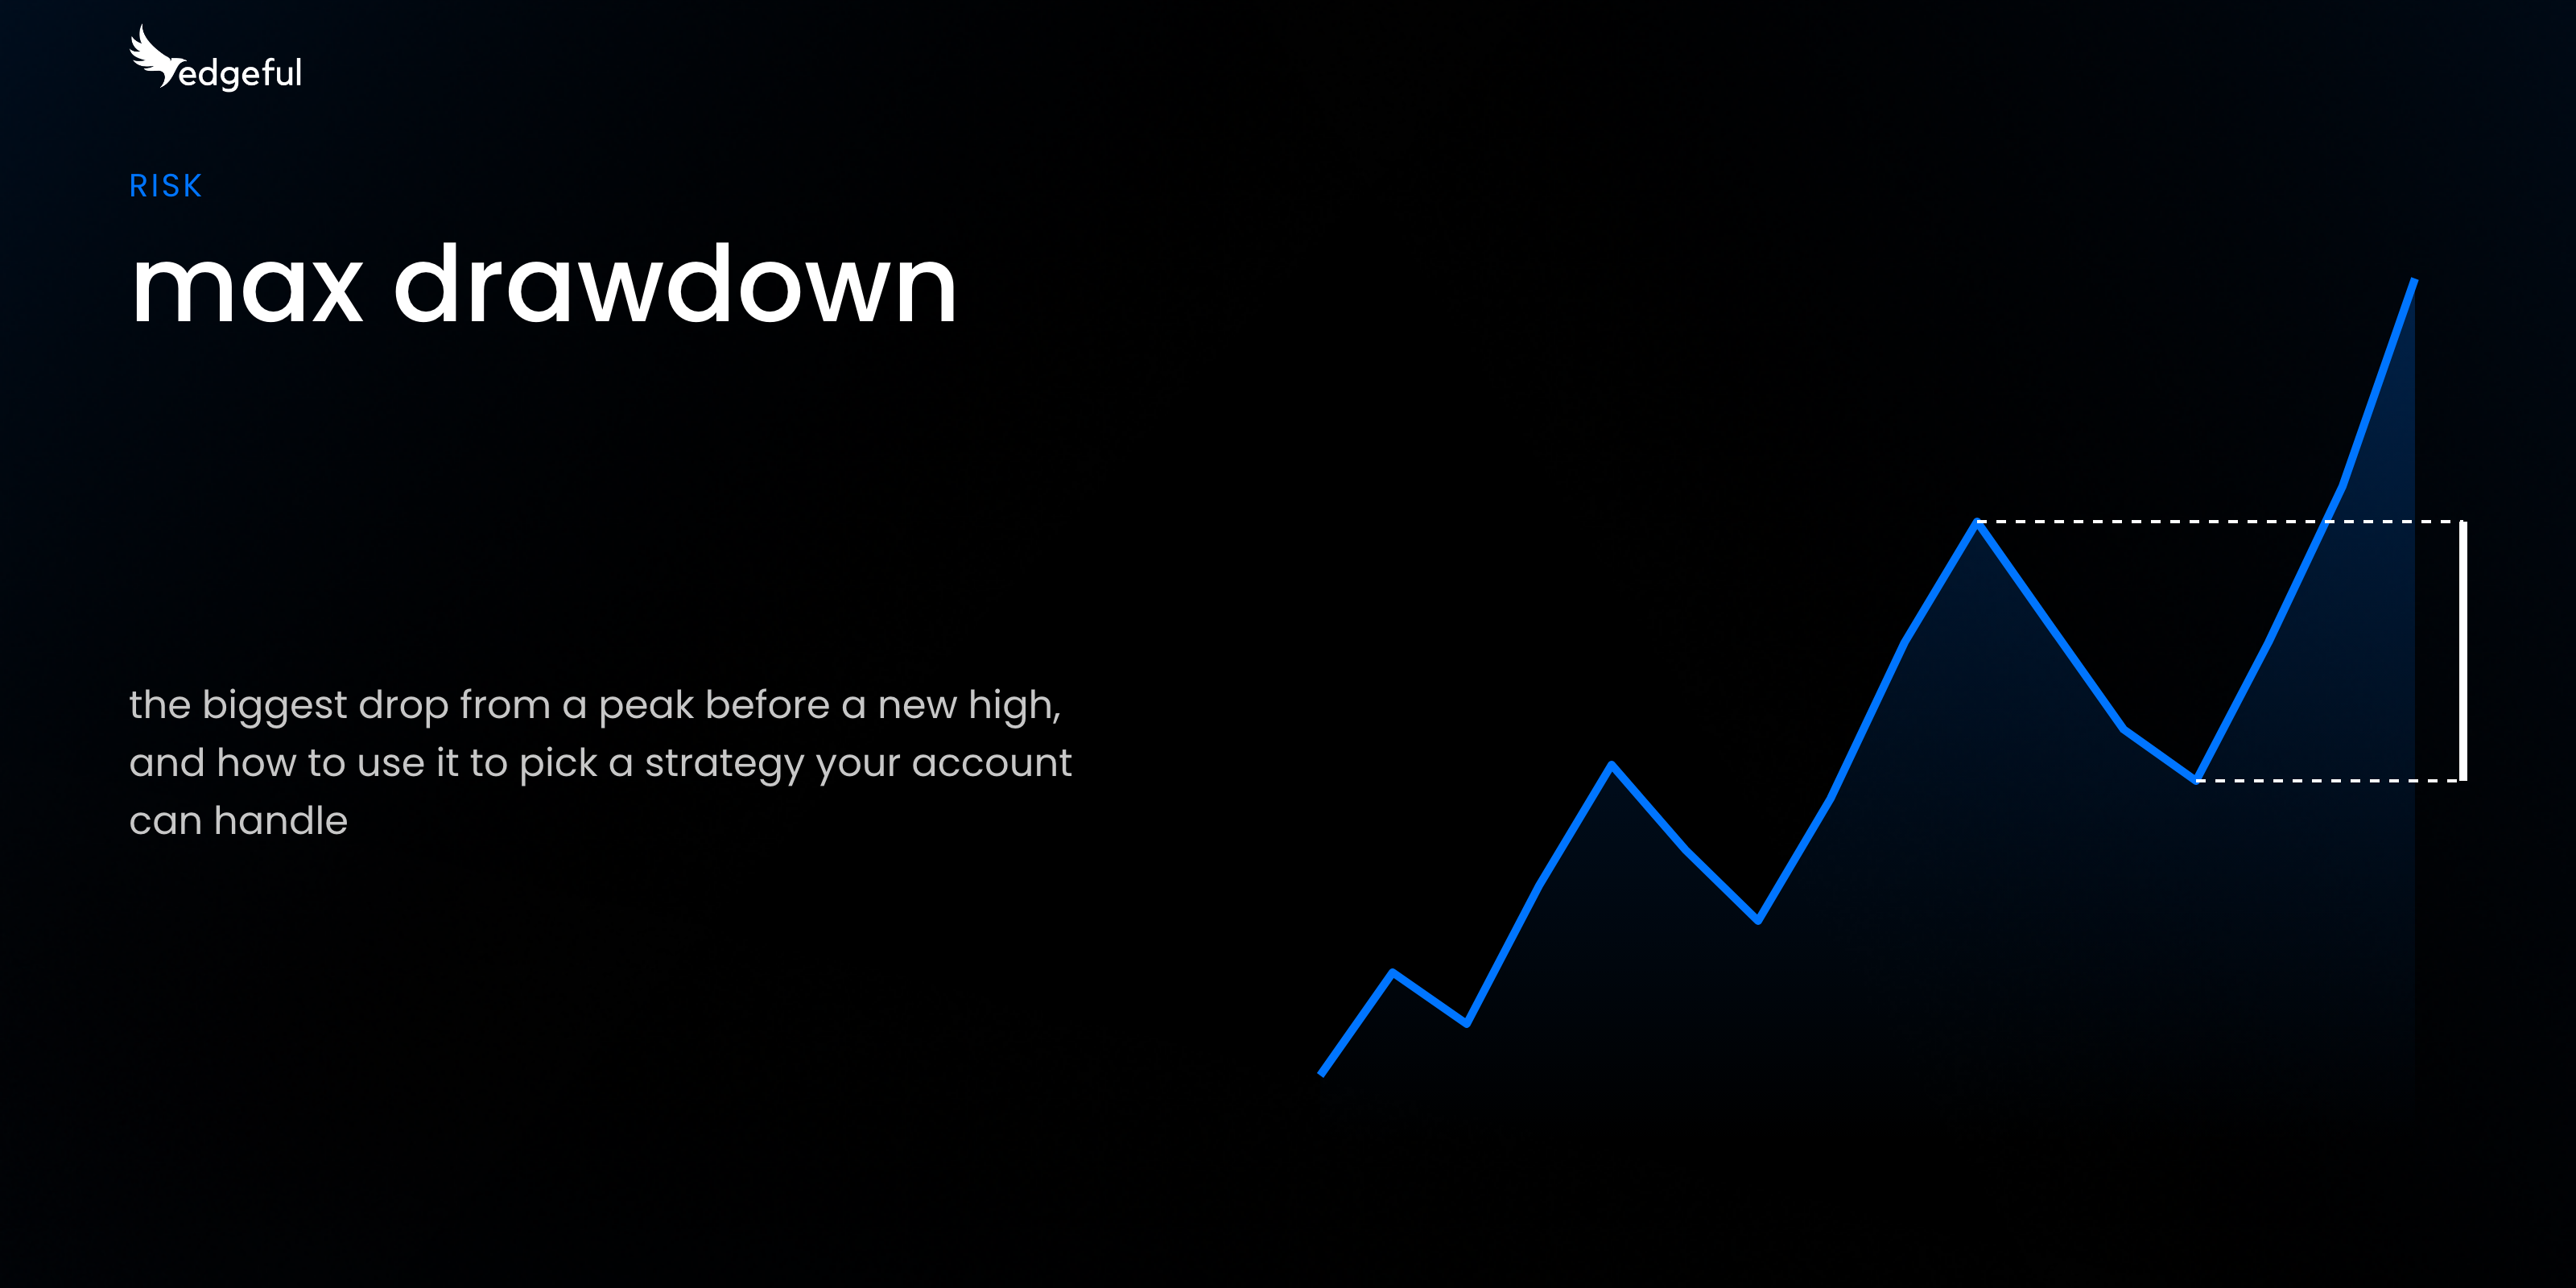
max drawdown is the biggest drop a strategy or account has taken from a high point to a low point before it made a new high. it's one of the first numbers you should check when considering trading algo strategies, or if you're backtesting your own strategies by hand.
most traders compare strategies by net P&L first. that's the number that looks best on a backtest. but the strategy with the biggest net P&L often carries the biggest drawdown too, and if that drawdown is bigger than your account or your prop firm allows, you'll never actually be able to be profitable long term.
this post covers what max drawdown is, how to calculate it, what it doesn't tell you, and how to compare it to profit. then I'll walk through how we use it to pick between real algo templates on edgeful, with numbers from the October 23, 2026 template set.
table of contents
- what is max drawdown?
- how to calculate max drawdown
- max drawdown vs drawdown vs current drawdown
- what max drawdown doesn't tell you
- max drawdown relative to profit
- max drawdown and trailing drawdown on a prop account
- how to use max drawdown to pick a trading strategy
- using max drawdown on edgeful's algo templates
- re-check max drawdown when the data changes
- key takeaways
what is max drawdown?
a drawdown is any drop from a high point in your account (a "peak") to a low point after it (a "trough"). every strategy has them. you win a few trades, hit a new high, then give some of it back.
max drawdown, also called maximum drawdown or MDD, is the single biggest of those drops over a period. it only counts the drop from a peak to the lowest point before the account gets back above that peak.
investors usually quote it as a percentage of the peak. futures traders usually care more about the dollar number, because that's what comes out of the account. a $1,500 drop takes $1,500 out of the account whether it's a $50k account or a $150k account.
if you're new to drawdown in general, here's our full guide on what drawdown is in trading, including the recovery math and how funds handle it. this post goes narrower: that one number, and how to use it to choose what to trade.
how to calculate max drawdown
the max drawdown formula is:
- max drawdown % = (trough value − peak value) ÷ peak value × 100
- max drawdown $ = peak value − trough value
you find every peak, find the lowest point after each one before the next new high, measure each drop, and keep the biggest.
here's a worked example with made-up numbers on a $50,000 account:
- the account climbs to $51,800 (peak 1), then drops to $50,900. that's a $900 drawdown, or 1.74% of the peak
- it climbs to a new high of $53,200 (peak 2), then drops to $51,700. that's a $1,500 drawdown, or 2.82%
- it climbs to $54,600 and ends the period there
the max drawdown is the $1,500 drop, because it's the biggest of the 2. the account made $4,600 over the period, and at its worst, it was $1,500 below a high it had already reached.
2 things trip people up when they calculate it by hand:
- the trough has to come after the peak. a low point before the account's high doesn't count against that high
- the drop resets at a new high. once the account gets back above peak 1, the next drop gets measured from the new peak, not from peak 1
in a backtest, you won't do this by hand. the software does it from the equity curve. but knowing how it's built tells you what the number covers.
max drawdown vs drawdown vs current drawdown
these 3 terms get mixed up a lot, so here's what each one means.
- drawdown: any single drop from a peak to a trough. a strategy can have dozens
- max drawdown: the biggest of those drops over the period you're looking at
- current drawdown: how far below its last peak the account is right now. if the account is at a new high, current drawdown is $0
when a backtest report says "max DD," it means the biggest drop over the whole backtest window. when a prop firm talks about drawdown, it usually means a limit on how far below a starting balance or a peak your account can go. that's a firm rule, covered further down.
what max drawdown doesn't tell you
it's one number for the worst drop. that makes it easy to compare, and it also means it leaves a lot out.
how often drawdowns happen
2 strategies can have the same $2,000 max DD. one hit it once and spent the rest of the time near its highs. the other had 6 drops between $1,500 and $2,000. the number is the same, and they'd feel very different to trade.
look at the equity curve too. a curve with lots of deep drops is harder to stick with, even if the worst one matches.
how long the drawdown lasted
the number only measures how deep the drop went. a $1,500 drop that recovers in 3 days and a $1,500 drop that takes 2 months to recover show up as the same number. the time it takes to get back to a new high is often what makes traders quit a strategy that was working.
the next drawdown can be bigger
a backtest's max DD is the worst drop that happened in that window. it isn't the worst drop that can happen. a longer window, a different market environment, or live fills can all produce a bigger one.
so plan for a drawdown at least this big, and leave room above it. this matters even more when the settings were optimized on that same data.
if you want more on why backtests can look better than live results, here's how to tell if you're backtesting wrong.
it scales with your size
the dollar number is tied to the size it was tested at. if a strategy showed a $900 drawdown on 1 contract, it's roughly $1,800 on 2 contracts and $2,700 on 3. DD/profit % stays the same, because the profit scales up too, but the dollars coming out of your account double and triple.
max drawdown relative to profit
a $2,000 max drawdown means one thing on a strategy that made $40,000 and something else on a strategy that made $3,000. so the next step is to compare it to what the strategy made.
the simplest way is to divide max DD by net profit. on edgeful, that's the DD/profit % column. lower means less drawdown for every dollar of profit. in the worked example above, that's $1,500 ÷ $4,600, or 32.6%.
you'll also see this as the "recovery factor," which flips it: net profit ÷ max DD. the same example has a recovery factor of 3.07. a higher recovery factor and a lower DD/profit % mean the same thing.
investors also use the Calmar ratio, which divides the yearly return by max DD. for a futures strategy over a 6 month backtest, DD/profit % or the recovery factor is easier to work with.
here's a quick comparison with made-up numbers:
- strategy A: made $10,000, max DD $4,000. DD/profit % = 40%
- strategy B: made $10,000, max DD $2,000. DD/profit % = 20%
- strategy C: made $1,000, max DD $100. DD/profit % = 10%
A and B made the same money, and B did it with half the drawdown.
but look at C. it has the best DD/profit % of the 3, and it made the least. DD/profit % tells you how efficiently a strategy made its money. it doesn't tell you whether the drawdown fits your account. you still check the dollar number for that.
where profit factor fits
profit factor is gross profit ÷ gross loss across all trades. a profit factor of 2.0 means the winners made twice what the losers lost. it tells you how much the winners outweighed the losers overall.
profit factor shows whether the winners outweighed the losers. max DD shows the worst drop along the way. a strategy can have a strong profit factor and still have a drawdown too big for your account, if the losers come in a cluster.
max drawdown and trailing drawdown on a prop account
if you trade a prop firm account, there's a second drawdown number in play: the firm's limit. go past it and the account is done, no matter how much the strategy would have made later.
prop firms usually set that limit one of 3 ways. the details vary by firm, so check your firm's rules:
- static drawdown: the limit is a fixed amount below your starting balance and doesn't move
- trailing drawdown: the limit follows your account's highest balance up. at many firms it counts open profit too, so a trade that runs up and comes back can move the limit against you
- end-of-day trailing drawdown: the limit follows your highest closing balance, so moves during the day don't drag it up
on a trailing drawdown, your strategy's drawdown has to fit inside the firm's limit at the size you'll trade. the limit moves up behind your best balance, so the drop that matters is the one from your peak.
one catch: a backtest's max DD is usually measured on closed trades. if your firm trails on open profit, the drop that counts can be bigger than the closed-trade max DD, because a trade can run up and come back before it closes.
here's an example with made-up numbers. a $50k prop account has a $2,000 trailing drawdown. the strategy you want to run showed a $900 max DD on 1 contract:
- 1 contract: $900 max DD, 45% of the $2,000 limit
- 2 contracts: $1,800 max DD, 90% of the limit
- 3 contracts: $2,700 max DD, past the limit
on paper, 2 contracts fits. in practice, 90% of the limit leaves almost no room for the next drawdown to be bigger than the backtest's, and as covered above, it can be. 1 contract leaves room.
if you're working through an evaluation, here's more on passing prop firm evaluations with data-backed strategies. and if you want to see how many losses in a row your account can take at your current size, try our trading risk calculator.
how to use max drawdown to pick a trading strategy
putting it together, here's the order I'd check things in before running any strategy:
- set your limit first. know the most your account can lose before you look at any backtest: your prop firm's drawdown, or the amount you're actually willing to lose on a personal account
- check max DD in dollars, at your size. multiply by your contract count. if it's close to your limit, size down or skip it
- compare it to profit. between strategies that fit, a lower DD/profit % (a higher recovery factor) means less drawdown for every dollar made
- check the out-of-sample results. if the settings were optimized, look at how they did on data they weren't optimized on, and whether the drawdown got worse
- check the trade count. a max DD from 20 trades tells you less than one from 200
using max drawdown on edgeful's algo templates
on edgeful, the algo templates are the algo optimizer's top runs for each algo, across 12 tickers, in the New York and London sessions. each template is built on the latest 6 months of data, and a new set comes out every 2 weeks. here's more on what the templates are.
the templates page shows net P&L, win %, profit factor, max DD, and DD/profit % for every template. here's how I'd use it. the numbers below are according to edgeful data from the October 23, 2026 set (backtest window April 23 to October 23, 2026, New York session).
step 1: filter to your ticker and session
start with what you actually trade. filter the page to your ticker and session, like MNQ in the New York session. everything below compares templates you'd actually run.
step 2: sort by DD/profit %, then check max DD in dollars
click the DD/profit % column and the lowest numbers come up first (it's the recovery factor flipped). then check each template's max DD against your account limit, at the size you'd trade.
here are 2 real YM templates from the October 23 set (New York session):
- engulfing candle strategy, 2 tp (15m): +$23,465 net P&L, max DD -$2,970, DD/profit % 12.7%
- orb strategy (5m): +$13,685 net P&L, max DD -$1,380, DD/profit % 10.1%
the engulfing template made more, and the orb template made its money with less drawdown for every dollar. on a $2,000 trailing drawdown, only one of them fits at these settings: the orb template's -$1,380 max DD sits under the limit, and the engulfing template's -$2,970 doesn't.
the DD/profit % column on its own wouldn't tell you that. here's the same point on 2 more templates from the set:
- NQ, engulfing candle strategy, 2 tp (5m): +$37,265, max DD -$4,110, DD/profit % 11.0%
- MYM, orb strategy (5m): +$1,846, max DD -$176, DD/profit % 9.5%
both have a low DD/profit %. one has a max DD more than twice a $2,000 limit, and the other is a fraction of it. so sort by DD/profit % first, then check each max DD against your limit.
step 3: check the out-of-sample drawdown/profit
every template is built on 6 months of data. the optimizer finds settings on the first 80% of that window, then runs those settings on the last 20%, about 5 weeks it never optimized on. that's the out-of-sample part, and it's the part I care about most, because it shows whether the settings held up on new data.
click into any template to see it. here's the engulfing candle strategy on MCL (New York session, 15m chart), the top template by score in the October 23 set:
over the full backtest, it made +$1,871 on 97 trades with a max DD of -$274, a 59.8% win rate, a 2.50 profit factor, and a DD/profit % of 14.6%.
in its 19 out-of-sample trades, the win rate (63.2%) and profit factor (2.83) were both better than the full backtest. drawdown/profit got worse: 24%, up from 14.6%.
on data the settings never saw, drawdown relative to profit came in higher than the full backtest showed, even though the win rate and profit factor held up.
19 trades is a small sample, and the page says so. if a template's out-of-sample results fall apart, I'd skip it.
step 4: size it, then test it on sim
load the template as-is, or customize the settings. then set your size so the max DD, with room to spare, fits your limit.
run it on a sim account first and watch a few trades before you go live, so you get used to sitting through the drawdowns before real money is on the line.
these are backtests, and the templates are a starting point. results take setup time, customization, and testing, and even a template that fits your account will have losing days.
re-check max drawdown when the data changes
a new template set comes out every 2 weeks, built on the latest 6 months. as the window moves, the trades in it change, and so do the max DD, the net P&L, and the DD/profit %.
if you're already running a template and it's working live, a new set isn't a reason to switch. the new set is worth a look when:
- you haven't picked a template yet
- the one you're running has a bigger drawdown or a longer losing streak than its backtest showed
- you want to add a second ticker or algo
if a live drawdown goes past the backtest's max DD, that's a good time to re-check the settings against the latest data.
you'll find the algo templates in all access, next to the algos, the optimizer, and the analyzer. see how the edgeful algos work.
key takeaways
- max drawdown is the biggest drop from a peak to a trough before a new high. for futures traders, the dollar number is what hits your account
- calculate it by measuring every drop from a peak and keeping the biggest. the drop resets at each new high
- a backtest's max drawdown is a starting estimate. the next drawdown can be bigger, so leave room above it
- compare max drawdown to profit with DD/profit % (or its inverse, the recovery factor), then check the dollar max DD against your limit
- on a trailing drawdown, your strategy's max drawdown at your size has to fit inside the firm's limit with room to spare
- on the October 23, 2026 set, the MCL engulfing candle template's drawdown/profit went from 14.6% in the full backtest to 24% out of sample, so check the out-of-sample drawdown before you size up
- check profit factor and max drawdown together: a strong profit factor doesn't mean the drawdown fits your account
edgeful provides historical performance data to help traders make informed decisions. this does not constitute financial advice. past performance is not indicative of future results. all trading involves risk. always do your own analysis and manage your risk accordingly.
