
custom trading reports: build any report you can describe with AI
custom trading reports let you test the setups that don't have a report yet. you describe a setup, pattern, or market behavior in plain English, and edgeful AI builds the report on your ticker, your session, and your timeframe.
we launched custom reports in August, and I built my first one live that morning. this post walks through that exact build, start to finish, updated for how the custom report builder works today. by the end you'll know how to build custom trading reports of your own, check that they measure what you meant, and run them on any ticker going back up to 8 years.
the example is a simple one: NQ opening outside the prior NY session's range and traveling all the way to the other side. according to edgeful data, over the last 6 months in the NY session, that full trip was rare. the exact numbers are further down.
table of contents
- what custom trading reports are
- the example: does NQ reverse through the prior day's range?
- step 1: describe the custom report in plain English
- step 2: check the methodology before you save
- step 3: get your columns right, then save
- step 4: run your custom trading report on any ticker or session
- what the NQ data shows
- building custom trading reports through the API and MCP
- 3 mistakes to avoid with custom trading reports
- more custom trading reports worth building
- key takeaways
what custom trading reports are
edgeful already has 150+ reports: gap fills, initial balance, opening range breakouts, and the rest. they cover the most common futures setups.
but every trader has a question the prebuilt reports don't answer. "how often does the high get set in the first 30 minutes on Fridays?" "after 3 green days on NVDA, is day 4 more likely red?" before custom reports, the answer was to scroll through months of charts and count by hand, or skip the question.
the questions custom trading reports answer tend to sound like:
- how often does X happen?
- given this scenario, what plays out next?
you write the question, the custom report builder writes and checks the logic, and you get a report you can load on any ticker, any session, and any date range going back up to 8 years. there's no limit on how many custom reports you can build.
the example: does NQ reverse through the prior day's range?
when I built my first one, I started from one of the prebuilt templates in the custom report builder:
"how often does the New York session engulf the prior New York session's range?"
in plain English: when NQ opens above the prior session's high, how often does it reach all the way down and touch the prior session's low? and the reverse when it opens below the prior session's low.
if you carry a bias into the open, this tells you how much of the prior day's range is actually in play against you. and if you use the prior day's high and low as targets, it puts a number on how often the far side actually got touched. (here's more on how the prior day's range gets misread.)
step 1: describe the custom report in plain English
open edgeful AI and click custom reports. that's where every build starts.
you'll see prebuilt templates if you want somewhere to start, or you can type your own question. write it the way you'd explain it to another trader: the condition, the outcome, and what you want counted.
one tip before you run anything: use the improve prompt button. write your main point, click it, and edgeful AI rewrites your prompt with the details filled in.
then read the improved version before you hit go, and make sure it still says what you meant. this is the easiest place to catch a detail you didn't intend, before any logic gets built.
step 2: check the methodology before you save
this is the step I'd tell you never to skip.
before anything gets saved, edgeful shows you a methodology check:
- what the report measures, scenario by scenario
- every assumption it's making
- a sample results table covering the last 6 months
for this report, the methodology check spelled out the rules. the session open gets compared with the prior session's high and low. "touched" means any candle in the session, wicks and the first candle included, traded at or through the opposite extreme. sessions that open inside the prior range get counted separately and left out of the touch numbers.
the sample table is where you verify the logic. pull a few of those dates on your own chart and confirm the report matches what you meant.
here's what that looked like on my run. Aug 7 was marked "opened above the prior high, didn't touch the opposite extreme." I pulled the chart: correct. July 15 was marked as a touch: opened above, then broke the prior session's low. also correct.
if a row looks wrong, don't just tell it "this is wrong." give it the specific day and what you're seeing on your chart, and it re-checks the logic.
step 3: get your columns right, then save
you can still change anything at this stage. I wanted the weekday in the output, so I asked for a weekday column, and the custom report builder re-ran the calculation with the column added. same for renaming columns or adding anything else you want tracked.
do all of this before you save. a saved report can't be edited afterward. if you realize later that you wanted another column, you'll copy the prompt and build it again.
step 4: run your custom trading report on any ticker or session
once it's saved, your custom report sits with the rest of your reports in edgeful AI. you load it like any other report edgeful AI can read.
from there you choose the ticker, the session, and the date range, going back up to 8 years. the logic stays the same, so the same custom trading report works on NQ, ES, GC, or a stock, in the NY session or London.
that's the part that makes custom reports useful week to week. you build the question once, then re-run it whenever the market environment shifts.
what the NQ data shows
here's what came back on NQ, NY session (9:30 AM to 4:00 PM ET), over the last 6 months (Apr 29 to Oct 29, 2026). "prior session" here means the prior NY session's high and low, not the overnight extremes:
- 131 sessions evaluated
- opened above the prior session's high: 35 sessions. price came back down to touch the prior session's low in 2 of them (5.71%)
- opened below the prior session's low: 26 sessions. price came back up to touch the prior session's high in 2 of them (7.69%)
- opened inside the prior session's range: 70 sessions (not counted in the touch %)
the 4 sessions that did reach the other side were May 26, June 22, July 6, and July 15.
so when NQ opens above the prior session's high, the data shows a full trip down to the prior session's low has been rare. same story the other way: an open below the prior session's low that ran all the way through the prior session's high happened twice in 6 months.
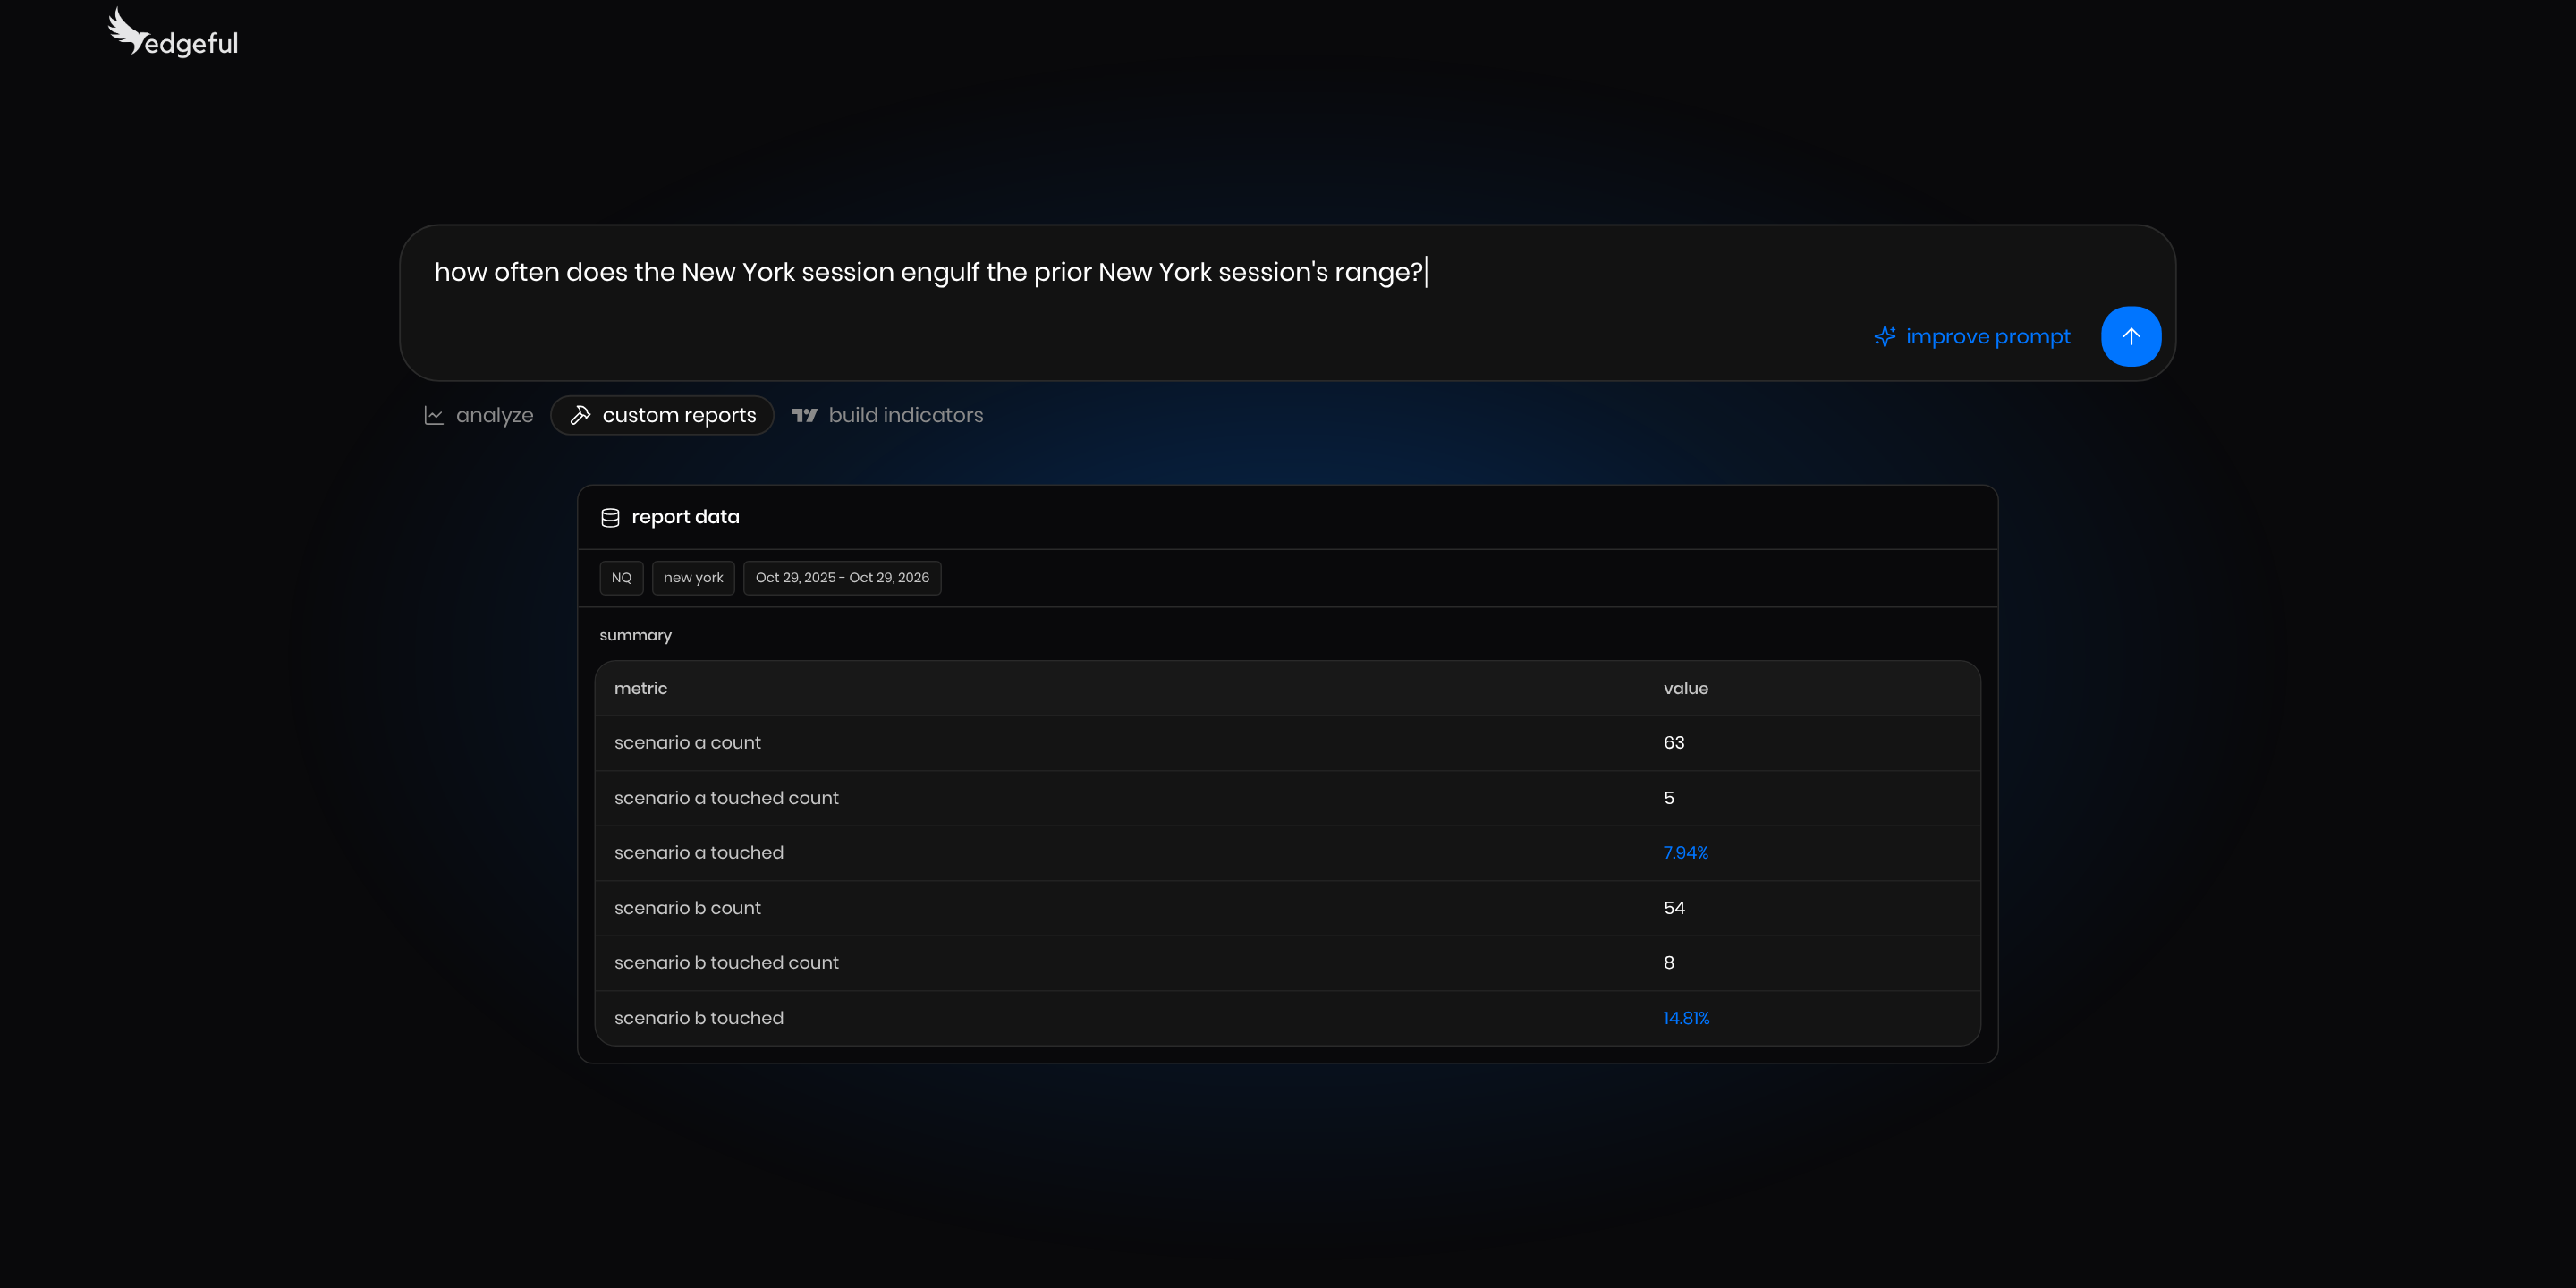
now the same custom trading report over the last 12 months (Oct 29, 2025 to Oct 29, 2026):
- 258 sessions evaluated
- opened above the prior session's high: 63. touched the prior session's low in 5 (7.94%)
- opened below the prior session's low: 54. touched the prior session's high in 8 (14.81%)
- opened inside the prior session's range: 141
the 12-month numbers are higher on both sides, and the open-below side nearly doubles. the numbers move with the market, so re-run your custom trading reports as the market environment shifts.
building custom trading reports through the API and MCP
you don't have to be inside the platform to build custom trading reports.
if you work in Claude or another AI tool, you can connect it to edgeful through the edgeful MCP and build custom reports from there. you describe the report in your own chat, edgeful builds and validates the logic, and you get the same methodology and sample table back to review before you save. saved reports show up in your custom reports in edgeful AI.
we rebuilt the report in this post that way: described the prior day's range question in a chat, reviewed the methodology, saved it, and ran it on both windows above.
if you're building your own dashboards or tools, the edgeful API is where to start.
3 mistakes to avoid with custom trading reports
mistake 1: writing a vague prompt
"does NQ reverse a lot?" leaves the AI guessing at the condition, the outcome, and what to count. "when NQ opens above the prior NY session's high, how often does it touch the prior session's low?" gives it all 3.
if you're not sure your prompt is specific enough, use the improve prompt button and read what it adds.
mistake 2: skipping the sample table
the methodology can read correctly and still not match what you meant. maybe "touch" counts the first candle and you wanted it excluded. maybe the session window isn't the one you trade.
checking 2 or 3 dates against your own chart takes a couple of minutes, and it's how you know the custom report counts what you meant.
mistake 3: saving before the output is complete
saved reports can't be edited. if you want a weekday column, a time column, or a different label, ask for it before you save. otherwise you're rebuilding from the prompt.
more custom trading reports worth building
here are a few questions from custom reports we've built on our own account, worth trying on your ticker:
- "how much of NQ's range is already done by 10:30 AM?"
- "does the 10 AM reversal actually exist on NQ?"
- "when NQ's high or low is set early, how does the day close?"
- "after a Friday outside day, how often does Monday's first hour touch Friday's high?"
each one is a single sentence in the custom report builder. run them, check the methodology, and see what the data says on your market.
if you want a refresher on what edgeful AI can do beyond custom reports, here's the full rundown on edgeful AI.
a custom report gives you a number, and building a process around it, sizing it, and sticking to it when the setup shows up still takes time, customization, and screen reps. the more specific your questions get, and the more you check the answers against your chart, the more useful your custom reports get. if you're working on trading from data instead of emotion, building your own reports is a good place to practice it.
key takeaways
- custom trading reports let you describe any setup in plain English and get a report built on your ticker, session, and timeframe
- start in edgeful AI → custom reports, and use the improve prompt button, then read what it added
- the methodology check is the step you never skip: check 2 or 3 sample dates against your own chart
- add every column you want before saving, since saved custom reports can't be edited
- over the last 6 months on NQ in the NY session, an open above the prior NY session's high touched that session's low in 2 of 35 sessions (5.71%), and an open below the prior session's low touched its high in 2 of 26 (7.69%)
- on NQ in the NY session over 12 months (Oct 29, 2025 to Oct 29, 2026), those numbers were 7.94% and 14.81%, so keep re-running your custom trading reports as the market environment shifts
- you can also build custom reports from Claude or another AI tool through the edgeful MCP
you can see how custom reports work and start your first build at edgeful.com/features/custom-reports.
edgeful provides historical performance data to help traders make informed decisions. this does not constitute financial advice. past performance is not indicative of future results. all trading involves risk. always do your own analysis and manage your risk accordingly.
