algo trading optimization: the tools that replace Excel for strategy analysis
algo trading optimization is the step most traders skip entirely. not because they don't want to do it, but because the process takes too long and the barrier to getting started is too high.
we built two tools that change this. algo templates give you a starting point for any ticker and strategy. the algo analyzer takes your TradingView backtest export and runs the full optimization, instantly. the process of going from "I just started algos" to "I have an optimized strategy I'm ready to automate" went from 2-3 hours to about 15 minutes.
here's how both tools work and what they replace.
table of contents
- the problem with algo trading optimization in Excel
- algo templates: your starting point for algo trading optimization
- the algo analyzer: algo trading optimization in one upload
- the full algo trading optimization workflow
- key takeaways
- frequently asked questions
the problem with algo trading optimization in Excel
here's what algo trading optimization actually looks like when you do it manually.
you export your trade log from TradingView. you open Excel. you build pivot tables to find your losing weekdays. you sort by drawdown to figure out your max loss threshold. you calculate profit target ratios. you repeat it for every single strategy you run.
that's 6 steps and 30+ minutes of backtesting analysis per strategy, even if you've already watched the optimization video and know what you're doing.
most traders don't even get that far. they see the optimization process, realize how much work it is, and never run the algo at all. they get lost before they ever get to a strategy worth automating.
the optimization itself isn't hard. but the barrier to getting started is high enough that most people never do. and that's the real problem. if you've ever felt like Excel is too much work for what should be a straightforward analysis, you're not alone.
so we built two things that fix this from both sides.
algo templates: your starting point for algo trading optimization
the first tool is algo templates.
templates are pre-built starting points for specific tickers and strategies. they're not 100% optimized, and they're not meant to be. but they give you real settings to start from instead of staring at a blank screen trying to figure out where to begin.
here's how they work.
pick a template and click on it. you'll see the ticker and the algo it's built for. scroll down to the settings. they're laid out to match TradingView's inputs one to one. open TradingView and input those settings directly. run the backtest and download the .xlsx file.
here are the templates available right now:
- ORB: MES 5min, MES 15min, MNQ 5min
- IB standard: M2K
- IB breakeven stop: MGC
- engulfing: MGC 5min, MES 5min, MYM 5min
if you're new to edgeful's algo strategies, we have a full breakdown of how each algo trading strategy works and when to use it.
now you have a starting place, and even more importantly, something to optimize. that's where the analyzer comes in.
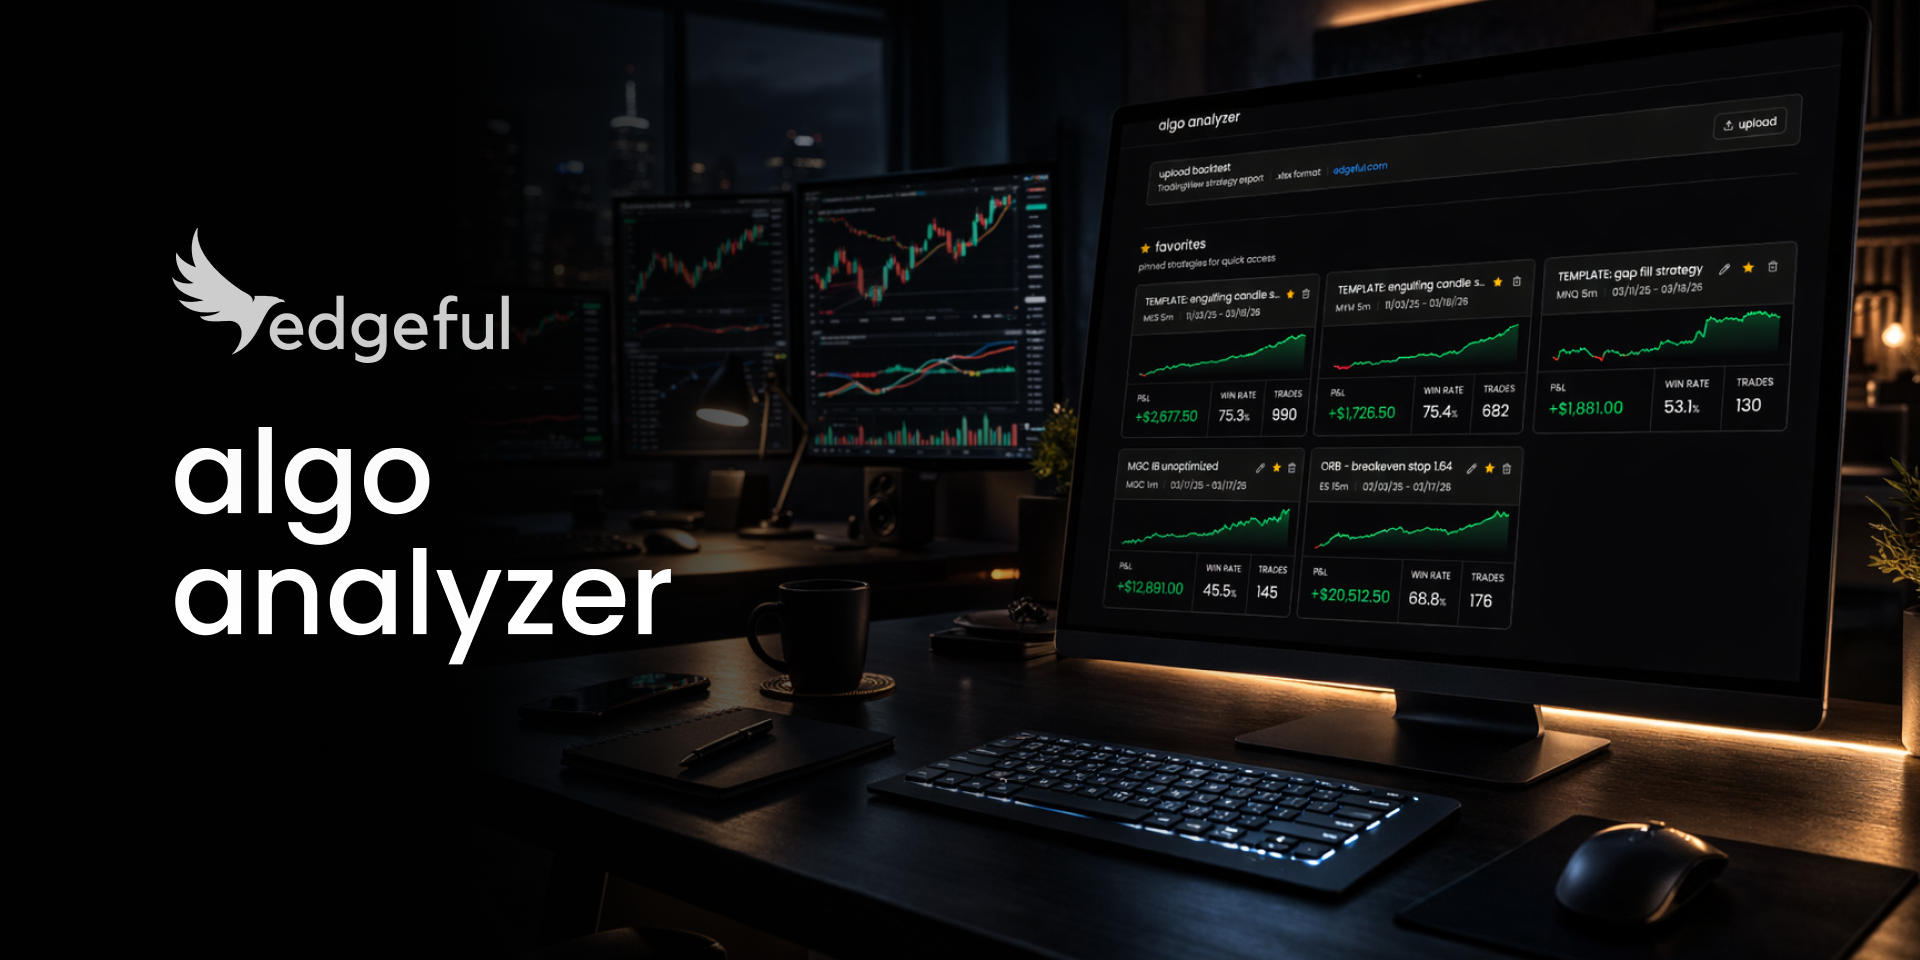
the algo analyzer: algo trading optimization in one upload
the algo analyzer takes your TradingView backtest export (the .xlsx file) and gives you everything you need for algo trading optimization. instantly.
upload the file. the analysis loads. it saves automatically so you can come back to it anytime. no Excel. no pivot tables. no formulas. one upload.
if you're running multiple strategies, each one gets saved to your library. you can favorite them, rename them, and switch between them without re-uploading.
the analyzer has 5 features. each one replaces a piece of the manual backtesting analysis and trading strategy optimization process, and several of them do things Excel can't do at all.
strategy analysis
the first thing you'll see after uploading is a full breakdown of your strategy.
equity curve, net profit, win rate, profit factor, max drawdown, average win vs. average loss. all the core metrics you'd normally have to calculate or pull from TradingView's summary.
but it goes deeper. you get a P&L breakdown with monthly and weekly views so you can see which periods are working and which aren't. you get streak analysis, trade duration stats, and a weekday × direction breakdown that shows you exactly which day/direction combos are making money and which are bleeding.
this is the backtesting analysis that takes the longest when you're doing algo trading optimization in Excel. here it loads in seconds.
Monte Carlo simulation
your backtest shows you one outcome. one specific sequence of trades. but what if you drew from that same pool of trades randomly, some trades repeating, others left out entirely, and ran it 1,000 times?
that's what Monte Carlo simulation answers.
the analyzer resamples your trades 1,000 times. each simulation draws trades randomly from your results (with replacement, so some trades show up multiple times and others don't appear at all). each one produces a different equity curve with a genuinely different final P&L.
each line on the chart is one possible outcome. the blue line in the middle is the median, what you'd expect on average. you can toggle between 100, 250, 500, or 1,000 visible paths.
if your strategy ends profitable in 90%+ of those simulations, you've got something real. if it's only profitable in 50% of them, your backtest just happened to land on a good run. your single backtest can't tell you which one you're sitting on. Monte Carlo can.
if you want to understand why a single backtest isn't enough for trading strategy optimization, we covered backtesting best practices and common mistakes in a separate post.
the analyzer gives you a verdict: "strong advantage," "likely advantage," "borderline," or "no clear advantage," based on how many of the 1,000 simulations end profitably.
there's also a risk of ruin calculator. pick a drawdown threshold ($1,000, $2,500, $5,000) and the analyzer tells you what percentage of simulations would hit that level. so you know before you go live how much risk you're actually taking.
minimum requirement for useful algo backtesting with Monte Carlo: 30 trades. below that, the simulation isn't statistically meaningful, so the analyzer disables it.
prop firm validation
if you're trading a funded account or thinking about starting a challenge, this feature matters.
the analyzer simulates whether your strategy would pass the evaluation at 8 different prop firm configurations:
Apex (intraday trailing + EOD trailing), Topstep, Tradeify (Growth + SELECT), MyFundedFutures, and Lucid (Flex + Pro).
for each firm, you pick your account size and the analyzer runs your trades through the actual challenge rules. trailing drawdown limits, profit targets, consistency rules, daily loss pauses, drawdown floor locks. every rule is enforced exactly as the firm applies it.
you get a pass rate, a failure breakdown, the average and fastest number of trades to pass, and a survival curve showing what percentage of simulated accounts are still alive at each trade number.
it also flags position sizing risks. if your largest loss is too close to the drawdown limit, the analyzer warns you before you find out the hard way during a live challenge.
before this, the only way to know if your strategy would pass a challenge was to pay the fee and find out. now you can test it first. for more on managing risk in futures trading, check out our 9 risk management rules that prevent blown accounts.
overfit detection
most traders have never even thought about this one. but it's a critical part of trading strategy optimization.
a strategy can look amazing in a backtest and still be overfit. meaning it works on historical data because it's been tuned too perfectly to past conditions, but it falls apart in live trading.
the analyzer runs 6 stress tests on every backtest:
- profit factor check: is it suspiciously high? a profit factor over 4.0 is a red flag.
- win rate check: is it unrealistically high? above 85% is unusual in live trading.
- concentration risk: are your top 5% of trades responsible for 80%+ of your profit? if so, remove those outliers and the strategy collapses.
- return consistency: are less than 40% of your months profitable? a strategy that makes all its money in 2 hot months and bleeds the rest is fragile.
- performance decay: is the second half of your backtest significantly worse than the first? that's a sign the strategy is degrading over time.
- drawdown / profit ratio: is your max drawdown eating up most of your profit? if one bad stretch could erase your gains, that's a warning sign.
each check returns pass, warn, or fail. you get an overall risk level: low, medium, or high. most traders look at a backtest, see a good profit factor and win rate, and assume the strategy works. these 6 checks tell you if that assumption is safe.
drawdown analysis + optimization suggestions
the last piece covers the work Excel can do, but the analyzer does it instantly.
drawdown analysis answers: "where should I set my max loss?"
the analyzer tests every possible max loss threshold and tells you which level improves your P&L the most. not a guess. the data shows exactly where to set it.
it also shows you the average drawdown of your winners and the average runup of your losers. that context helps you understand what "normal" looks like for your strategy.
the optimization suggestions go a step further. the analyzer scans your trades and flags specific combos that are losing money.
Thursday longs losing $443 across 12 trades? it tells you to turn those days off. Friday longs losing $329 across 12 trades? same thing.
these are the exact same optimizations you'd do manually in Excel for backtesting analysis. filtering weekdays, sorting by time, calculating directional P&L. the difference is you don't have to do any of it yourself.
the full algo trading optimization workflow
here's the full algo trading optimization workflow from start to finish.
- pick an algo template for your ticker and strategy. input the settings into TradingView.
- run the backtest in TradingView's strategy tester. download the .xlsx export.
- upload that file to the algo analyzer.
- work through the tabs: strategy analysis, Monte Carlo simulation, prop firm validation. use the data to identify what needs to change.
- check the optimization suggestions. turn off the day/direction combos that are losing money. adjust your max loss based on the drawdown analysis.
- re-run the backtest with your updated settings and upload again to verify the improvement.
if you already have a strategy you're running, skip straight to step 2.
for a complete guide to getting started with automated trading strategies, we have a separate walkthrough that covers the full setup process.
one thing to be clear about: these tools show you the data. the templates give you a place to start. the analyzer tells you which weekdays are losing, where your max loss should be, whether your strategy is overfit, and what your prop firm pass rate looks like.
but you still have to make the decisions. market conditions change, and the data will change as a result. trading strategy optimization is still work. these algo backtesting tools just remove the barriers that stopped most people from doing it.
key takeaways
- algo trading optimization used to take 2-3 hours per strategy in Excel. with algo templates + the algo analyzer, that process takes about 15 minutes
- algo templates give you pre-built starting points for specific tickers and strategies so you're not starting from a blank screen
- the algo analyzer takes your TradingView backtest export and runs strategy analysis, Monte Carlo simulation, prop firm validation, overfit detection, and drawdown analysis with one upload
- Monte Carlo simulation tells you whether your strategy has a real edge or if your backtest just happened to land on a good run
- prop firm validation runs your trades through actual challenge rules at 8 configurations so you can test before paying a fee
- overfit detection runs 6 stress tests on your backtest to flag strategies that look good on paper but may not hold up in live trading
- the optimization suggestions flag specific day/direction combos that are losing money, like Thursday longs losing $443 across 12 trades, so you know exactly what to turn off
algo trading optimization results depend on your specific strategy, settings, and market conditions. edgeful provides data and analysis tools, not guaranteed outcomes. past backtest performance does not guarantee future results.