5 minute opening range breakout on ES: 108% return in 6 months
the opening range breakout is one of the most popular intraday setups in futures trading. but most traders default to a 15-minute window without ever questioning whether that's the best timeframe for the job. the 5 minute opening range breakout uses a tighter window — just 09:30 to 09:35 ET — and on ES, the results over the last 6 months tell a very different story than the standard 15-minute version.
we put together a free playbook that walks through this exact setup. over 500 traders downloaded it in the first week. today I'm going to break down why the 5 minute opening range breakout works on ES, what settings produced a 108% return on a $10k account, and how you can take it further with your own customization.
table of contents
- what is the 5 minute opening range breakout
- why 5 minutes instead of 15 on ES
- the backtest results: 5 minute opening range breakout on ES
- the two settings that moved the numbers
- how the analyzer flagged the edge
- opening range breakout profit targets and stop loss settings
- this isn't fully optimized — and that's the point
- common mistakes traders make with the opening range breakout
- how to build your own 5 minute opening range breakout strategy
- key takeaways
what is the 5 minute opening range breakout
the opening range breakout is a strategy built around the first few minutes of the trading session. the market opens, creates a range during a defined window, and when price breaks above or below that range, you trade in the direction of the break.
the "opening range" is just the high and low of that initial window. the standard version uses 15 minutes — 09:30 to 09:45 ET. the 5 minute opening range breakout shrinks that window to just 09:30 to 09:35.
that shorter window changes everything about the trade. the range is tighter. the risk is smaller. and the entry comes earlier.
according to edgeful data, the 5 minute opening range breakout on ES during the NY session has been one of the stronger ORB variations over the last 6 months. the key is that ES responds well to that initial burst of the session — the first 5 minutes capture the directional momentum without letting the range expand too much.
if you're already familiar with the ORB concept, we covered the broader strategy in our post on opening range breakout (ORB) trading strategy. this post goes deeper on the specific 5-minute variation and the exact settings that produced the results below.
why 5 minutes instead of 15 on ES
most traders run the opening range breakout on a 15-minute window because that's what they've seen in books and courses. and it works — but it comes with trade-offs that most people never think about.
a 15-minute range is wider. that means your stop loss is larger (because the stop sits at the opposite edge of the range). it also means you're waiting 15 minutes for the levels to set before you can enter.
the 5 minute opening range breakout flips both of those.
tighter range = smaller stops
when the range is defined by just 5 minutes of price action, it's naturally narrower. your stop loss — which sits at the opposite edge of the opening range — is smaller. smaller risk per trade means you can size appropriately without overexposing your account.
on ES, the 5-minute window captures the initial burst of the NY session open without letting the range balloon. the first 5 minutes tend to reflect the gap reaction and the first wave of institutional flow. by 09:35, you have a clean range.
earlier entries
instead of waiting until 09:45 for the range to set, you're locked in by 09:35. that gives you 10 extra minutes of potential move before other ORB traders even have their levels defined.
this matters because the strongest breakout moves on ES tend to happen in the first 30-60 minutes of the session. the earlier your range is set, the more of that move you capture.
it's ticker-specific
I want to be clear: the 5 minute opening range breakout doesn't outperform the 15-minute version on every ticker. ES responds particularly well to the 5-minute window. other instruments may behave differently — which is why testing matters. the point isn't that 5 minutes is always better. the point is that on ES, the data says it is.
the backtest results: 5 minute opening range breakout on ES
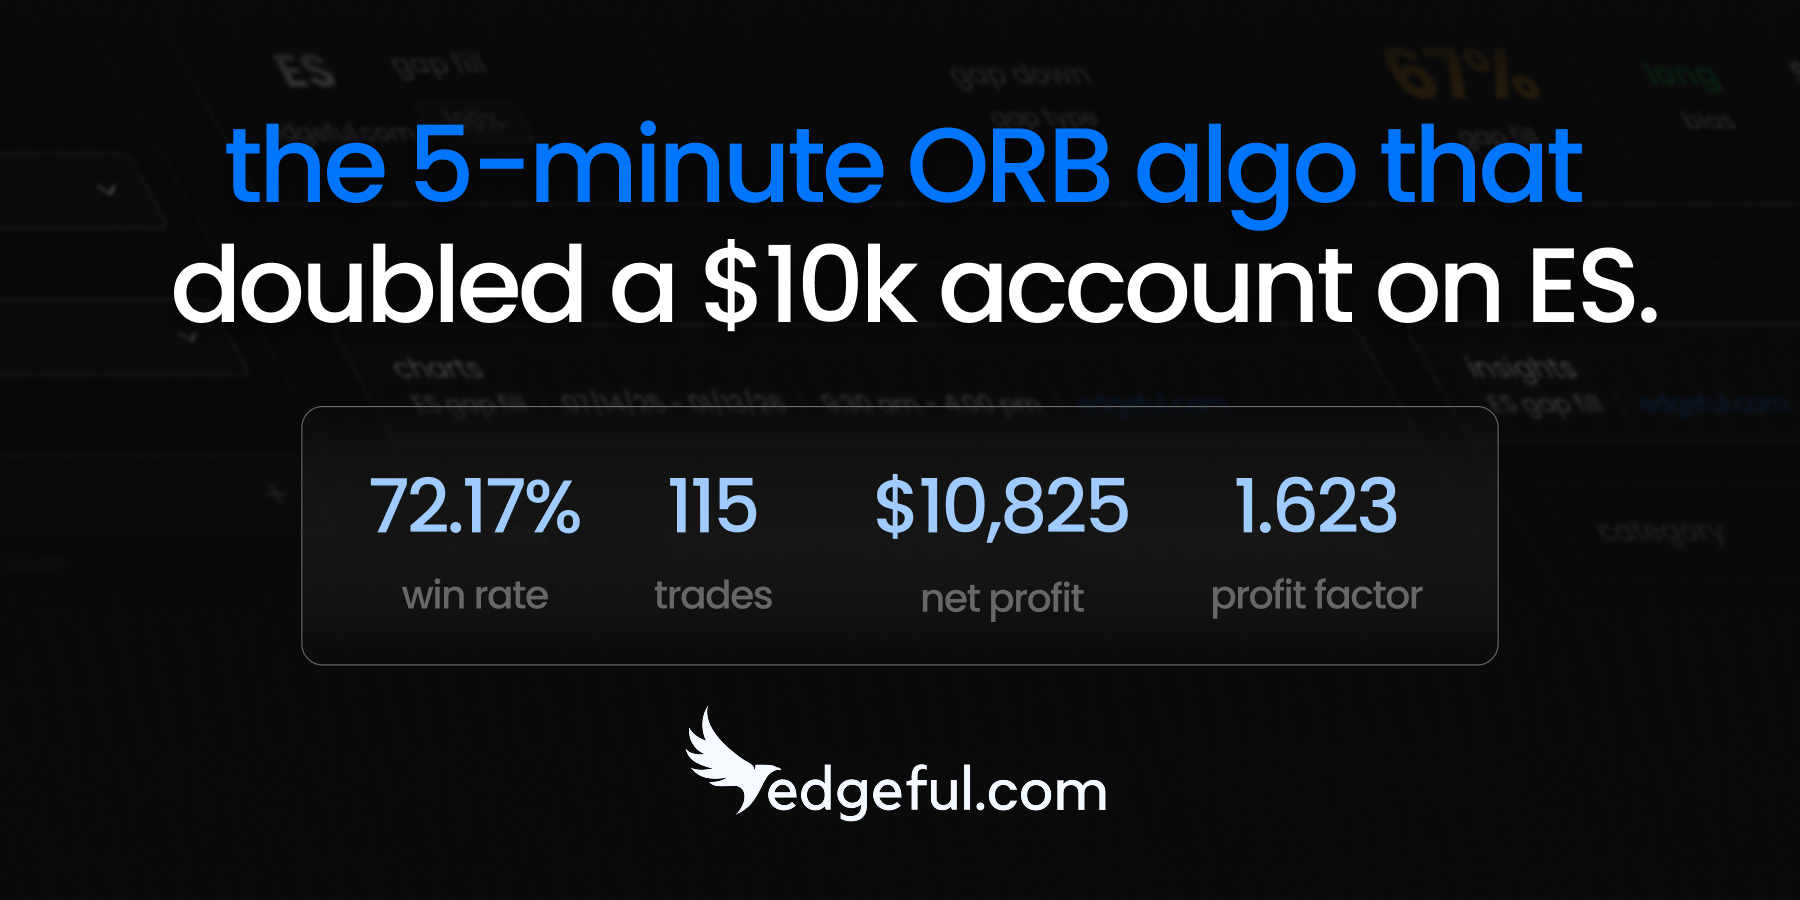
here's what the 5 minute opening range breakout returned on ES over 6 months, trading 1 contract:
- win rate: 72.17%
- total trades: 115
- net profit: $10,825
- return on $10k account: 108%
- profit factor: 1.623
note: these settings are optimized. the default settings won't perform like this. two specific changes were made from the out-of-the-box ORB algo — and I'll walk through both below. the default settings were still decent, but these two adjustments moved the numbers meaningfully.
this isn't a backtest that required 47 filters and a PhD in statistics. the core strategy is the default 5 minute opening range breakout on ES with a 50% profit target and a stop at the opposite edge of the range. the max ORB size filter is set to 0.55%.
two changes on top of that. that's it.
and I'm not going to pretend this was easy money. these results required running the backtest, uploading it to the analyzer, reading what the data flagged, testing the changes, and validating the results. that's the work. but when you put in the time to actually study the data and customize the settings, the results are there.
the two settings that moved the numbers
the base strategy — the 5 minute opening range breakout on ES with default settings — was already showing an edge. but two specific adjustments took it from "decent" to 108% in 6 months.
1. Tuesday breakouts turned off
after running the backtest through the algo analyzer, it flagged that Tuesday breakouts were underperforming. breakdowns on Tuesday are fine. but the long side on Tuesdays doesn't get the same follow-through on ES.
the analyzer actually flagged other days too. but only Tuesday breakouts were removed to keep it simple and show how one small day-of-week filter can move the numbers. this is the kind of edge that's invisible if you don't look at the data by weekday — which most traders never do.
if you want to understand why different days of the week behave differently, we wrote about that in our post on the weekday trading edge. the short version: volume patterns, institutional flow, and economic data releases create measurable differences in how setups perform on different days.
2. $700 max dollar loss
the second change was adding a $700 maximum dollar loss per trade. on 1 ES contract, that's 14 points.
this acts as a safety net. the stop loss is still at the opposite edge of the opening range (the 100% stop). but on days where the range is unusually wide, the $700 cap keeps your worst-case defined regardless of how volatile the open was.
it's a simple risk management layer that prevents one outsized loss from wrecking a string of wins.
that's the entire optimization. Tuesday breakouts off, $700 max loss. every other setting is default or near-default.
how the analyzer flagged the optimizations to make
this is the part that matters for anyone trying to improve their own strategies.
- the process wasn't: guess which days are bad, then test.
- the process was: run the backtest, upload the results to the analyzer, and let the data show you what's working and what's dragging the numbers down.
the analyzer broke down the 5 minute opening range breakout results by:
- day of the week
- long vs. short direction
- ORB range size
- trade duration
it flagged Tuesday breakouts as the weakest performer. it flagged other patterns too. but the goal of the playbook was to keep things simple — show traders that even one small data-driven change can produce meaningful results.
this is the same process you can use on any strategy you're backtesting. upload your results, see what the data flags, and test what happens when you make the change. it takes a few minutes, and it can meaningfully improve your results.
opening range breakout profit targets and stop loss settings
the profit target and stop loss settings in this 5 minute opening range breakout strategy are straightforward:
50% profit target
the profit target is set at 50% of the opening range. if the 5-minute range is 10 points, the profit target is 5 points above the breakout level.
why 50%? because the win rate drops significantly at larger targets. when you push to 100% or 150% of the range, you catch bigger moves — but you lose a lot more trades in the process. the data on ES over the last 6 months shows that 50% hits the sweet spot between win rate and reward.
if you want a deeper look at how profit targets affect ORB performance, check out the post on ORB by performance subreport. it breaks down how different target levels change your expected value across multiple tickers.
100% stop loss (opposite edge of the range)
the stop loss sits at the opposite edge of the opening range. if you're long on a breakout above the range high, your stop is at the range low — that's 100% of the range.
this gives the trade enough room to breathe while keeping risk defined. the 0.55% max ORB size filter prevents you from entering on days where the range is unusually wide, which keeps the 100% stop from getting too expensive.
0.55% max ORB size filter
this filter skips trades on days where the 5-minute range is wider than 0.55% of the opening price. on ES, that means if the opening range is too wide relative to where price opened, the algo sits out.
wide opening ranges mean wider stops and less favorable risk-to-reward. the size filter keeps the strategy focused on the setups where the data shows the best edge.
this isn't fully optimized — and that's the point
I want to be honest about something. the 5 minute opening range breakout settings in the free playbook are near-default. two changes from out-of-the-box. that's it.
and the strategy returned 108% in 6 months on ES.
now imagine what happens when you actually sit down with the optimizer and start testing parameters one at a time. adjusting the profit targets. testing different size filters. checking whether other days or directions have room to improve.
the playbook gives you a working strategy. the optimizer is how you make it yours.
but here's the caveat that comes with any backtested strategy: these settings are working right now. they won't work forever. market conditions shift, volatility changes, and strategies go in and out of favor. that's not a reason to skip it. it's a reason to take advantage while the edge is there — and to keep testing as new data comes in so you can adapt.
for a broader look at how to think about automated strategies and the backtesting process, our guide on automated trading strategies covers the full framework.
common mistakes traders make with the opening range breakout
mistake 1: using the same timeframe on every ticker
the 5 minute opening range breakout works well on ES. that doesn't mean it's the best window for NQ, GC, or CL. different instruments have different volatility profiles and different opening dynamics. always test the timeframe on the specific ticker you're trading.
mistake 2: ignoring day-of-week patterns
most traders apply the opening range breakout the same way every single day. but the data shows that not every day performs equally. the ES backtest flagged Tuesday breakouts as underperforming — and that one filter meaningfully improved the results. check your own data by weekday before assuming every day is the same.
mistake 3: setting profit targets based on feeling
"I'll take profits when it feels right" is not a strategy. the data shows that 50% of the range is the sweet spot on ES for this setup. larger targets look appealing on the winners, but they kill your win rate. let the numbers set your targets, not your gut.
mistake 4: skipping the analyzer step
running a backtest is only half the process. uploading those results to an analyzer and seeing what the data flags — by day, by direction, by range size — is where the real edge comes from. the two changes that turned this strategy from "decent" to 108% came from the analyzer, not from guessing.
mistake 5: assuming backtested results are guaranteed
a 72.17% win rate over 115 trades is strong. but it's historical data, not a promise. markets change. the results require ongoing monitoring, periodic re-testing, and a willingness to adapt when the numbers shift. treat backtested performance as a starting point, not a finish line.
how to build your own 5 minute opening range breakout strategy
if you want to replicate this process — or build something similar on a different ticker — here's the step-by-step:
- set the opening range window to 5 minutes. 09:30 to 09:35 ET on ES. this defines the high and low of your range.
- set the profit target at 50% of the range. start here. you can test other levels later, but 50% is where the data shows the best balance of win rate and reward on ES.
- set the stop loss at 100% (opposite edge of the range). if you're long from a breakout above the range, your stop is at the range low.
- add a max ORB size filter. 0.55% on ES. this prevents you from entering on days where the range is too wide and the risk-to-reward breaks down.
- run the backtest. get at least 6 months of data. you need enough trades for the numbers to mean something.
- upload the results to the analyzer. look at the breakdown by day of week, direction, range size, and trade duration. see what the data flags.
- make one change at a time. test what happens when you remove the weakest day, adjust the target, or tighten the size filter. don't change everything at once — isolate each variable.
- validate the results. does the change improve the numbers without dramatically reducing the sample size? if you're down to 20 trades, the data isn't reliable. you need enough trades for the edge to be meaningful.
the free playbook walks through this exact process with charts, settings tables, and step-by-step screenshots: get the free ORB playbook.
key takeaways
- the 5 minute opening range breakout on ES uses a tighter window (09:30 to 09:35) that produces smaller stops and earlier entries compared to the standard 15-minute ORB
- over 6 months on ES, this setup returned 108% on a $10k account with a 72.17% win rate, 115 trades, and a 1.623 profit factor
- only two changes from default settings were needed: Tuesday breakouts turned off and a $700 max dollar loss cap
- the analyzer flagged Tuesday breakouts as underperforming — this is the kind of edge you find by studying the data by day of week, not by guessing
- the 50% profit target hits the sweet spot between win rate and reward — larger targets look better on paper but kill the win rate
- these settings are optimized and working right now, but they won't work forever — ongoing testing and adaptation are required
- the playbook settings are near-default and not fully optimized — there's room to take it further with the optimizer
risk disclaimer: all trading involves risk. past performance — including backtested results — does not guarantee future results. the statistics and performance data referenced in this post are based on historical backtesting over a specific time period and may not reflect future market conditions. edgeful provides data and tools, not financial advice. always trade with risk management and never risk more than you can afford to lose.