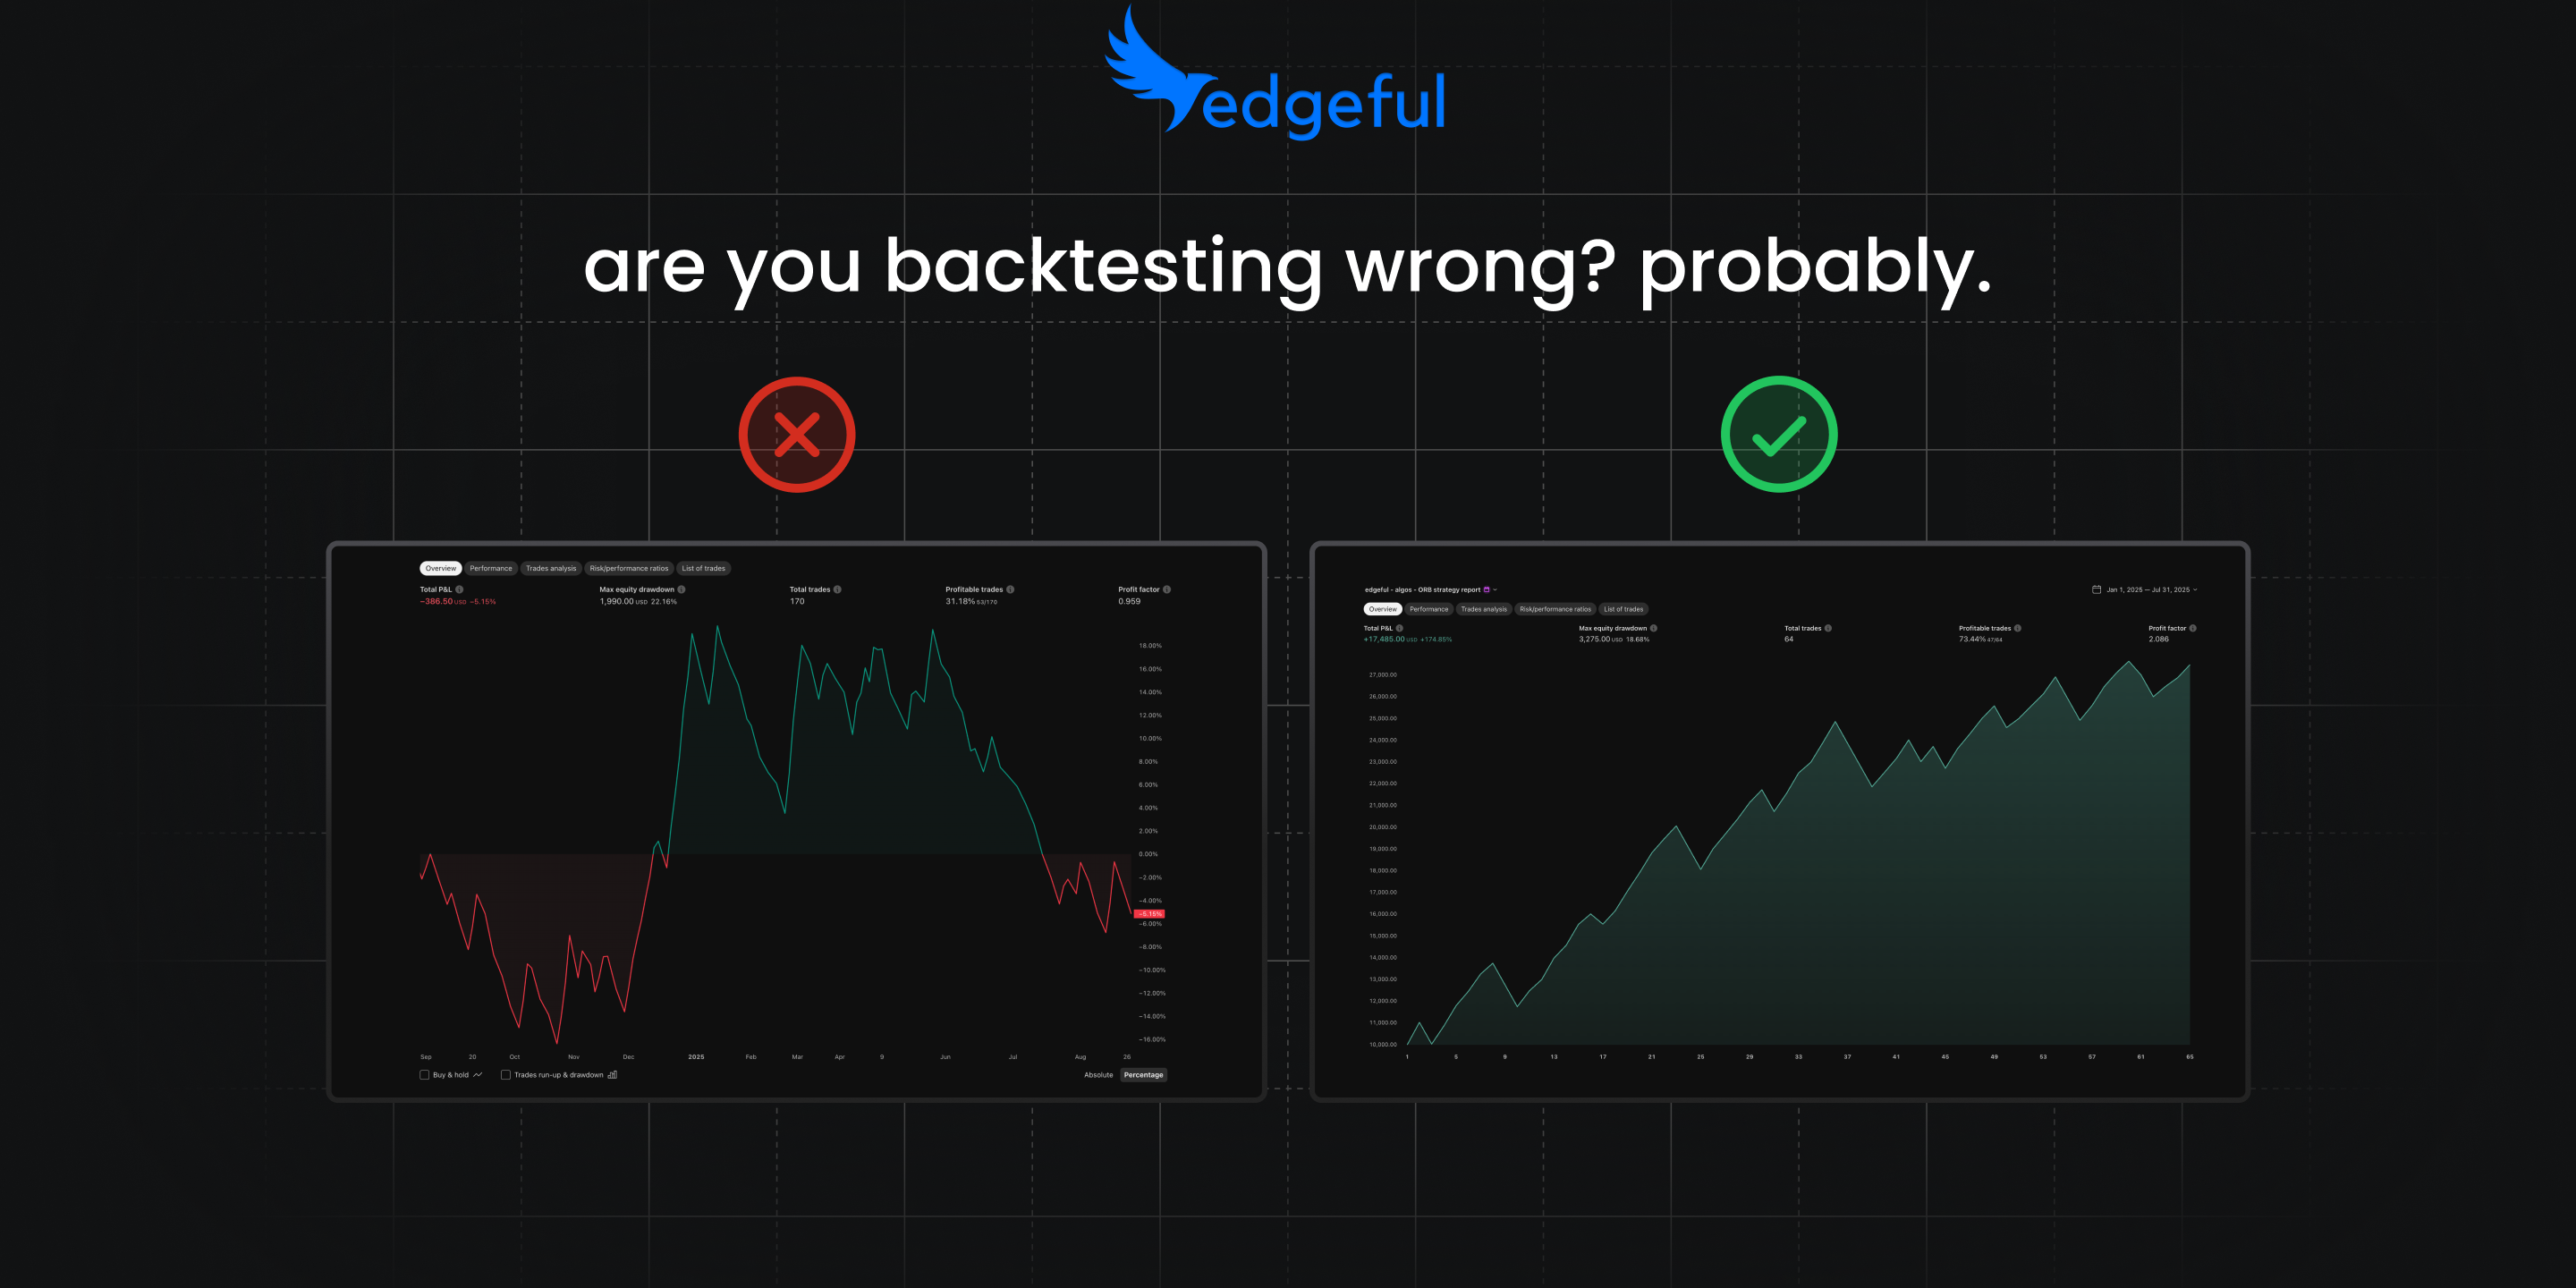
are you backtesting wrong? here's how to know
welcome back to stay sharp.
last week we broke down simple vs compound interest — and why 6% monthly returns (which sounds manageable) actually gets you to 101% annually through compounding.
if you missed it, you can check it out here.
this week... something I see way too often.
traders optimizing strategies on 5, 10, even 25 years of data. then wondering why their strategies/algos stop working after a month — and then abandoning them completely thinking they don’t work anymore.
I’m going to help you solve that completely today — here’s how:
- why looking back too far kills your edge
- the 6-month rolling window I actually use
- what hedge funds do (spoiler: not what you think)
- Druckenmiller's 12-20 month rule
- how to know if your backtest is lying to you
let's get into it.
how far back should you actually look?
like I said above — backtesting your strategies/algos on 20+ years of data sounds good — but it doesn’t actually help you improve as a trader.
why?
I’ll show you with a real example:
let’s say you trade the ORB (opening range breakout) on MNQ 5-minute.
the idea is simple — reminder, this is just an example:
- you look at the first 15 minutes of trading
- when price breaks above that range, you go long
- when price breaks below that range, you go short
when I backtest this setup (with some profit target, stop loss, and position sizing optimizations) looking back YTD (10 months)... the performance is solid:
- win rate is high - 64%
- drawdown is manageable
- profit factor looks good - 1.655
but let’s say you increase the time horizon to the past 3 years… what are the differences in performance? let’s see:
- win rate is still high
- drawdown is terrible - 135%
- profit factor decreased to 1.37
- win rate is still high
- drawdown is terrible - 135%
- profit factor decreased to 1.37
it’s clear that this strategy didn’t work for the majority of 2023 — and if you were running it without checking the data, you likely lost a lot of money or your entire account.
now... you might be thinking "but André, more data is better, right? don’t I want to know how I’m going to perform in every single market type?"
let’s run this test on the past 5 years and see the outcome:
if you backtested this from 2020-2025, you'd see:
- overall great returns (+637%)
- high profit factor (1.189)
- solid win rate (68.59%)
but if you only looked at the last 6-12 months, you'd see:
- a strategy that's been printing money consistently
- smooth upward equity curve
- no major drawdowns
the problem: the strategy that worked in 2020-2023 clearly stopped working. something fundamentally changed. then it started working again in a completely different way starting in late 2023.
if you optimized on all 5 years of data, you'd be blending two completely different market environments. you'd be watering down what's actually working right now by including 3 years of data where the strategy was terrible.
this is exactly why looking back too far kills your edge. the strategy that's crushing it right now in 2024-2025 is NOT the same strategy that was losing money in 2021-2023.
the math problem with long lookback periods
think about it this way: we're trading today. October 2025.
the further back you go, the smaller the current environment’s action becomes as a percentage of your total sample.
go back 25 years? today won't even move the needle on your results. it's statistically insignificant.
go back 10 years? still barely moves the needle.
go back 5 years? you're including:
- 2 presidential elections
- a pandemic
- unprecedented inflation
- historic stimulus
- tariff wars from Q4 2024 into Q1 2025
things have been shifting like crazy... especially from Q4 of '24 through now.
so if you're trading today’s environment, why are you optimizing for 2020?
that's exactly the problem.
what hedge funds actually do (from someone who worked at one)
I worked at a top 100 performing hedge fund and I also worked at Goldman Sachs.
let me tell you something: there is not a single hedge fund in the world that built an algo on January 1st, 2020... and just let it run for 5 years without touching it.
that would be insane.
nobody does that.
but when you backtest 5 years and trade that setup... that's exactly what you're saying you'd do.
you're implying: "if I had run this exact strategy unchanged from 2020 to 2025, here's what would have happened."
and it's just not realistic.
so here’s what you should be doing instead:
my approach: 6-month rolling optimization
here's how I actually do it:
I optimize on a 6-month lookback. every day, that window shifts forward. so I'm always looking at the most recent 6 months.
then every month... not every day, not after 2 or 3 losses... but every month, I re-optimize based on what changed.
questions I'm asking:
- am I consistently hitting profit targets?
- am I leaving money on the table?
- should I move my targets?
and then I use the edgeful reports to help me set improved targets/stop losses based on thoes findings.
I went through a couple of different reports on how to set profit targets here, and then how to set stop losses here. I highly recommend reading those when you get the chance.
real example: in Q1-Q3 of 2024 I was performing really well with the gap fill algo. my profit targets were dialed in. stop losses also saving me money on the days where price went against me.
then going into Q4 of ‘24... I noticed I started taking tons of losses in a row — which is normal depending on the win rate.
let’s say the gap fill strategy was a 60% win rate strategy — and I had taken 6 losses in a row.
based on the chart above — the probability that happens is only 32% — which raised a red flag.
so what did I do?
- cut my size after 3 losses in a row (still normal, but watching closely)
- after 6 losses in a row — stopped the gap fill algo altogether
but to be clear — this is the type of adjustment I’m making based on the action. I had taken 3-4 losses in a row a couple of times earlier in the year, which is completely normal action. but 6 losses in a row was something new - and I had to respond to what the market action was telling me to do.
you don’t want to adjust your settings just because you had a bad week — that’s not the point. you want to use data to help you decide when something is normal variance vs. when an environment is completely shifting in real-time, and respond accordingly.
Druckenmiller's 12-20 month rule
I saw a video last week of Stanley Druckenmiller — one of the best macro traders alive (averaged 30% annual returns for three decades at his fund) — talking about his typical lookback period when he does his technical analysis.
12-20 months maximum.
less than 2 years of charts.
if that's good enough for one of the greatest traders in history... it's probably worth considering for the rest of us
one caveat: it depends on your time frame
now look... if you're Warren Buffett or Ray Dalio, holding positions for years or decades... then yeah, going back 20+ years makes sense. you're playing a completely different game.
but if you're trading a 5-minute chart? if you're in and out the same day?
things change way too fast for a 10-year backtest to be useful.
match your lookback to your holding period. that's the key.
so what should you actually do?
here's your action plan:
1) check your current backtest period
- how far back are you going?
- is that data still relevant to how things are trading now?
2) try a 6-month rolling window
- compare it to your current approach
- see which one performs better in recent forward testing
3) re-optimize monthly, not daily
- wait for a full month of new data
- look for consistent patterns, not random noise
- make adjustments based on what the data shows
4) ask yourself the honest question
- would you actually run this exact strategy unchanged for the entire period you're testing?
- if the answer is no... your backtest is lying to you
5) focus on adaptability
- the goal isn't to find a strategy that works forever
- the goal is to build a process that adapts as the market changes
because the market always changes.
wrapping up
stop backtesting on decades of irrelevant data.
start focusing on what's working right now... with enough historical context to be statistically significant, but not so much that you're optimizing for market conditions that don't exist anymore.
6 months for intraday. 12-20 months if you have a little bit longer of a time horizon like Druckenmiller.
and re-optimize monthly as things shift. but to optimize, you need the data. and you can get it here.