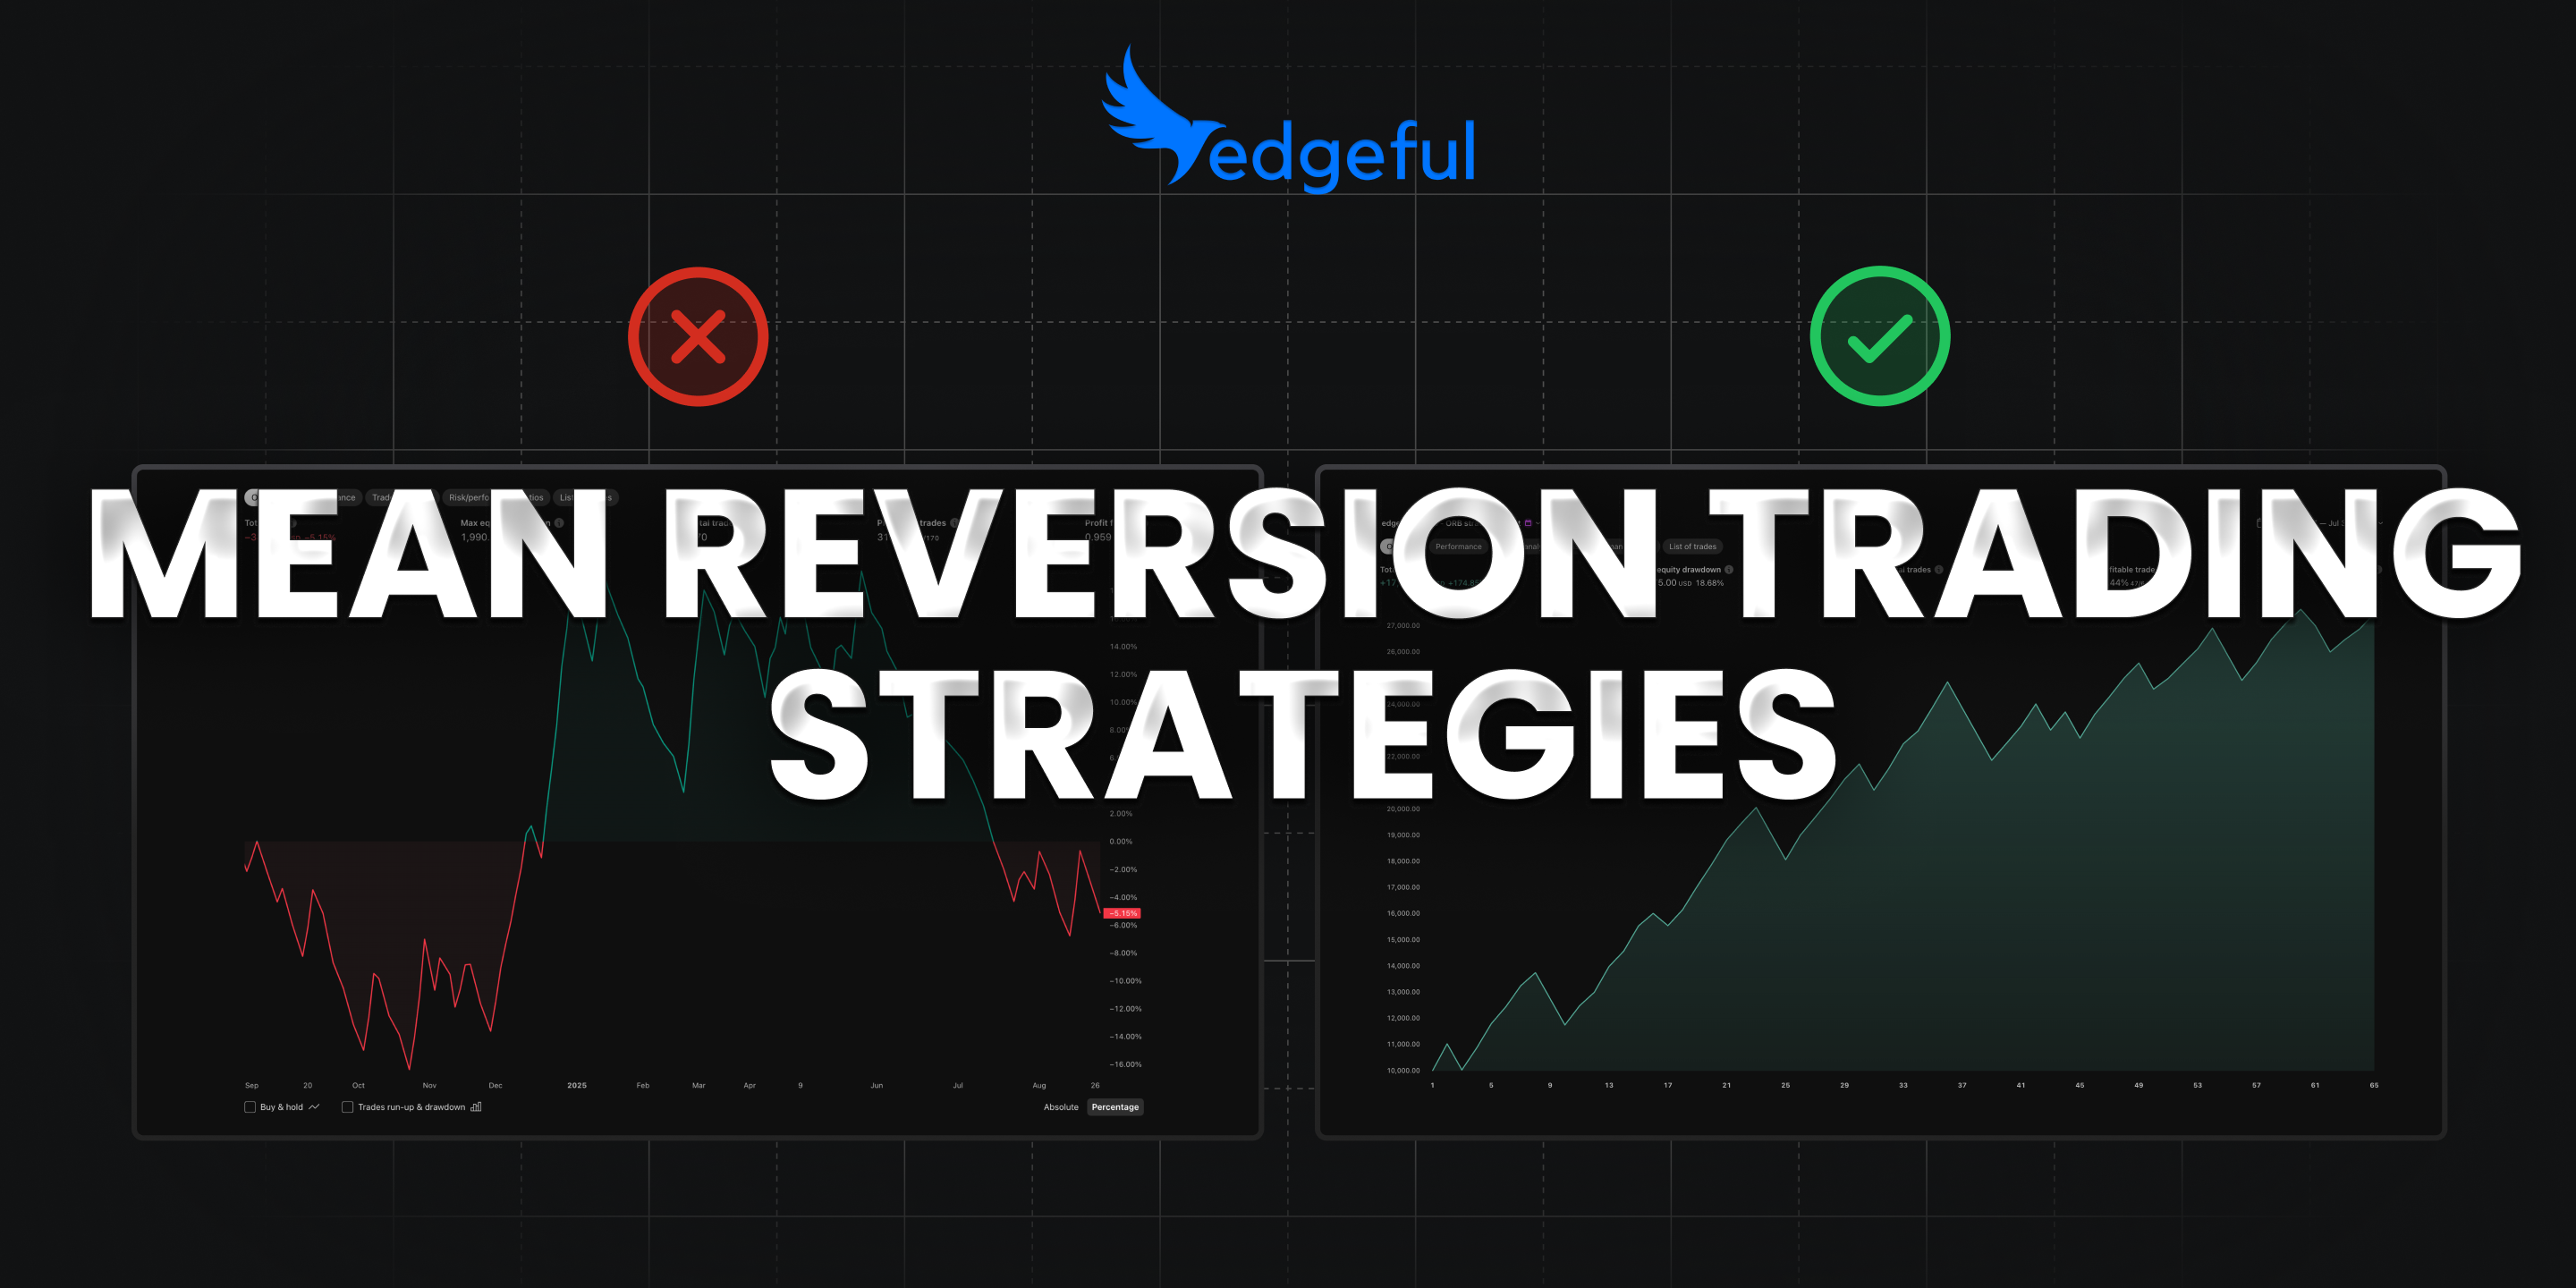
mean reversion strategy: how to trade pullbacks and reversals
most retail traders chase momentum. they see price moving, jump in, and hope it keeps going.
sometimes it works. often it doesn't.
what they miss is that markets don't trend forever. price stretches, overextends, and then snaps back. that snap back is where mean reversion traders make money.
a mean reversion strategy is built on one simple idea: what goes up too far, too fast tends to come back down. and vice versa. instead of chasing moves, you're fading them — trading the return to "normal."
the best part? mean reversion setups are measurable. you can see how often gaps fill, how frequently price returns to key levels, and what happens after overextensions. the data removes the guesswork.
this guide covers what mean reversion trading actually is, how it differs from momentum trading, and three mean reversion strategies you can use for day trading futures.
table of contents
- what is mean reversion?
- mean reversion vs momentum trading
- mean reversion strategy #1: gap fills
- mean reversion strategy #2: ICT midnight open retracement
- mean reversion strategy #3: ultimate reversal setup
- how to identify mean reversion setups
- when mean reversion strategies fail
- frequently asked questions
- key takeaways
what is mean reversion?
mean reversion is the concept that price tends to return to an average or equilibrium level over time.
when price moves too far in one direction — stretched above or below its "mean" — the probability of a pullback increases. mean reversion traders exploit this tendency by fading overextended moves.
the "mean" can be:
- a moving average (like the 20 EMA or VWAP)
- a price level (like the previous day's close)
- a range midpoint (like the middle of the initial balance)
the core idea behind any mean reversion strategy is the same: overextended extremes don't last. price that's far from average tends to return toward average.
simple example:
ES opens 40 points above yesterday's close. a mean reversion strategy might look for price to pull back and "fill the gap" — returning toward where it closed the prior session.
mean reversion vs momentum trading
mean reversion and momentum are opposite approaches. understanding the difference helps you pick the right mean reversion strategy for different market conditions.
momentum trading
momentum traders bet that price will continue in its current direction.
the logic: trends persist. a stock making new highs is more likely to keep making new highs than to reverse.
momentum setups include:
- breakouts above resistance
- initial balance single breaks with follow-through
- opening range breakouts with continuation
when it works: trending days, high-conviction directional moves, news-driven momentum
mean reversion trading
mean reversion traders bet that price will reverse toward an average.
the logic: extremes don't last. price that's moved too far, too fast is likely to pull back.
mean reversion setups include:
- gap fills
- fading moves at key levels
- reversals after overextension
when it works: range-bound days, choppy conditions, after extended moves without consolidation
the key difference
momentum traders ask: "is this move going to continue?"
mean reversion traders ask: "has this move gone too far?"
both approaches work — in the right conditions. the mistake is applying a mean reversion strategy on a trending day or chasing momentum on a choppy day.
how to tell which environment you're in:
- if price is respecting levels and reversing at extremes → mean reversion
- if price is breaking levels and following through → momentum
the best traders recognize which regime they're in and adapt. some days are mean reversion days. some days are momentum days. the data helps you identify which.
mean reversion strategy #1: gap fills
gap fills are one of the most reliable mean reversion strategies in day trading.
what is a gap?
a gap occurs when price opens significantly higher or lower than the previous session's close. the "gap" is the empty space between yesterday's close and today's open.
the mean reversion logic
gaps represent an imbalance. price jumped overnight without trading through those levels. the mean reversion strategy here is simple: expect price to "fill" that gap by returning to the previous close.
gaps fill because:
- overnight moves often lack volume and conviction
- institutional traders use the open to fade retail overreaction
- price seeks liquidity, and the gap represents unfilled orders
how to trade it
- setup: price opens with a gap (up or down) from the previous day's close
- entry: after initial volatility settles, look for price to reverse toward the gap fill level
- target: previous day's close (the gap fill level)
- stop: beyond the opening range high/low (depends on gap direction), you can also use the gap fill by spike subreport to find a data-backed stop loss.
the data edge
not all gaps fill — and not all fill quickly. the probability depends on gap size, direction, and instrument.
edgeful tracks gap fill rates across multiple futures contracts. you can see exactly how often gaps of different sizes fill within the session.
for a complete breakdown of gap fill probabilities and how to trade them, check out our gap fill trading strategy.
here’s an example of the current gap fill stats on ES, over the last 6 months using edgeful’s reports:
what the image above is saying is clear:
- over the last 6 months, gaps up on ES have filled 67% of the time
- over the last 6 months, gaps down on ES have filled 64% of the time
so nearly 2 thirds of all gaps you see on ES have filled over the last 6 months. this is how you can add data to your strategy — which should build your confidence to execute.
mean reversion strategy #2: ICT midnight open retracement
this mean reversion strategy uses the midnight open as a key reference point for intraday reversals.
what is the ICT midnight open?
the ICT (Inner Circle Trader) methodology identifies midnight ET as a significant time for futures markets. the price at midnight becomes a "mean" that price often returns to during the trading session.
the mean reversion logic
the midnight open acts as an anchor. when price moves away from this level during the overnight or morning session, there's a statistical tendency for it to retrace back.
this works because:
- midnight marks a transition point in global trading
- moves away from midnight open often overextend before NY session
- the level acts as a magnet for price during the regular session
how to trade it
- setup: identify the midnight ET open price on your chart
- entry: when price has moved significantly away from midnight open (overextended), look for reversal signals
- target: the midnight open level (or a percentage retracement toward it)
- stop: we’re in the process of building an ICT opening retracement by spike subreport, which will help you identify a data-backed stop. for now, you can use a typical chart pattern or clear level of support/resistance to set your stop.
the data edge
edgeful has backtested midnight open retracement across futures instruments. the data shows how often price returns to this level and what percentage retracement is most probable.
for the full breakdown with historical probabilities, see our ICT midnight open retracement report.
here are the current stats on the ICT opening retracement report on edgeful:
on ES over the last 6 months:
- when price opens above the midnight open, it retraces back down 73% of the time
- when price opens below the midnight open, it retraces back up 65% of the time
mean reversion strategy #3: ultimate reversal setup
this mean reversion strategy combines three separate reports into one high-probability reversal trade.
what is the ultimate reversal setup?
the ultimate reversal setup triggers when three conditions align at the open:
- outside day — price opens outside yesterday's range (above yesterday's high or below yesterday's low)
- gap — price opens above or below yesterday's close
- ICT midnight open retracement — price opens above or below the 12 AM ET opening price
when all three conditions are present, you don't have one report telling you to expect a reversal — you have three.
the mean reversion logic
each of these reports independently shows mean reversion tendencies:
- outside days: when price opens above yesterday's high, it tends to reverse back down. when it opens below yesterday's low, it tends to reverse back up.
- gaps: price that gaps away from yesterday's close tends to fill that gap.
- ICT midnight open: price that moves away from the midnight level tends to retrace back to it.
individually, these are solid setups. combined, they create the ultimate reversal setup — stacking three mean reversion signals into one trade.
how to trade it
setup: before the NY session opens, check:
- is price opening outside yesterday's range? (outside day)
- is there a gap from yesterday's close?
- where is price relative to the midnight open?
if all three align, you have the ultimate reversal setup — a mean reversion strategy with triple confirmation.
entry: you have two options:
- enter at the open and set stops wide enough to account for the expected spike against you
- wait for the spike to play out, then enter on confirmation of the reversal
stops: place your stop beyond the high (for shorts) or low (for longs) of the initial spike. if price pushes past that level, the reversal thesis is wrong.
targets: this mean reversion strategy gives you three data-backed profit targets:
- yesterday's high or low (from the outside day report)
- the ICT midnight open level
- yesterday's close (from the gap fill report)
you can scale out at each level as the trade works in your direction.
the data edge
edgeful tracks all three reports with historical probabilities. on NQ over recent months:
- ICT midnight open retracement: 74% when price opens above, 62% when price opens below
- outside days: 69-71% reversal probability
- gap fills: 57-60% fill rate
the gap fill is the weakest of the three, but when it aligns with outside day and midnight open data, it provides an additional target level.
for the full breakdown with current stats and a TradingView indicator, check out our ultimate reversal trading strategy.
how to identify mean reversion setups
not every pullback is a mean reversion opportunity. here's how to filter for the best setups.
1. identify the "mean"
before you can trade mean reversion, you need to define what price is reverting to.
common reference points:
- VWAP (volume-weighted average price)
- previous day's close
- previous session’s high/low
- session open
- moving averages (9 EMA, 20 EMA)
- range midpoints (IB midpoint, overnight range midpoint)
your mean reversion strategy should have a clear target — not just "price will pull back" but "price will pull back to X level."
2. measure the overextension
mean reversion works when price is stretched. if price is near the mean, there's nothing to revert.
signs of overextension:
- price is far from VWAP or key moving averages
- the move happened quickly without pullbacks
- price is at or beyond previous session's range
- indicators show overbought/oversold (though price action is more reliable)
the more extended the move, the higher probability of mean reversion — but also the harder it is to time.
3. wait for rejection
don't fade a move just because it's extended. wait for price to show it's actually reversing.
rejection signals:
- long wicks at key levels (hammers, shooting stars)
- engulfing candles against the trend
- failed breakout (price breaks a level, then reverses back)
- volume spike on the reversal candle
mean reversion strategies work better when you wait for confirmation rather than trying to catch the exact top or bottom.
4. check the context
not every day is a mean reversion day.
mean reversion favors:
- range-bound conditions
- low-volatility environments
- days without major news catalysts
- balanced markets (not trending)
if the market is trending hard, your mean reversion strategy will get run over. check the broader context before fading.
when mean reversion strategies fail
mean reversion isn't a magic formula. here's when it doesn't work.
trending days
on strong trend days, price doesn't revert — it keeps going. fading a breakout on a trending day is a quick way to lose money.
signs it's a trend day:
- IB breaks one direction with follow-through
- price stays on one side of VWAP all day
- higher highs and higher lows (or lower lows)
- volume confirms the direction
on these days, momentum strategies outperform. recognize the environment and adapt.
news-driven moves
when a major catalyst hits (FOMC, CPI, earnings), price can move far beyond normal ranges and stay there.
mean reversion strategies assume price will return to normal. but if the fundamental picture has changed, "normal" might be different now.
be careful fading moves around high-impact news.
low-liquidity periods
mean reversion works because other traders also expect price to revert. during low-liquidity periods (lunch hour, overnight), there may not be enough participants to push price back.
mean reversion strategies work best during active trading hours when volume supports the move.
fighting the trend on higher timeframes
you might see a mean reversion setup on a 5-minute chart, but if the daily trend is strongly bullish, that pullback you're fading might be the start of continuation.
always check the higher timeframe context before trading a mean reversion strategy.
frequently asked questions
what is a mean reversion strategy?
a mean reversion strategy is an approach that trades the tendency of price to return to an average level after overextending. instead of chasing momentum, mean reversion traders fade stretched moves, expecting price to snap back toward a defined mean like VWAP, previous close, or a moving average.
is mean reversion better than momentum trading?
neither is universally better — they work in different conditions. mean reversion strategies outperform on range-bound, choppy days. momentum strategies outperform on trending days. the key is recognizing which environment you're in and applying the right approach.
what is the best mean reversion strategy for day trading?
gap fills are one of the most reliable mean reversion strategies for day traders because they have clear entry levels, defined targets, and measurable probabilities. the ICT midnight open retracement and ultimate reversal setup are also effective when the data supports the setup.
how do you know when to use mean reversion vs momentum?
look at how price is behaving at key levels. if price is respecting levels and reversing at extremes, it's a mean reversion environment. if price is breaking levels with follow-through, it's a momentum environment. the initial balance break (or lack of break) often signals which type of day it is.
what's the biggest mistake traders make with mean reversion strategies?
fading trends. the most common mistake is applying a mean reversion strategy on a day when momentum is dominant. price can stay "overextended" far longer than your account can handle. always confirm the environment before fading.
key takeaways
- mean reversion is the tendency of price to return to an average after overextending
- a mean reversion strategy fades stretched moves rather than chasing momentum
- mean reversion works best on range-bound days; momentum works best on trending days
- gap fills are a classic mean reversion strategy with measurable probabilities
- the ICT midnight open acts as a magnet level that price often retraces to
- the ultimate reversal setup stacks multiple mean reversion factors for higher probability
- identify your mean (VWAP, previous close, etc.) before trading
- wait for rejection signals — don't fade blindly
- mean reversion strategies fail on trend days and around major news events
- the data tells you which setups have edge — use it to filter for the best opportunities