trading FOMC: how to avoid losing money on federal reserve announcement days

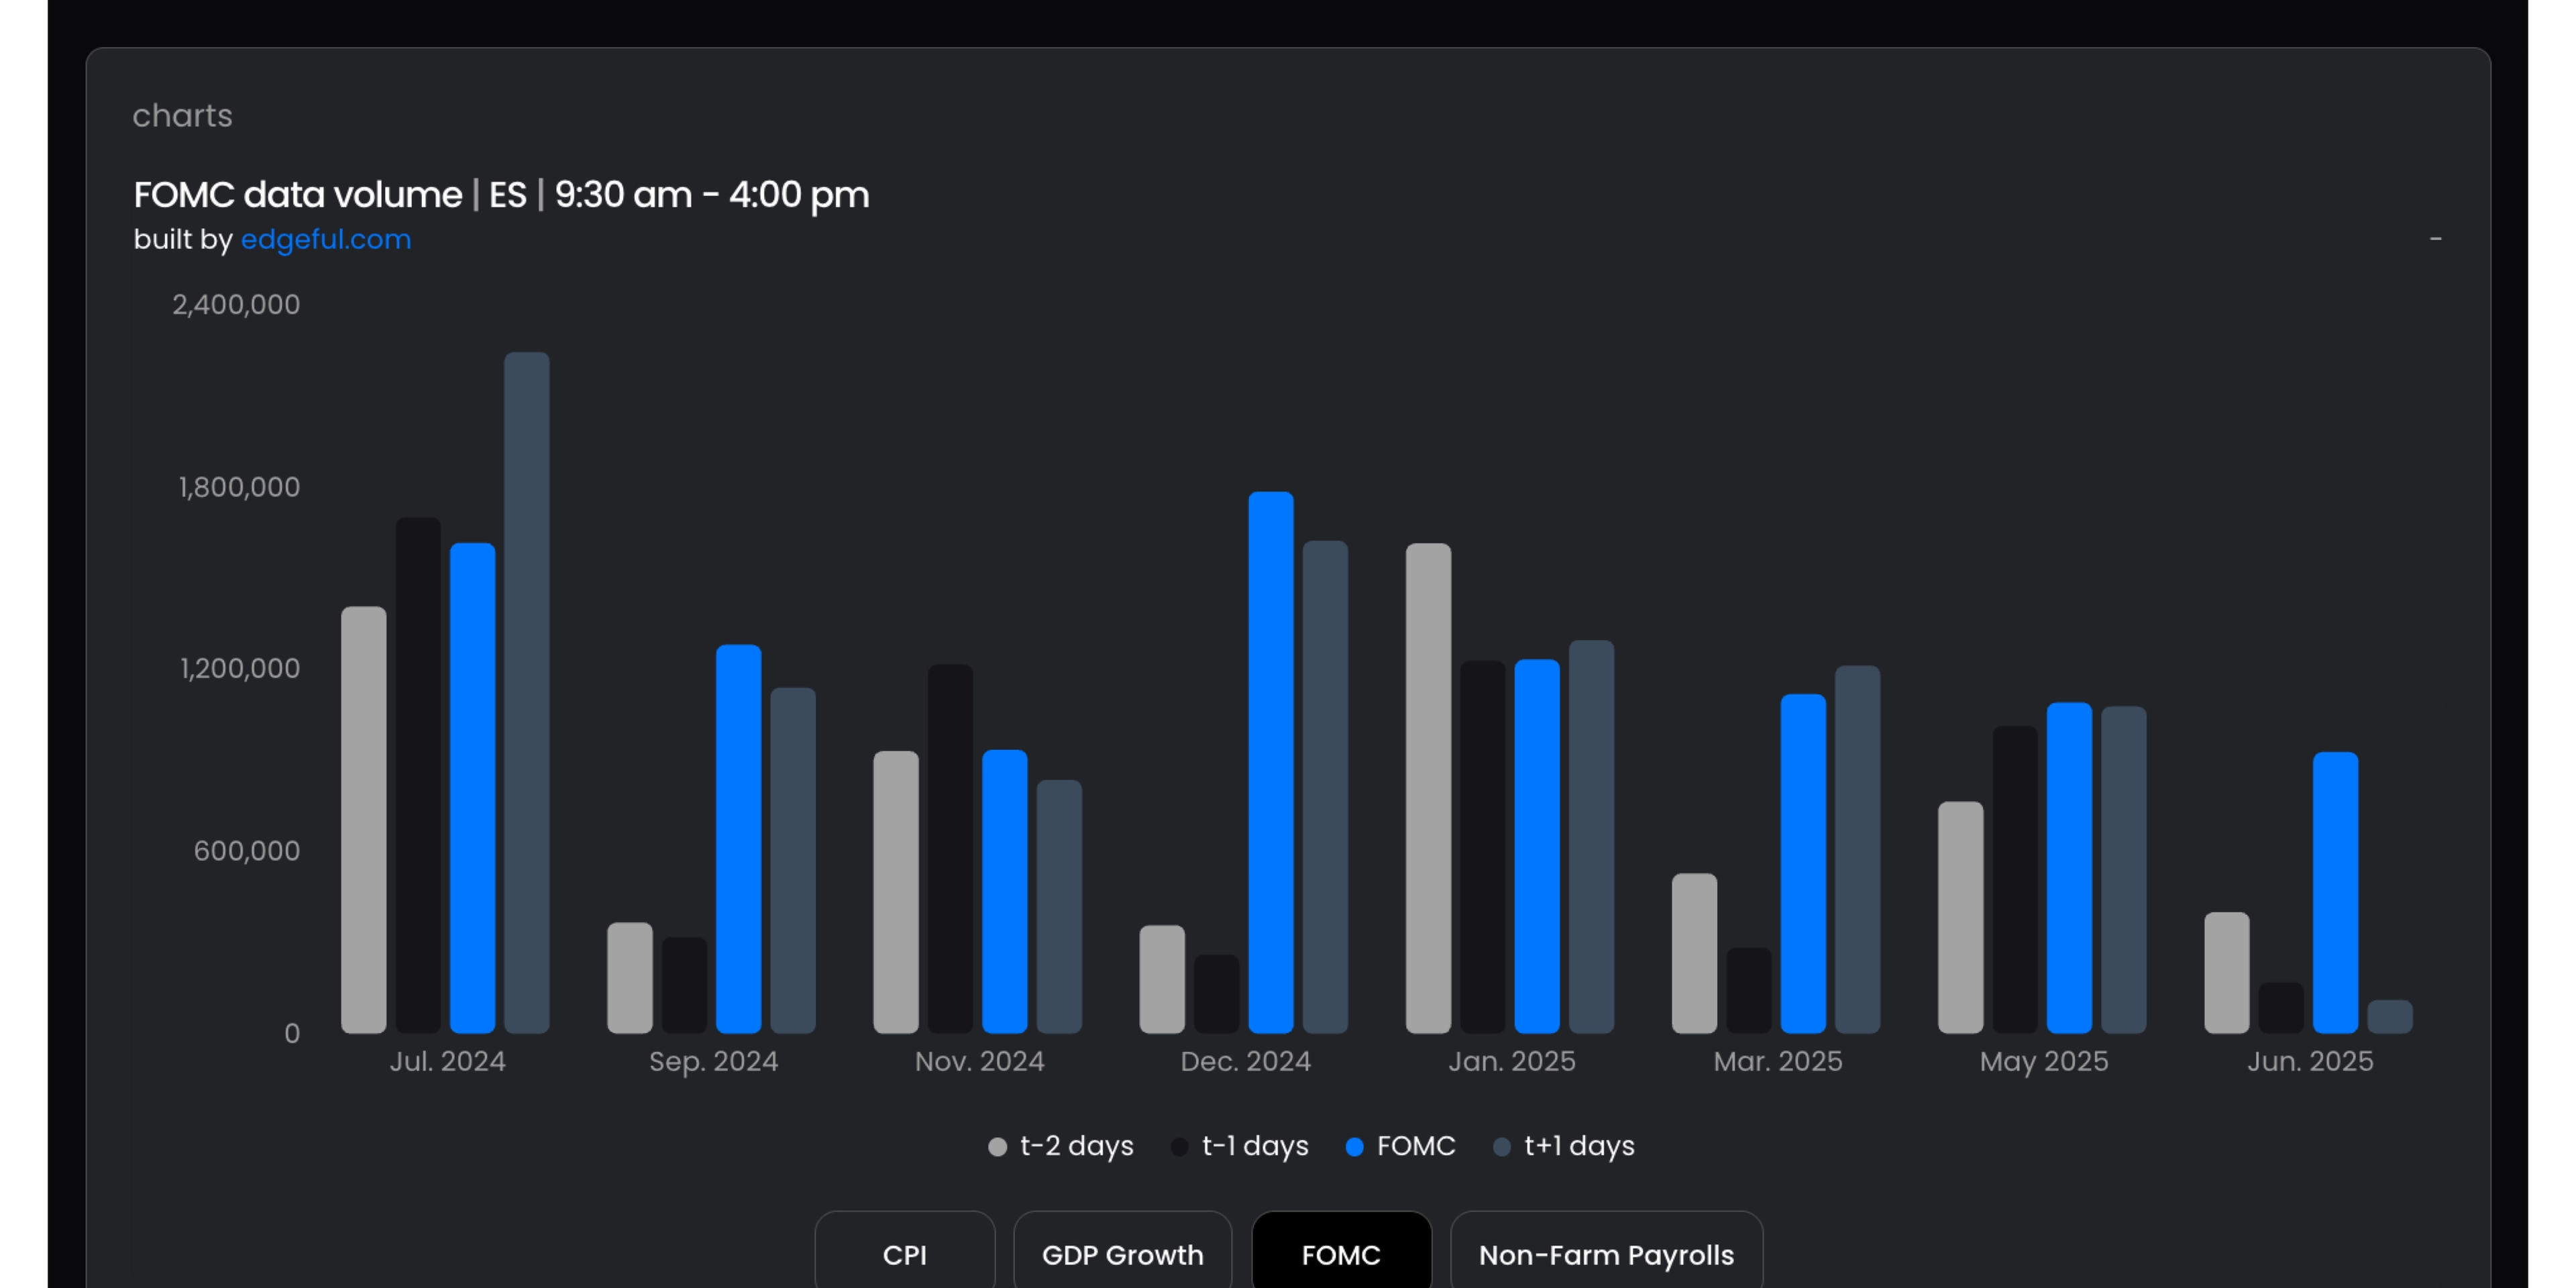
if you've ever blown up your account trading FOMC days, this chart explains exactly why:

our economic data volume report above compares the volume 2 days, 1 day, the day of, and the day after for CPI, GDP Growth, FOMC, and Non-Farm Payrolls economic reports. as you can see in the chart, volume varies drastically on ES when comparing the days before, the day of, and the day after the report. these insights help you build a data-backed trading plan — as volume is a key driver of most profitable trading strategies.
most traders see FOMC on the calendar and assume they know what to expect. but look at July 2024 vs September 2024 - completely different volume patterns requiring opposite strategies. that's why 90% of traders get demolished during federal reserve announcements.
here's the truth: most traders lose money trading FOMC because they're trading the same size and strategy every day, regardless of volume conditions. they get chopped up in low-volume sessions and miss the real moves when volume actually picks up.
table of contents
- understanding FOMC and traditional technical analysis fails
- the volume data that changes everything about FOMC trading
- FOMC performance patterns: what the data reveals
- step-by-step FOMC trading strategy using data
- common mistakes that blow up accounts on FOMC days
- advanced FOMC strategies for different market conditions
what is FOMC and why does it move markets?
the Federal Open Market Committee (FOMC) is the branch of the Federal Reserve that makes decisions about interest rates and monetary policy. they meet eight times per year, and their announcements can dramatically impact every asset class.
why FOMC matters for traders:
- interest rate decisions affect the entire economy
- Jerome Powell's press conference can trigger massive moves
- institutional traders position heavily around these events
- volume and volatility spike dramatically (as shown in our data above)
- normal technical analysis often fails during these sessions
typical FOMC timeline:
- 2:00 PM ET: rate decision and statement released
- 2:30 PM ET: Jerome Powell's press conference begins
- markets react: immediate volatility, then continued moves for hours/days
the problem isn't that FOMC creates volatility — it's that most traders don't understand the volume patterns that determine whether that volatility will be tradeable or just pure chop.
the volume data that changes everything about FOMC trading
here's the actual economic data volume data for ES over the last year during FOMC announcements that most traders have never seen:

the key insight most traders miss:
volume patterns change throughout the year. notice how summer 2024 showed clear FOMC day spikes, while fall 2024 had more distributed volume patterns that were much harder to trade profitably.
this is exactly why using the same FOMC strategy every meeting destroys accounts.
FOMC performance patterns: what the data reveals
beyond volume, you need to understand how markets actually perform around FOMC meetings. edgeful's FOMC performance report tracks average returns for any ticker across multiple timeframes.
ES performance data (last 12 months):

- 3 days pre-FOMC: 0.54% average performance
- FOMC day: 0.48% average performance
- 3 days post-FOMC: 0.33% average performance
what this means for your trading:
the highest average returns come in the 3 days before FOMC meetings (0.54%), not on announcement day itself (0.48%), and surprisingly not on the 3 days following FOMC. this data completely changes how you should approach FOMC trading.
for day traders: focus on volume patterns and pre-announcement intraday patterns for swing traders: position for pre-FOMC using a 2-day continuation strategy.
step-by-step FOMC trading strategy using edgeful’s data
here's exactly how to use both volume and performance data to trade FOMC announcements profitably:
step 1: check the volume data (3 days before)
- open edgeful's economic data volume report for your ticker
- identify which days around FOMC typically have highest/lowest volume
- compare to recent FOMC meetings to spot pattern changes
step 2: adjust strategy based on volume expectations
for low-volume days (like September 2024 pattern):
- reduce position size by 50% or more
- tighten stops (expect more false moves)
- avoid breakout strategies (higher failure rate in low volume environments)
for high-volume days (like July 2024 pattern):
- use normal or slightly larger position size
- give trades more room to work
- focus on momentum and breakout strategies
- be ready to add to winners
step 3: the day before FOMC strategy
based on our volume data, this is often a trap day. volume patterns show either below-average volume or deceptive spikes that don't continue.
recommended approach:
- size down significantly or don't trade
- use tight risk management if trading
- avoid overnight positions going into FOMC
- prepare your FOMC day strategy
step 4: FOMC announcement day execution
pre-announcement (9:30 AM - 2:00 PM ET):
- expect positioning and nervous energy
- volume may be moderate but choppy
- avoid major positions until after announcement
announcement period (2:00 PM - 2:30 PM ET):
- rate decision released at 2:00 PM
- immediate volatility spike
- wait for initial dust to settle
press conference period (2:30 PM - 3:30 PM ET):
- this is where real moves often happen
- volume typically peaks during powell's comments
- look for clear directional moves to trade
using volume data vs performance data: which approach?
volume data approach (best for day trading):
- strengths: shows exact liquidity conditions for each day
- use when: day trading FOMC announcements
- key insight: July 2024 style volume spikes create cleanest intraday moves
performance data approach (best for swing trading):
- strengths: reveals multi-day profit potential
- use when: holding positions through FOMC
- key insight: 1.15% average returns in 3 days post-FOMC
combined approach (professional strategy):
use volume data to time entries and performance data to set profit targets. this gives you both optimal execution and realistic expectations.
common FOMC trading mistakes to avoid
mistake #1: trading too big on low-volume days
don't use your normal size when data shows below-average volume patterns like September 2024. you'll get chopped up in the noise.
mistake #2: only focusing on the post-FOMC continuation
the performance data shows 033% average returns come after FOMC, which is the weakest out of the 3 periods (before, during, and after). most traders think big moves happen after FOMC, and this is not supported by the data!
mistake #3: ignoring volume pattern changes
volume patterns evolve throughout the year. what worked in July 2024 failed in September 2024. check current data, don't rely on old patterns.
mistake #4: not having multiple scenarios planned
have a strategy for high-volume spikes, distributed volume, and low-volume chop based on historical patterns.
mistake #5: revenge trading after getting chopped
taking losses in low-volume periods, then overtrading when volume picks up. stick to your size rules based on the data.
FOMC trading across different asset classes
the beauty of edgeful's reports is you can analyze any ticker. here's how FOMC affects different assets:
futures (ES, NQ, YM):

- note the differences in performance between ES (pictured first) and NQ (pictured above)
- clearest continuation patterns post-FOMC for NQ, not the same for ES
- this type of dynamic data allows you to adapt your strategy to the ticker, and not have to implement a one-size-fits-all strategy for every single ticker you trade
individual stocks:

- tech stocks most volatile (follow QQQ patterns shown above)
- you can run data on every single stock you trade… hint: they’ll all be different!
forex pairs:

- dollar pairs most affected — look at price performance pre, during, and post-FOMC for EURUSD above
frequently asked questions
what time does the FOMC announcement happen?
the FOMC rate decision is released at 2:00 PM ET, followed by Jerome Powell’s press conference at 2:30 PM ET. our volume data shows peak activity typically occurs during the press conference period.
how often does the FOMC meet each year?
the FOMC meets eight times per year, roughly every six weeks. each meeting can create the volume spikes shown in our data, making them critical events for traders.
which assets are most affected by FOMC announcements?
based on our volume analysis, futures contracts (ES, NQ, ES) show the most dramatic volume increases, often 75-200% above normal levels during FOMC days.
should beginners trade during FOMC meetings?
beginners should avoid trading FOMC until they understand volume patterns. our data shows some meetings create 50% below-average volume (harder to trade) while others spike 200% (more predictable but volatile).
what's the difference between volume data and performance data for FOMC trading?
volume data shows liquidity conditions for optimal trade timing, while performance data reveals profit potential over multiple days. day traders focus on volume, swing traders use performance metrics.
how do I access historical FOMC volume and performance data?
edgeful provides both the economic data volume report and FOMC performance report for any ticker, with customizable timeframes to match your trading style. all you have to do is sign up!
do FOMC volume patterns work for crypto and forex?
yes, you can analyze FOMC volume patterns for crypto pairs and forex using the same edgeful reports. bitcoin and major dollar pairs often show similar institutional flow patterns.
key takeaways
here's what every trader needs to know about trading FOMC:
- volume patterns change throughout the year - July 2024's 75% spike vs September 2024's distributed pattern
- post-FOMC period shows highest average returns (1.15% over 3 days on ES)
- day traders should focus on volume data, swing traders on performance data
- most profitable approach combines both volume timing and performance targeting
- different asset classes show unique FOMC volume signatures
- position sizing must adjust based on expected volume conditions
start trading FOMC with a data advantage
if you're tired of getting destroyed on federal reserve announcement days, it's time to start using data instead of emotions to guide your trading decisions.
edgeful's economic data volume report and FOMC performance report give you the exact patterns shown in this analysis. you'll know which days to size up, which days to avoid, and how to position for the highest-probability post-FOMC moves.
remember — the difference between successful FOMC traders and everyone else isn't luck or intuition. it's having the right data to make informed decisions about when and how aggressively to trade around federal reserve announcements.
stop trading blind on FOMC days when you can trade with volume and performance data that reveals exactly when the real opportunities occur.


