free trading risk calculator: know how many losses until you blow your account
welcome back to stay sharp.
let me ask you something uncomfortable: how many consecutive losing trades can your account actually survive?
if you had to think about it for more than a second... that's a problem.
most traders can't answer this question. they pick position sizes based on gut feel — "$500 per trade sounds reasonable" — without ever doing the math on what happens when losses start stacking up.
and then a losing streak hits, you panic, and somehow you've failed a bunch of challenges or blown your personal account.
table of contents
- the trading risk calculator
- example 1: $10,000 account risking 2% per trade
- example 2: $100,000 account risking 5% per trade
- the probability matrix
- the final section of the trading risk calculator
- the risk guide
- how to actually use the trading risk calculator
- what's next for the trading risk calculator
- frequently asked questions
I hate hearing stories like this — so today, I'm sharing a free trading risk calculator we just built that answers this question in about 3 seconds:
the trading risk calculator
we launched a completely free trading risk calculator that shows you exactly where you stand.
if you're already an edgeful member, you'll also find this in your sidebar inside the app.
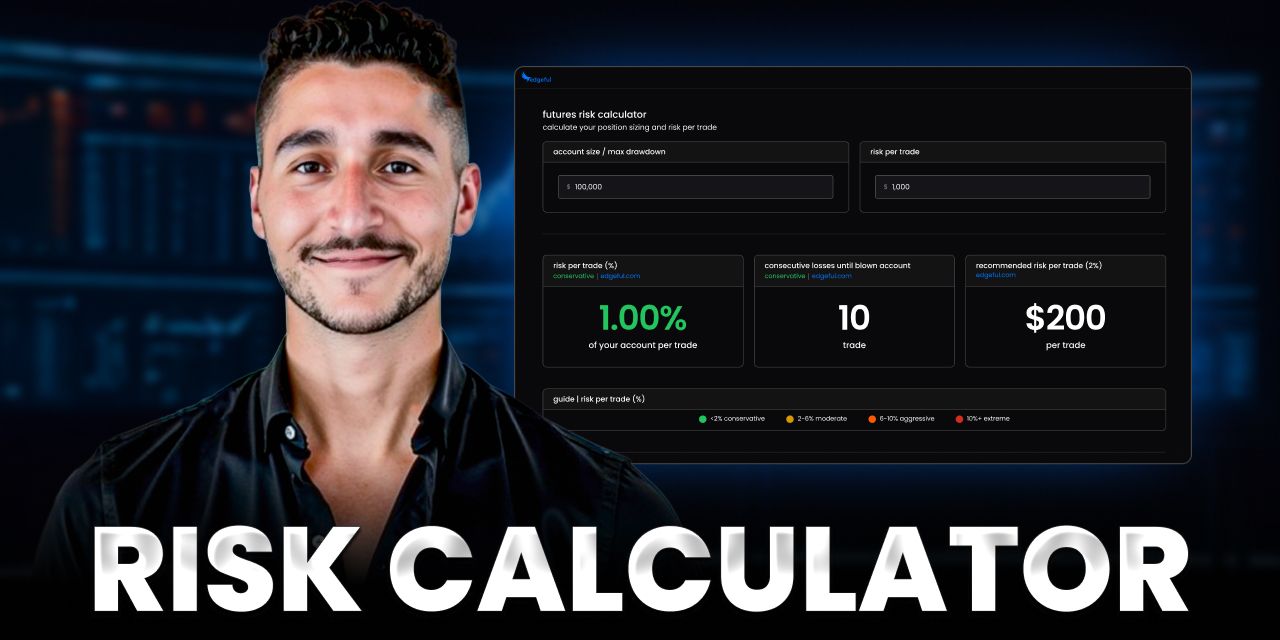
here's what the trading risk calculator does:
- input your account size (or max drawdown if you're trading a prop firm account)
- input your risk per trade in dollars
- instantly see your risk percentage, how many consecutive losses it takes to blow your account, and what you should actually be risking
you don't have to sign up or give us your email to access it. we just want you to be able to use the trading risk calculator to become a more profitable trader. that's it.
→ try the trading risk calculator
→ watch the full video walkthrough
let me walk you through a couple examples using the trading risk calculator so you can see how this works in practice.
example 1: $10,000 account risking 2% per trade
let's say you have a $10,000 account and you're risking $200 per trade. that's 2% risk — which falls into the conservative category.
here's what the trading risk calculator tells you:
- risk classification: conservative (≤4%)
- consecutive losses to blow account: 50 trades
- recommended risk per trade: $200 (2% of account)
when you're risking 2% of your account per trade, it takes 50 consecutive losing trades to blow your account. pretty unlikely you'll hit 50 losses in a row — so that's why we've categorized 2% risk as "conservative".
even if you hit a brutal losing streak of 10+ trades in a row, you're still in the game with plenty of capital left to recover.
this is what proper risk management looks like. instead of focusing only on how much you can make if your next trade is a loser — you're protecting yourself and taking care of the downside first.
example 2: $100,000 account risking 5% per trade
now let's look at a larger account with more aggressive sizing. $100,000 account, risking $5,000 per trade. that's 5% risk — which pushes into the moderate category.
here's what changes:
- risk classification: moderate (4-8%)
- consecutive losses to blow account: 20 trades
- recommended risk per trade: $4,000 (4% of account)
you'll notice the colors in the trading risk calculator get darker as your risk increases. that's intentional — it's visual feedback showing you when you're moving from conservative to moderate to aggressive territory.
20 consecutive losses sounds like a lot... until you look at the probability matrix that I've referenced multiple times throughout the past couple of months:
the probability matrix
this is where things get real.
the trading risk calculator shows you the probability of actually hitting a losing streak based on your win rate. not theoretical worst-case scenarios — actual statistical likelihood within 100 trades.
this chart shows the likelihood of hitting X consecutive losses within 100 trades.
let's say you're a 50% win rate trader (which is solid, by the way). look at the row for 50%:
- 5 losses in a row? 95% chance it happens.
- 7 losses in a row? 52% chance.
- 10 losses in a row? still a 9% chance.
now think back to that $100,000 account risking 5% per trade. you need 20 consecutive losses to blow the account. at a 50% win rate, the probability of that happening is essentially 0%.
sounds safe, right?
but here's the thing — most traders don't actually have a 50% win rate, especially when they're still developing their edge. and even if you do, a 10-trade losing streak (9% probability) wipes out half your account at 5% risk per trade.
can you mentally and emotionally handle watching $50,000 disappear while trusting the process?
that's why we recommend staying at 4% or below. it's not about the math being impossible at higher levels — it's about giving yourself enough room to survive the learning curve and stay grounded emotionally.
if you want the deeper breakdown on the math behind losing streaks, I covered it in detail in the math behind consecutive losses.
the final section of the trading risk calculator
if you scroll below the input fields I've shown above, you'll find this interactive section of the page:
the stats above are based on a 100k account, risking 10% of the account per trade (aggressive).
what it's showing you is the chances you hit 10 straight losses based on your win rate. so on the left, there's a 42% chance you'll hit 10 straight losses with a 40% win rate.
the next is the probability of 10 straight losses with a 50% win rate, which is 9%.
then a 1% chance you hit 10 straight losses with a 60% win rate. and finally, the chance you hit 10 straight losses with a 70% win rate (which is 0%).
the output is always related to your risk per trade, so you'll be able to test different levels of risk and find what you're comfortable with.
the risk guide
the trading risk calculator classifies your risk level so you know exactly where you stand:
- ≤4% per trade = conservative
- 4-8% = moderate
- 8-12% = aggressive
- ≥12% = extreme
our recommended baseline is 2%. if you're above that, you're not necessarily wrong — but you should at least know that's where you are and have a reason for it.
the traders I talk to who blow accounts almost always fall into two categories:
- they had no idea what percentage they were actually risking
- they knew it was aggressive but figured they'd "scale back after a few wins"
the trading risk calculator eliminates category one entirely. and hopefully seeing the consecutive loss numbers makes category two think twice.
for a deeper dive into risk management rules, check out the 9 risk management rules that separate profitable traders from everyone else.
how to actually use the trading risk calculator
before your next trade, take 30 seconds and run your numbers.
- for retail traders: input your actual account balance and current risk per trade. see where you land.
- for prop firm traders: this is important — use your max drawdown as the "account size" input, not the notional account value. if you have a 150k account with a 10k max drawdown, you're really working with 10k. that's your real risk ceiling.
play with the numbers. see what happens if you drop from 2% risk to 1%. see how many more losses you can withstand. see how the probability of blowing your account changes across different win rate scenarios.
the goal isn't to never lose — it's to structure your risk so that losing streaks don't end your trading career. not over the course of one week. not over the course of one month. over the long term.
what's next for the trading risk calculator
this is version one. we're planning to add more features over time — things like contract-specific calculations for NQ, ES, and other futures, plus more detailed position sizing tools. if there's something specific you'd like to see, just reach out to support inside the app and let us know — or reply directly to this email.
frequently asked questions
how many consecutive losses does it take to blow a trading account?
the number of consecutive losses it takes to blow your account depends entirely on your risk per trade. if you're risking 2% per trade, it takes 50 consecutive losses. at 5% risk, it's 20 losses. at 10% risk, just 10 losses. the trading risk calculator shows you this number instantly based on your specific inputs.
what percentage should I risk per trade?
we recommend risking 2-4% of your account per trade for most traders. this falls into the "conservative" category and gives you enough buffer to survive inevitable losing streaks. the trading risk calculator will show you exactly how your risk percentage affects your account survivability.
how do I calculate risk per trade for futures?
for futures traders, use your max drawdown as the account size input in the trading risk calculator — not the notional account value. if you have a 150k prop firm account with a 10k max drawdown, enter $10,000 as your account size because that's the actual capital you're working with.
is 2% risk per trade safe?
2% risk per trade is considered conservative. at this level, you'd need 50 consecutive losing trades to blow your account — which is statistically very unlikely even with a 40% win rate. the trading risk calculator confirms this and shows you the exact probabilities.
what is risk of ruin in trading?
risk of ruin is the probability that you'll lose enough capital to stop trading. it's based on your win rate, risk per trade, and reward-to-risk ratio. the trading risk calculator helps you understand your risk of ruin by showing the probability of hitting consecutive losses at different win rates.
final thought
the traders who stick around long enough to get good aren't the ones who win the most. they're the ones who sized their positions correctly while they were still learning.
go run your numbers → edgeful.com/trading-risk-calculator
p.s. — the trading risk calculator is 100% free. no account needed, no strings attached. just a tool that should exist for every trader.