
the initial balance ending zone, explained with 6 months of data
most traders who use the initial balance know one stat about it: whichever side of the range forms first, the other side usually breaks.
the initial balance ending zone is a customization on the same report that tells you which of those sessions to trust. over the last 6 months it took that bias from 63.4% on NQ and 59.5% on ES up to roughly 86% on both, according to edgeful data covering 131 NY sessions per ticker.
table of contents
- what the initial balance ending zone measures
- the stat most traders already use: IB by rejection
- does the initial balance ending zone actually work?
- what happens when the initial balance ending zone points the other way
- a real session: NQ, Thursday, September 3
- where these sessions actually close
- how to see the ending zone on your charts
- common mistakes with the initial balance ending zone
- key takeaways
what the initial balance ending zone measures
the initial balance is the range built by the high and the low of the first hour of the session. in the NY session that runs 9:30am to 10:30am ET.
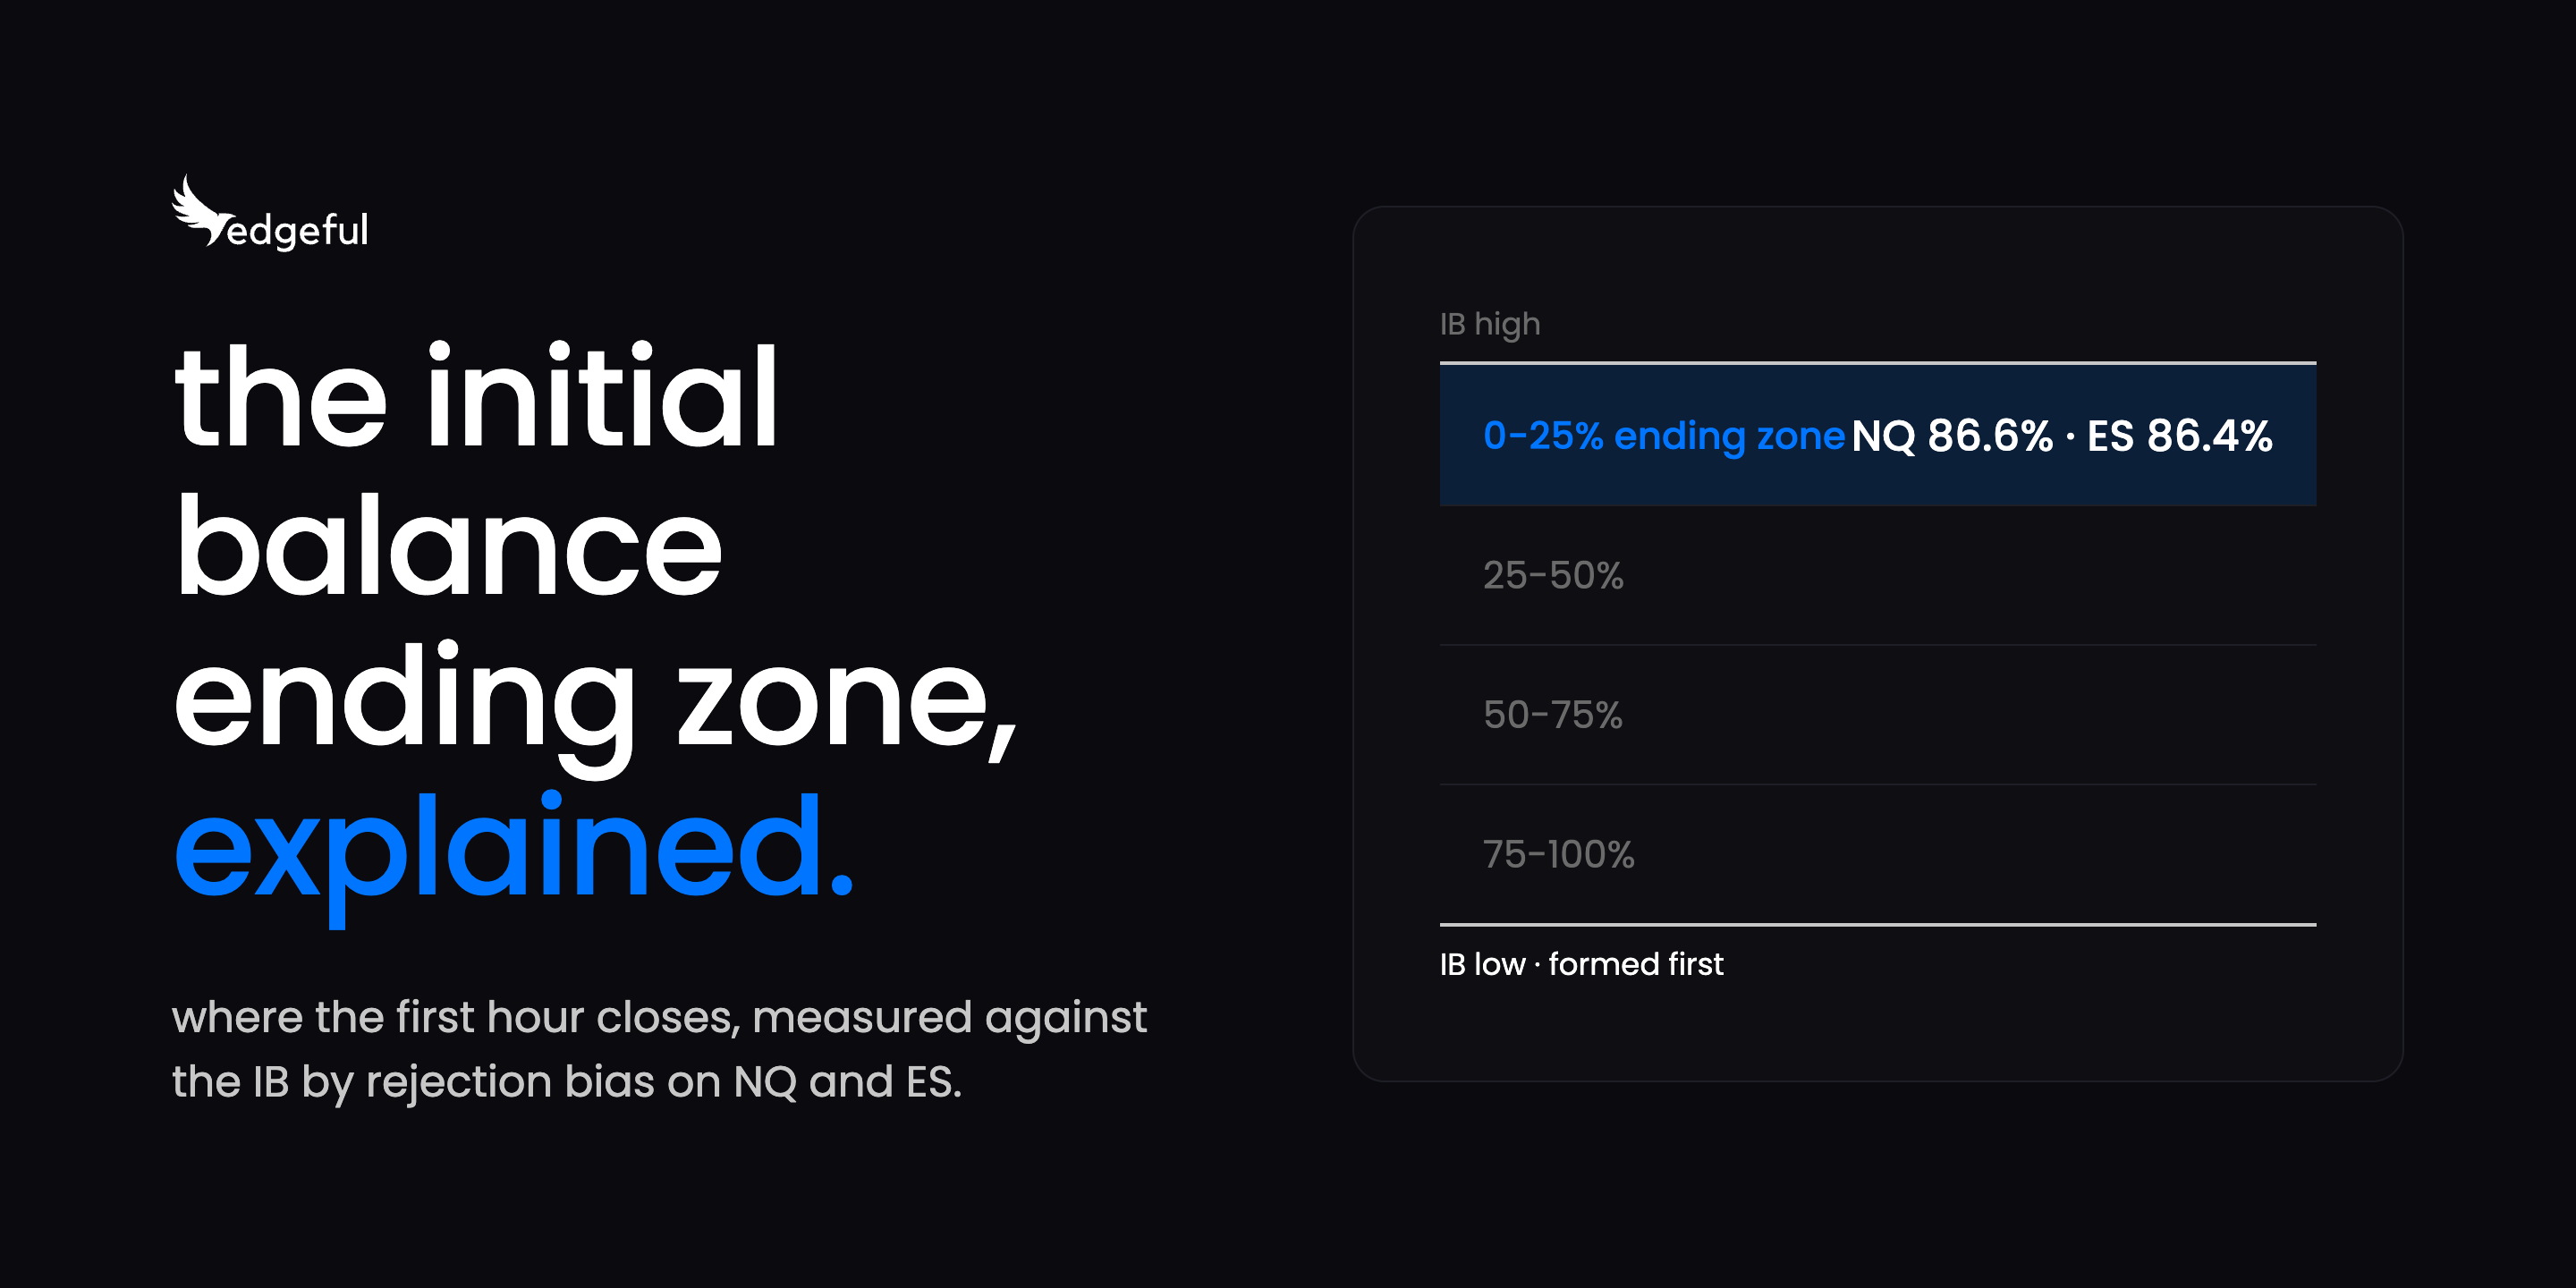
the initial balance ending zone measures one thing: where price closes at the end of that hour, expressed as a percentage of the IB range.
the part that confuses people is that which side counts as 0% changes every single day, depending on which level formed first.
- if the IB low forms first, a 0-25% ending zone means price closed the hour up near the IB high
- if the IB high forms first, a 0-25% ending zone means price closed the hour down near the IB low
either way, a 0-25% reading puts price on the side you're already expecting to break, before it breaks. 75-100% is the opposite: price has come back toward the level that formed first, away from the one you're watching.
that single detail is why the customization gets misread. if you assume 0% always means the bottom of the range, you'll be wrong roughly half the time, because on high-formed-first days 0% is the bottom and on low-formed-first days it's the top.
the stat most traders already use: IB by rejection
before the ending zone is useful, you need the stat it improves.
the IB by rejection subreport tracks which side of the initial balance formed first during that opening hour. the bias that comes out of it is simple: whichever side forms first, the other side is usually the one that breaks. if you want the full mechanics of trading that break, we covered it in our initial balance breakout strategy guide.
here is what that bias produced over the last 6 months on ES and NQ, NY session, 60 minute IB:
- NQ, low formed first: 73.0%
- NQ, high formed first: 54.4%
- ES, low formed first: 61.8%
- ES, high formed first: 57.1%
73.0% on NQ is the only one of those four above 65%. combined across both directions, the bias comes out at 63.4% on NQ and 59.5% on ES.
NQ's short side is the weak spot, and it has been getting weaker. that 54.4% covers the full 6 months. narrow the window to the last 60 days and it drops to 50.0%. narrow it again to the last 30 and it drops to 42.9%. the sample gets small as the window shrinks, but the direction has been down.
does the initial balance ending zone actually work?
to test it, we filtered the same 6 months down to the sessions that closed in 0-24.99%, meaning price finished the opening hour already on the side the by rejection bias was pointing at.
on those sessions, the expected side broke first:
- NQ: 86.6% (58 of 67 sessions)
- ES: 86.4% (57 of 66 sessions)
same tickers, same NY session, same 6 months. combined across both directions, NQ goes from 63.4% to 86.6% and ES from 59.5% to 86.4%.
the condition is common enough to plan around. it showed up on 67 of 131 NQ sessions and 66 of 131 ES sessions, so roughly half the days you sit down.
the reason the initial balance ending zone helps is straightforward. the by rejection bias only uses which level formed first, which is information from the start of the hour. this customization adds where price actually finished that hour. when both point the same way, price has already closed the hour near the level you're watching.
what happens when the initial balance ending zone points the other way
the reverse case is worth knowing, with a caveat attached.
on sessions that closed in 75-100%, meaning price came back toward the level that formed first, the expected side broke first only 25.0% of the time on NQ and 12.5% on ES.
those percentages rest on 8 sessions per ticker across the full 6 months, which is nowhere near enough to build a strategy on. it moved the same direction on both tickers, which makes it worth logging. when the two point opposite ways, the by rejection bias held up far less often, on a small sample.
a real session: NQ, Thursday, September 3
the IB low formed first on NQ that morning, so the by rejection bias pointed at the high breaking first.
by 10:30am ET, price had closed the opening hour in the top quarter of the IB range, up against a high that had not broken yet. that is a 0-24.99% initial balance ending zone, and it agreed with the bias.
the IB high broke first, and the session closed above it. on this particular day price pulled back into the middle of the range before running. the 86.6% figure describes how often the expected side breaks first.
where these sessions actually close
knowing which side breaks first is only half of a plan. the other half is whether the break holds into the close.
the IB by close subreport answers that. run on the same filtered sessions, where the low formed first, the high broke first, and the initial balance ending zone was 0-24.99%:
- NQ: 54.5% closed above the IB high, 33.3% closed back inside the range, 12.1% closed below the IB low (33 sessions)
- ES: 63.6% above, 30.3% inside, 6.1% below (33 sessions)
and on the short side, where the high formed first and the low broke first:
- NQ: 52.0% closed below the IB low, 44.0% inside, 4.0% above (25 sessions)
- ES: 58.3% below, 33.3% inside, 8.3% above (24 sessions)
both directions on both tickers closed outside the IB more than half the time, which matters if you plan exits past the level. the gap between the two numbers is worth knowing: roughly 86% on the break, then 52.0% to 63.6% on the close depending on ticker and direction.
the sessions that failed mostly closed back inside the range. few reached the far side. on NQ's short side, 44.0% closed back inside and only 4.0% closed on the far side. if you're managing exits mechanically, our IB breakeven stop algo walks through one way to handle that middle outcome.
how to see the ending zone on your charts
the initial balance ending zone lives inside the IB by rejection subreport on edgeful. open the initial balance report on the ticker you trade, set the IB period to 60 minutes, then switch on the ending zone customization in the by rejection view. it will show which level formed first alongside the closing value for each session.
every number here came out of the edgeful API. if you'd rather run this yourself across your own tickers and windows, or build it into a dashboard you check every morning, the API returns the same by rejection and by close data.
build your own dashboards with the edgeful API
two settings change the numbers meaningfully, so check both before you compare anything to the figures above: the session you're running (everything here is the NY session, 9:30am to 4:00pm ET) and the IB length (everything here is 60 minutes).
if you want the range drawn on your chart while you trade, our initial balance indicator for TradingView plots the IB high, low, and retracement levels automatically. and if you want a setup like this running without you at the screen every morning, our GC trading strategy: the initial balance algo breaks down how the IB algos handle entries and exits.
all of these numbers are ES and NQ. run it on your own ticker before trading it, because these numbers come from two instruments over one specific window and they will move.
common mistakes with the initial balance ending zone
assuming 0% always means the bottom of the range. 0% falls on the side opposite whichever level formed first, so it flips day to day. this is the single most common misreading, and it inverts the bias on half of all sessions.
treating 86% as a promise the session trends. it describes how often the expected side breaks first. the by close numbers, between 52.0% and 63.6% depending on ticker and direction, describe how often the move holds into the close.
trading the 75-100% case as an inverse bias. 8 sessions per ticker is too small a sample to trade against.
comparing numbers across different settings. a 30 minute IB on a custom session produces a different distribution than the 60 minute NY session numbers here. match the settings before you compare.
key takeaways
- the initial balance ending zone measures where price closes at the end of the opening hour, as a percentage of the IB range
- which side counts as 0% flips daily depending on which level formed first, and 0-25% always means price closed on the side you're expecting to break
- on its own, the IB by rejection bias came out at 63.4% on NQ and 59.5% on ES over the last 6 months of NY sessions, with NQ's short side the weakest at 54.4% and sliding
- filtering to sessions with a 0-24.99% ending zone raised that to 86.6% on NQ and 86.4% on ES, on roughly half of all sessions
- the break holding into the close is a separate question, and those numbers run between 52.0% and 63.6% depending on ticker and direction, on 24 to 33 sessions per group
- when the ending zone and the bias point opposite ways (75-100%), the expected side broke first only 25.0% of the time on NQ and 12.5% on ES, on 8 sessions per ticker, which is too small to trade against
edgeful provides historical performance data to help traders make informed decisions. this does not constitute financial advice. past performance is not indicative of future results. all trading involves risk. always do your own analysis and manage your risk accordingly.
