
the edgeful IB masterclass, written out: how to build a data-backed NQ setup
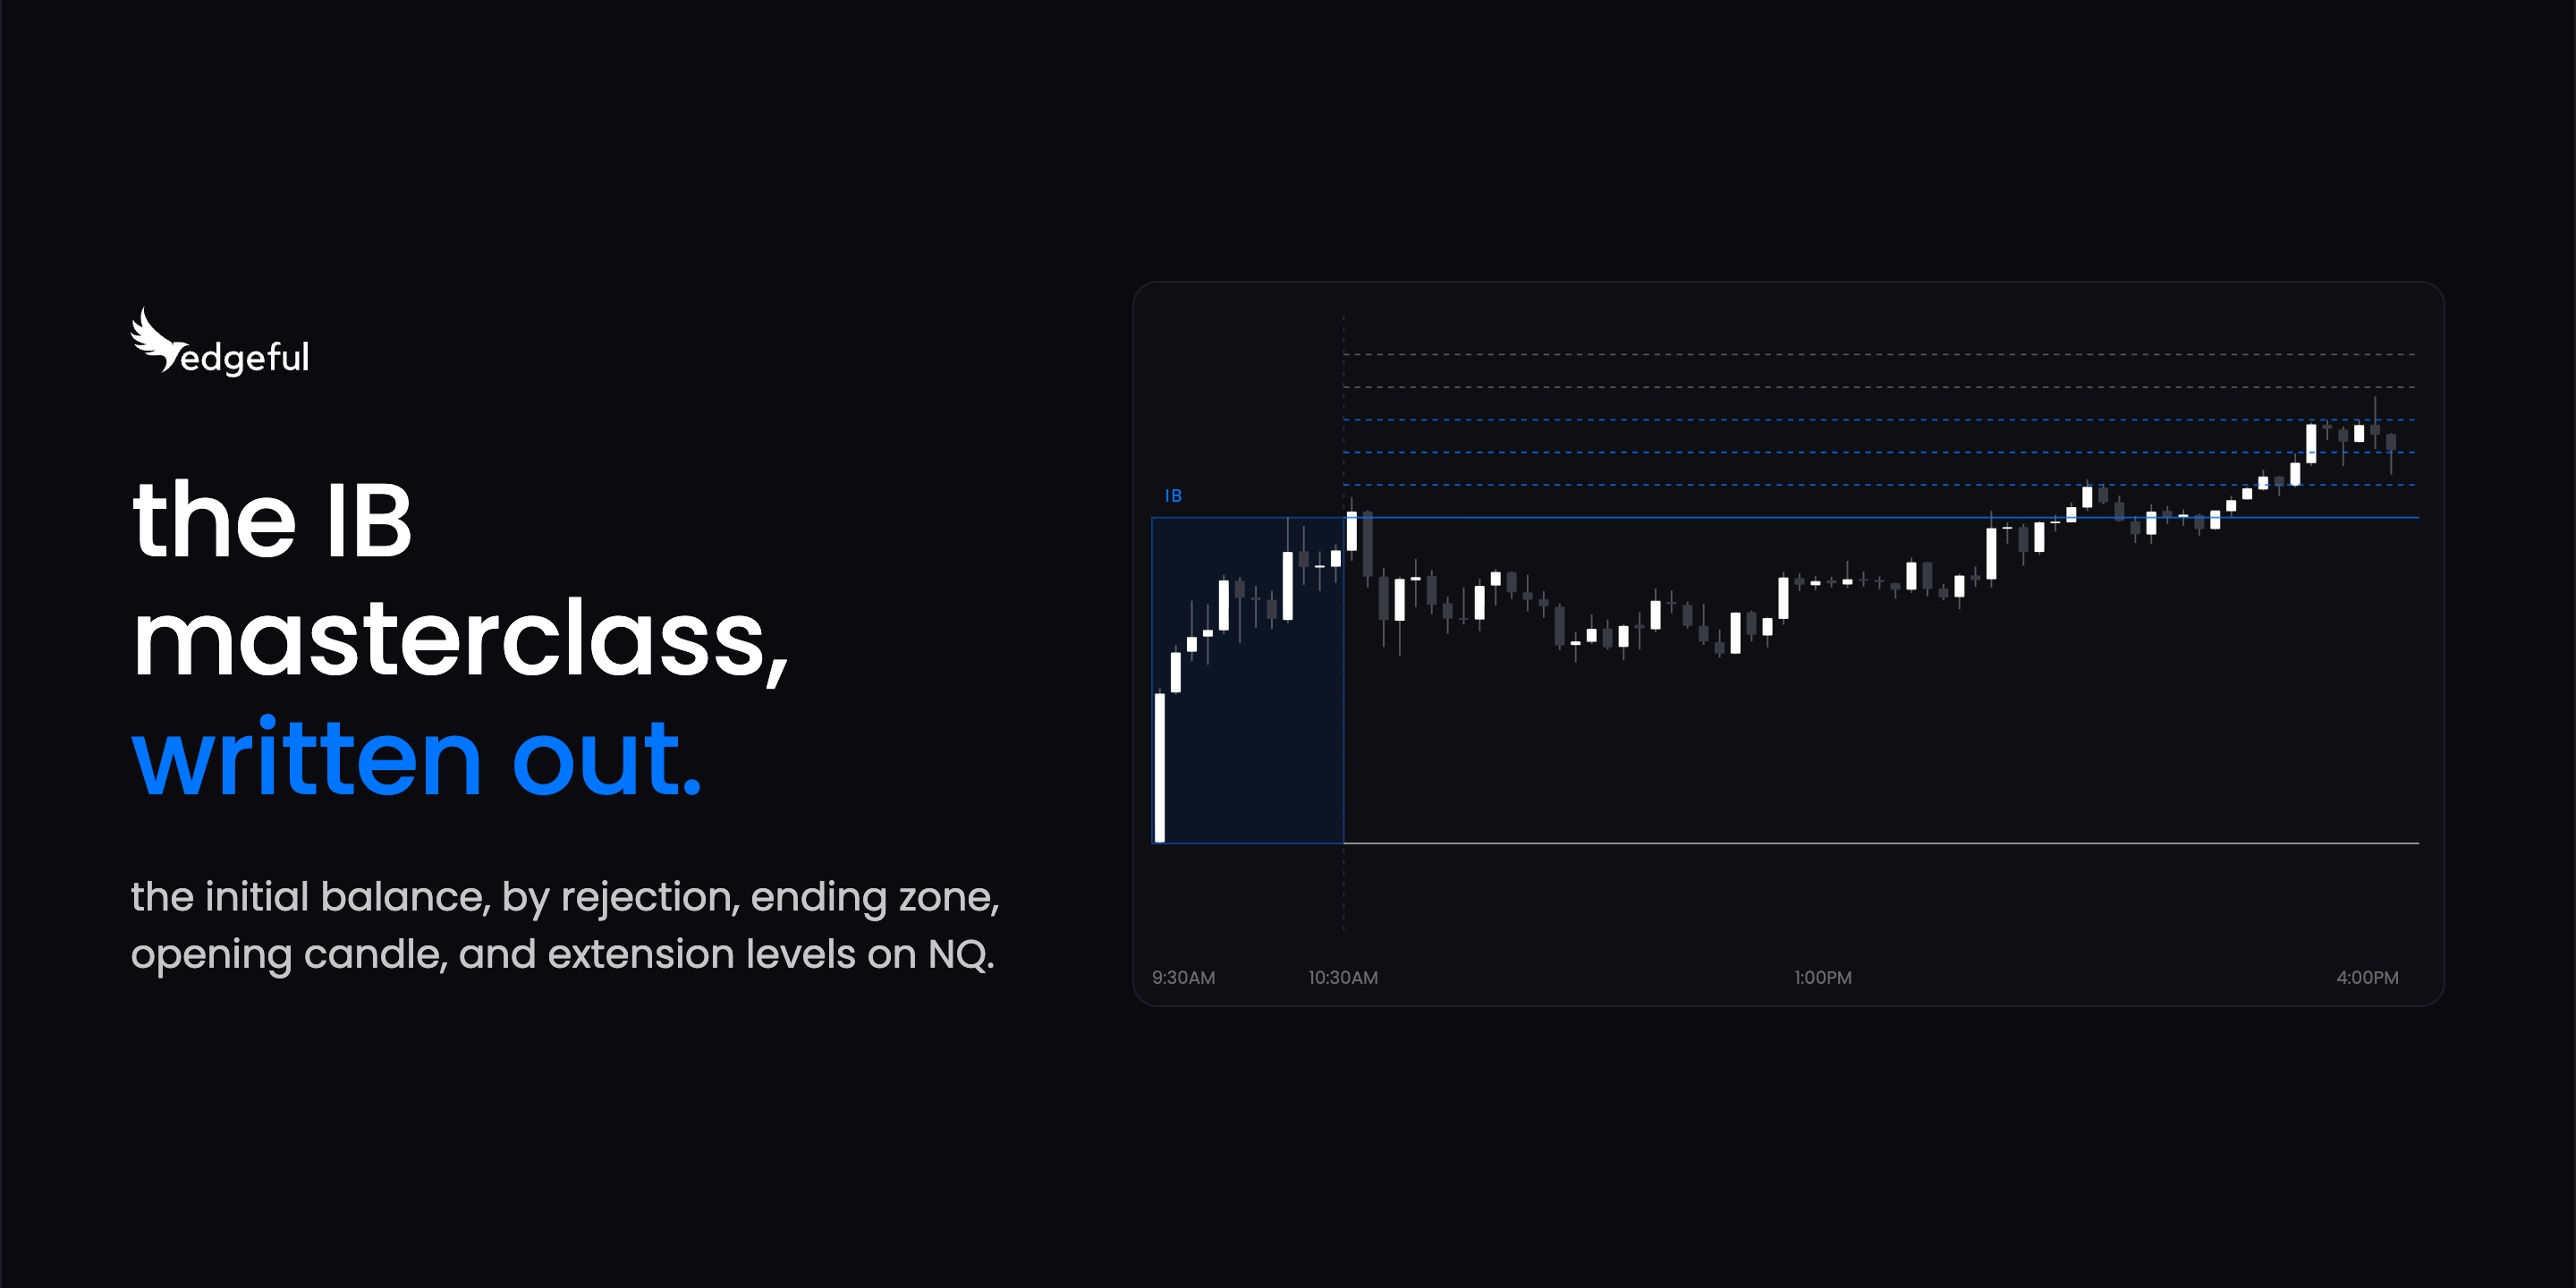
this is the written version of our initial balance masterclass. if you'd rather read than watch, everything from the video is here, with numbers from the last 6 months of data (as of September 25, 2026).
the whole point of this masterclass is to show you how to trade with data instead of your emotions. we're going to combine a few of the most popular reports on edgeful into one setup, where every piece of the trade has data behind it.
before we start: this is not a get rich quick scheme. anyone who's traded for a while knows there's no holy grail. what I'm going to show you is how to build a process that holds up as the market environment changes.
if you've been struggling to pass evals or get payouts, this is for you. most of what you're doing right now is probably based on feel. feel might work in one market environment, but when the market shifts, it stops working... and you need something that keeps you consistent through those shifts.
my name is André, I'm the CEO of edgeful. I used to work at Goldman Sachs, then I left and built edgeful.
table of contents
- what a report actually is
- the foundation: the initial balance
- which side will break: the IB by rejection subreport
- going one level deeper: the IB ending zone
- more confluence: the opening candle continuation
- entries and stops
- targets: the IB by levels subreport
- the full setup, recapped
what a report actually is
before we get into the setup, you need to understand what a report is, because everything else builds on it.
a report measures a specific setup. it answers a "how often" question:
- how often does Friday make the high of the week?
- how often does Monday have the highest volume or range?
- how often does price break one side or both sides of the initial balance?
- how often does price continue on FOMC if the first reaction is positive?
we have reports for the ORB, gap fills, outside days, inside bars, engulfing candles, fair value gaps, and a lot more. there are 150+ reports on the platform, and every one of them measures a specific outcome.
every report page has the same layout:
- live data at the top
- the historical data for your ticker and timeframe
- streaks
- a table with every single day of results from the last 6 months, so you can go through the individual days yourself
- an explainer video
watch the explainer videos. put them on 2x speed if you want, I don't care... but watch them. each one covers what the report measures and how to use it with live chart examples. sometimes you'll assume a report measures one thing when it actually measures something else, and the video clears that up.
the foundation: the initial balance
the "initial balance" is the high and the low of the first hour of the NY session, 9:30AM to 10:30AM ET.
once that range is set, there are 3 outcomes the IB report tracks:
- single break: price breaks one side of the IB (the high or the low) and never breaks the other
- double break: price breaks both the high and the low
- no break: price breaks neither side
here's how those have played out on NQ over the last 6 months in the NY session:
- single break: 75.97% of days (98 out of 129)
- double break: 17.83% of days (23 out of 129)
- no break: 6.2% of days (8 out of 129)
you'll usually see the no-break days on a holiday, or on a day with a huge IB after a wild morning. those days are rare, and the data shows it.
add up the single and double breaks and price has broken at least one side of the IB on 93.8% of days (121 out of 129). and on most days, it only breaks one side.
that means the moment price breaks the IB high, you don't want to expect it to come back and break the low too. it can happen, but it's not what the data favors. once one side breaks, you've likely found the direction of the day, and you're looking for continuation and extensions. that's the foundation of this entire setup.
one thing I need you to understand about stats like this. Steph Curry makes over 90% of his free throws. that doesn't mean you'd bet your entire net worth on his next free throw. it means that over time, he makes about 9 out of 10.
same thing here. a number that shows up this often doesn't mean you risk your account on the next trade, because the next one might not play out. you take small, controlled trades over a couple of months to take advantage of stats like this.
which side will break: the IB by rejection subreport
at 10:30AM ET, the IB is set. you know one side is very likely to break. but which one?
you don't want to wing it here. you want data telling you whether price is more likely to break the high or the low.
that's the IB by rejection subreport. a subreport is always a variation or a filter on the main report, and you'll find all of them in the left sidebar under the report. IB by rejection uses the same initial balance concept, but it looks at which side of the IB formed first.
reading the chart from left to right: did the low of the first hour print before the high, or did the high print before the low?
the charts in this post all come from the same day on NQ: Tuesday, September 22, 2026. the IB low formed at 9:30AM ET, the high formed second at 10:10AM ET, and the high broke first right after 10:30AM ET.
you don't have to figure this out by eye. what's in play (in the left sidebar) tells you which side formed first, and so does the dashboard on the edgeful TradingView indicator. it's right on your chart.
here's what the data shows on NQ over the last 6 months in the NY session:
- when the IB low formed first, price broke the IB high first 78.12% of the time (50 out of 64 days)
- when the IB low formed first, price broke the IB low first just 20.31% of the time (13 out of 64 days)
so on a day where the low forms first, you're expecting the high to break. again, that doesn't mean it happens today or tomorrow. it means that over time, this is how it's played out.
the other direction has been weaker over this window. when the IB high formed first, price broke the IB low first 50.77% of the time (33 out of 65 days).
going one level deeper: the IB ending zone
this isn't meant to be a deep technical overview of edgeful, we have all of those videos inside the platform. but there's one customization inside the by rejection subreport that's a massive amplifier for this setup: the IB ending zone.
the ending zone filters by where price was at the end of the IB period, at 10:30AM ET.
if you turn on the retracement levels on the IB indicator, it cuts the IB into 4 even quarters. the ending zone tells you which quarter price finished the hour in. 0-25% is always the quarter right up against the side that formed second. so if the low formed first, 0-25% is the top quarter of the range, right up against the IB high.
say the low formed first and price finished the hour right near the high, in that 0-25% zone. select 0-25% in the customization, click save, and look at how the data changes.
on NQ over the last 6 months in the NY session:
- low formed first + price ended the IB in the 0-25% zone (near the IB high): the high broke first 90% of the time (36 out of 40 days)
- high formed first + price ended the IB in the 0-25% zone (near the IB low): the low broke first 73.33% of the time (22 out of 30 days)
that second one is the short side from the last section. on its own, high formed first was 50.77%. add the ending zone and it goes to 73.33%.
now look at what happens when price ends the hour in the 25-50% zone instead, closer to the middle of the range:
- low formed first + 25-50% zone: the high broke first 66.67% of the time (12 out of 18 days)
- high formed first + 25-50% zone: the low broke first just 8 out of 21 days (38.1%)
the bias gets a lot weaker. on the short side it's close to a toss-up which side breaks first.
so the next step is adding another report for confluence.
more confluence: the opening candle continuation
this is how the setup gets built. the initial balance is the foundation, it breaks at least one side on 93.8% of NQ days over the last 6 months in the NY session. then we layer in other reports and customizations to tell us which direction to take that break.
the next report is the opening candle continuation. what's nice about this one is that it also uses the first hour of the session. the IB forms in the first hour, the by rejection subreport is part of the IB so it forms in the first hour too, and the opening candle continuation forms in the first hour. everything shows up at once, which is a big part of why this setup works so well.
the "opening candle" here isn't the actual first candle on your chart. it's the open to the close of the first hour. is the 10:30AM ET price higher or lower than the 9:30AM ET price?
- higher = green opening candle
- lower = red opening candle
the indicator plots this for you on your chart, and it's in what's in play too. you can get all the edgeful indicators from the left sidebar of the platform. if you want the full breakdown of this report, we covered it in the opening candle continuation strategy.
here's what the data shows on NQ over the last 6 months in the NY session:
- green opening candle: the NY session closed green 73.91% of the time (51 out of 69 days)
- red opening candle: the NY session closed red 71.67% of the time (43 out of 60 days)
this is more of a bias report. it doesn't give you a target, but it lines up really nicely with the initial balance.
at 10:30AM ET, when the IB finishes forming, you still don't know which side will break. but you know the IB low formed first, which already has the high breaking first 78.12% of the time. if price ended the hour near the high, that's 90%. and now the opening candle is green, which has closed the session green 73.91% of the time.
that's 2, if not 3, reports where the data favors the upside, and it's all based on what's actually happened in the market, not on what I think or what someone on X or in your Discord is saying.
anyone can look at this and check it: the low formed first, the high formed second, and price broke the high first on 50 out of 64 of those days over the last 6 months. we just make it easy to see. and realistically, you're not going to go through every day of data yourself to find out that the ending zone is a massive amplifier for this setup.
entries and stops
so the low formed first, the high formed second, the opening candle is green. the data favors longs.
people do this differently, but here are 2 common ways to enter using the retracement levels of the IB:
- enter at the 25% level of the IB and put your stop at the 50% level. that's a pretty tight 1:1 risk to reward.
- enter at the 50% level and put your stop at the IB low. you won't get filled as often, and your stop is a lot wider.
either way, you're expecting the high to break first. and once it does, the IB report shows price broke both sides on just 17.83% of NQ days (23 out of 129) over the last 6 months in the NY session.
you can build a fully mechanical process with this. "I enter at the 25% and my stop is at the 50%, every single day" can work for you.
other people add their own filters. if price is below the previous day's low, they don't take the trade. if VWAP is doing something, they don't take it. if there's a level of resistance right above, they don't take it. some people use order flow, and if there's a lot of selling pressure, they skip it.
that's where your own style comes in. in my opinion, mechanical setups are the best, but they don't work for everyone. you can use the retracement levels, or layer in VWAP, a volume profile, fair value gaps, order blocks, or whatever else you use.
targets: the IB by levels subreport
your first target is the IB high. on a long entered at the 50% level, that's the other half of the range.
then the question is how much to hold for continuation. that's what the IB by levels subreport answers.
if you're familiar with Fibonacci, this works the same way: each level is a percentage of the IB range, measured from the IB high (or below the IB low on a short).
- the 1.0 extension is 1 full IB range above the IB high
- the 0.5 extension is 50% of the IB range above the high
- the 0.1 extension is 10% of the IB range above the high
on September 22, the IB was 220.25 points, so the 0.1 extension sat about 22 points above the IB high. you can plot all of these on your chart in the IB indicator settings.
the by levels subreport tells you how often price reaches each of those levels. it can look at all days, which includes double break days and days that broke to the downside. for this setup, filter to breakout days only, since you're trading a break of the high and you know most days only break one side.
on NQ over the last 6 months in the NY session, on days that broke the IB high:
- price touched the 0.1 extension 91.94% of the time (57 out of 62 days)
- price touched the 0.2 extension 70.97% of the time (44 out of 62 days)
- price touched the 0.5 extension 43.55% of the time (27 out of 62 days)
could you take your whole position off at the IB high? sure. but when an A+ setup lines up like this, which isn't every day, this is where you can hold for more of the move. holding your winners to your targets is a big part of trading.
personally, I take the majority of my profits around the 0.2 extension, and then I'm in just runners. I'm never looking for a giant 200 or 300 point move on NQ. I'm looking for 40 to 80 points, maybe runners to 100.
the part I want you to take from this: don't take profits at random levels. "I'm going for a 2:1 because that's what people say" or "I'm targeting 100 points on NQ" is an arbitrary target, and arbitrary targets aren't consistent. with the by levels data, you know price has touched the 0.1 extension on 91.94% of those breakout days. so why not put a target there, and pick up the extra points? and it touched the 0.2 on 70.97% of them, so why not set your next target there too?
a couple of things before you trade this.
if there's a catalyst or a big headline, that's a different story. news can throw all of this out the window.
and A+ trades still fail. if you take this trade and the low breaks first, it was still an A+ trade. keep your size small enough that one losing trade doesn't hurt your account.
the full setup, recapped
here are the 4 reports that make up this setup:
- the initial balance (standard report): price broke at least one side of the IB on 93.8% of NQ days over the last 6 months in the NY session. once one side breaks, you look for continuation, not a break of the other side.
- the IB by rejection subreport: which side of the IB formed first. when the low formed first, the high broke first 78.12% of the time. add the ending zone, with price finishing the hour near the high, and that's 90%.
- the opening candle continuation: the open to the close of the first hour. a green opening candle has closed the NY session green 73.91% of the time.
- the IB by levels subreport: how far price continues after the break. on breakout days, the 0.1 extension was touched 91.94% of the time and the 0.2 was touched 70.97% of the time.
I know that's a lot of report names. if you need to, read through it again. once you start trading with data like this, it's really hard to go back to "there are 5 green candles, price will probably keep going up, I'll buy."
these numbers are NQ, NY session, last 6 months. before you trade this on ES, GC, or anything else, pull the reports up on your own ticker and session. the numbers will be different, and they change as the market environment changes. it takes some work to find the settings that fit how you trade.
all the indicators and levels from this setup get plotted on your chart automatically. you can pull up the IB by rejection subreport on NQ right now: IB by rejection on NQ. and if you want the IB drawn on your TradingView charts, here's how the initial balance indicator for TradingView works.
edgeful provides historical performance data to help traders make informed decisions. this does not constitute financial advice. past performance is not indicative of future results. all trading involves risk. always do your own analysis and manage your risk accordingly.
