how to build confidence in trading: the 4-pillar framework
welcome back to stay sharp.
last week, we talked about compounding and how 6% monthly returns actually double your account... but here's the thing — none of that matters if you don't have confidence in your trading system to begin with.
we've surveyed thousands of traders over the years, and one issue keeps coming up over and over again:
"I don't have confidence in my trading system."
but here's what we've learned after working with all these traders...
most people don't actually have a confidence problem. they have a clarity problem.
when your trading plan is vague — "I'll buy if it looks strong" or "I'll sell when momentum shifts" — you're setting yourself up to second-guess every decision.
but when your plan is built on specific, data-backed probabilities... confidence comes naturally.
today I'm going to show you exactly how to build that unshakeable confidence using 4 pillars — and I'll walk through a real example that ties it all together.
here's what we're covering:
table of contents
- the clarity problem disguised as a confidence problem
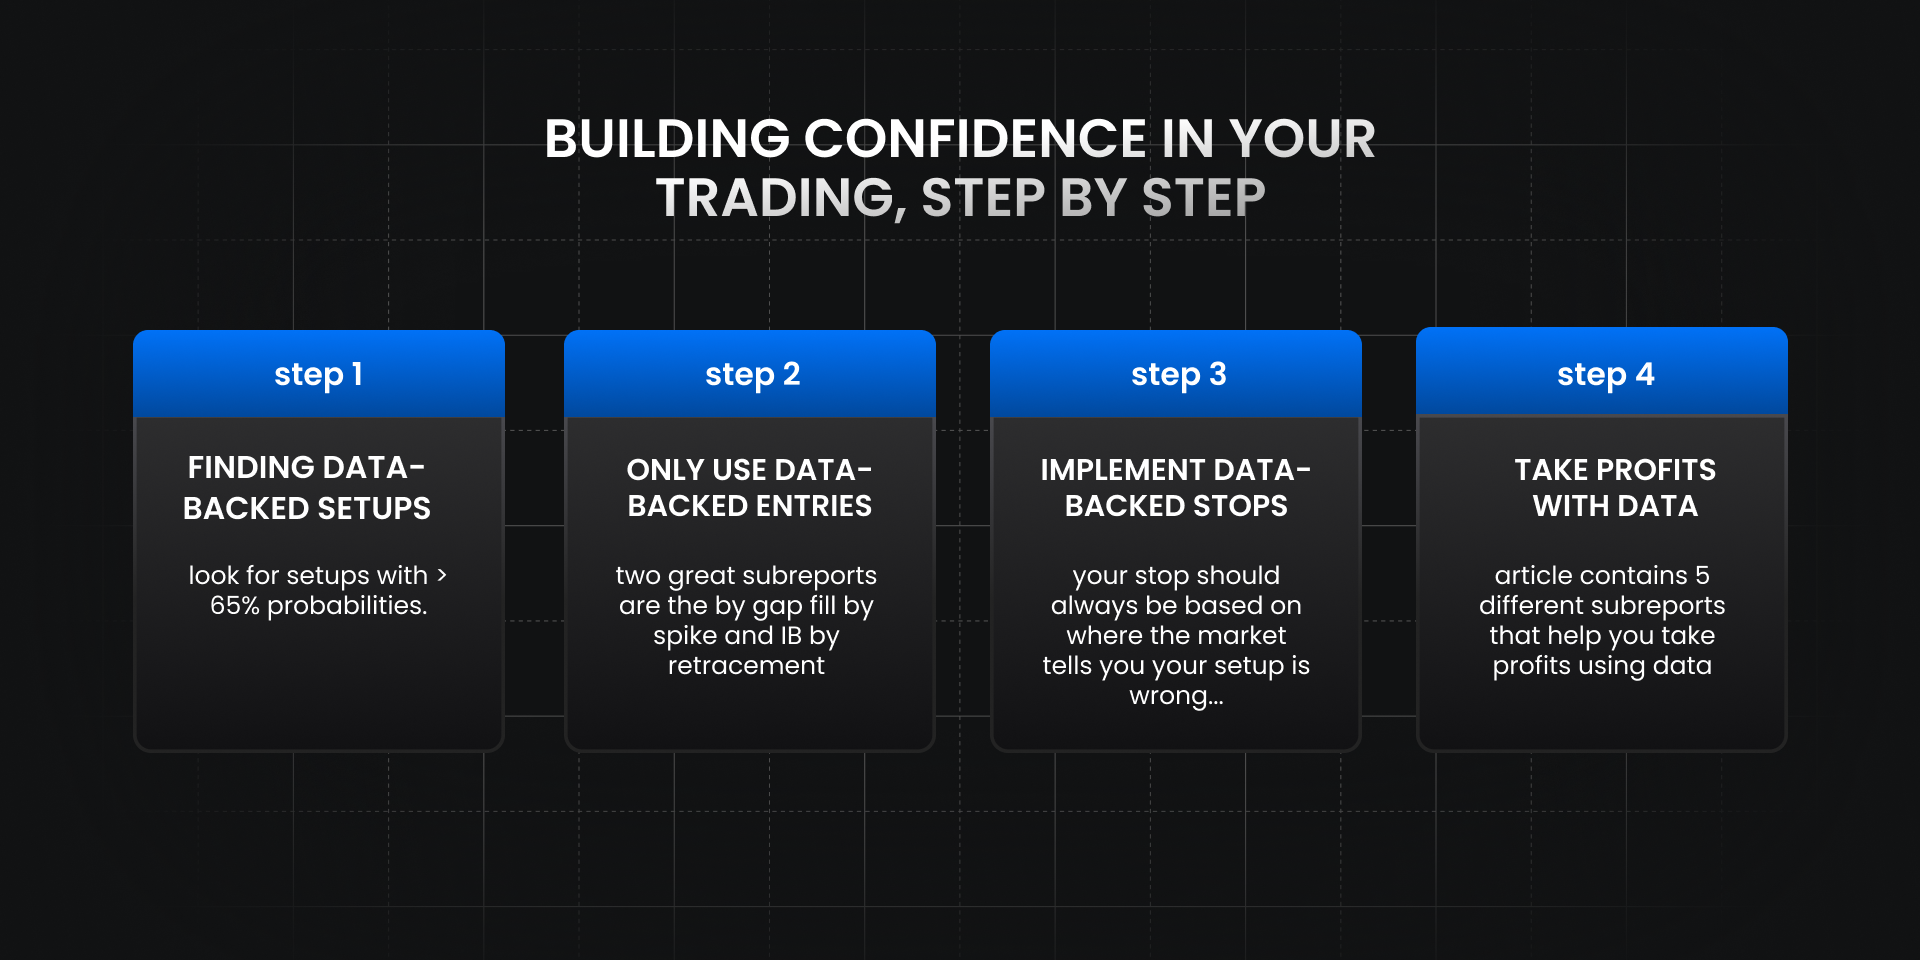
- the 4-pillar framework for building confidence
- pillar 1: finding setups with > 65% probabilities
- pillar 2: data-backed entries
- pillar 3: data-backed stop losses
- pillar 4: data-backed profit targets
- the natural evolution — automation
- frequently asked questions
- wrapping up
let's get into it...
the clarity problem disguised as a confidence problem
when traders tell me they lack confidence, I ask them one simple question:
"what's your edge on this trade?"
and 9 times out of 10, they can't give me a specific answer.
they'll say things like:
- "it looks like it's breaking out"
- "price is at support"
- "momentum is strong"
- "I just feel like it's gonna move"
none of these are edges. they're observations... or worse, gut feelings.
the real problem isn't that they don't trust themselves — it's that they don't have anything concrete to trust.
when you don't know the actual probability of your setup working, of course you're going to hesitate. of course you're going to exit early when it goes against you for a second. of course you're going to move your stops.
you know what happens then? you start trading based on how you feel in the moment instead of following a plan.
and that's how accounts get blown up.
the solution isn't more discipline. it's more clarity.
and clarity comes from data.
the 4-pillar framework for building confidence
here's how you build a trading plan that gives you actual confidence:
pillar 1: finding setups with >65% probabilities
this is where everything starts. if your setup doesn't have at least a 65% probability of working, you shouldn't be taking it.
period.
edgeful gives you dozens of reports that measure exactly how often specific patterns work. the key is knowing where to look:
- gap fill report: measures how often gaps get filled to the prior session close
- outside days report: shows reversal probabilities when price opens outside yesterday's range
- ICT midnight open retracement: tracks how often price retraces to the midnight open level
- initial balance report: measures breakout vs. reversal probabilities after the first hour
- ORB (opening range breakout): shows how often price breaks out of the opening range vs. stays inside
when you stack multiple reports that all show >65% probabilities in the same direction, your confidence goes through the roof.
why? because you're not guessing anymore — you're following what the data tells you is likely to happen.
this is the foundation. without data-backed edge, you have nothing to be confident about.
pillar 2: data-backed entries
knowing your setup has edge is one thing. knowing exactly where to enter is another.
this is where subreports like by spike and by retracement come in.
let's say you're trading a gap fill... you know the gap has a 68% chance of filling on YM. great. but when do you actually enter?
the gap fill by spike report tells you the average continuation before the reversal happens.
example: on YM, gaps up continue an average of ~$70 before reversing to fill the gap.
so instead of shorting right at the open and sitting through $70 of drawdown, you can wait for that spike to exhaust itself... then enter your short with a much better entry price and tighter stop.
same thing with the initial balance by retracement report.
when IB breaks out, the by retracement subreport shows you how deep price typically retraces before continuing. if you know price retraces to the 10% level 70% of the time, you can wait for that retracement instead of chasing the breakout.
data-backed entries = better risk/reward + more confidence in your execution.
you're not hoping to get filled at a good price. you're waiting for the exact conditions the data says are most favorable.
pillar 3: data-backed stop losses
we covered this in detail a few weeks ago, but here's the quick version:
most traders set stops based on how much they can afford to lose. "I can risk $200 on this trade."
that's backwards.
your stop should be based on where the market tells you your setup is wrong.
I wrote an entire stay sharp on this — you can read it here:
the key reports for stop placement:
- ORB by performance: shows how often price double breaks (hits both high and low)
- gap fill by spike: shows average continuation before reversals
- outside days by spike: shows how far price spikes before reversing
- IB by retracement: shows typical retracement levels before continuation
when you know these numbers, you're not guessing where to put your stop. you're using data to give your trade room to breathe while still protecting yourself if the setup fails.
and here's the psychological benefit: when you know your stop is placed based on data — not fear — you don't move it when price gets close.
you trust the plan.
pillar 4: data-backed profit targets
this is the final piece — and we covered this in detail recently too.
once you're in a trade with a high-probability setup, a great entry, and a smart stop... you need to know where to take profits.
again, most traders wing it. they exit when they "feel good" about the profit, or when fear kicks in.
but when you use data to set your targets, you trade without emotion.
we wrote a full stay sharp on this as well — check it out here:
the key reports for profit targets:
- by extension: shows how far breakouts typically extend beyond key levels
- gap fill report: tells you the prior session close is a high-probability target
- outside days report: gives you yesterday's high/low as reversal targets
- ICT midnight open: another strong target when price opens away from it
- previous day's range: shows how often price revisits prior highs/lows
when you combine multiple targets from different reports, you can scale out at each level... locking in profits along the way while letting runners work.
no more guessing "should I take profit here?" — the data tells you where the high-probability targets are.
the natural evolution — automation
now here's where it gets even better...
once you've built this kind of clarity into your trading system, the next step becomes obvious:
automate it.
why? because if you have a plan with specific probabilities, specific entry criteria, specific stops, and specific targets... there's no reason for you to sit at your screen manually executing it.
that's exactly what our algos do.
they take setups like the one we just walked through — the gap fill, the IB breakout, the ORB, the engulfing candles — and execute them perfectly every single time.
no hesitation. no second-guessing. no "I'll just wait one more candle to see what happens."
the algo follows the plan because the plan is built on data.
and when you remove the human emotion from execution, your results become consistent.
think about it: how many times have you had the perfect setup, knew exactly what to do, but hesitated for just a second... and missed the entry?
or how many times did you move your stop because "it just needs a little more room" — only to get stopped out right before price reversed in your favor?
the algos don't do that. they execute the plan exactly as you've designed it, every single time.
frequently asked questions
why do I lack confidence in my trading even though I have a strategy?
confidence comes from clarity, not just having a strategy. if your strategy relies on vague criteria like "buy when it looks strong" or "sell when momentum shifts," you'll always second-guess yourself because you don't have concrete probabilities to trust. the solution is building a plan with specific, data-backed entry criteria, stops, and targets that give you something concrete to follow.
what percentage probability should I look for in a trading setup?
aim for setups with at least 65% probability of working. when you stack multiple reports that all show 65%+ probabilities in the same direction, your confidence increases exponentially. for example, if three different reports (outside days, gap fill, ICT midnight open) all align at 67%+ probabilities, you're not guessing anymore — you're following what the data shows is highly likely to happen.
how do I know if I actually have an edge in my trading?
ask yourself: "what's the specific probability of this setup working?" if you can't answer with actual data — like "gaps up on YM fill 68% of the time over the last 3 months" — then you don't have a measurable edge. edge isn't a feeling or observation. it's a statistical advantage backed by historical data that shows your setup works more often than it fails.
should I use data-backed stops even if they're wider than I'm comfortable with?
yes. your stop should be based on where the market tells you the setup is wrong, not on how much you can afford to lose. if the gap fill by spike report shows YM continues an average of $70 before reversing, and you set your stop at $50 because "that's all I can risk," you're almost guaranteeing you'll get stopped out before the trade has a chance to work. proper position sizing solves this — trade smaller size with the correct stop placement.
when should I consider automating my trading strategy?
once you've built clarity into your system — meaning you have specific probabilities for your setups, precise entry criteria from by spike/retracement data, market-based stops, and data-backed targets — automation becomes the natural next step. if you have a plan with concrete rules that doesn't require subjective judgment, there's no reason to execute it manually and risk letting emotions interfere.
how long does it take to build confidence using this framework?
confidence builds immediately once you start trading with data instead of gut feel. the first time you take a trade where three reports align at 70%+ probabilities, you'll notice you don't hesitate the same way. however, sustained confidence comes from consistently following the data over multiple trades and seeing the probabilities play out. most traders report feeling significantly more confident within the first month of systematic, data-backed trading.
wrapping up
let's recap what we covered today:
most traders don't have a confidence problem — they have a clarity problem. when your trading plan is vague, you'll always second-guess yourself.
the solution is building confidence through the 4-pillar framework:
- finding setups with >65% probabilities — stack multiple reports in the same direction
- using data-backed entries — by spike and by retracement reports tell you when to enter
- setting data-backed stop losses — let the market tell you when the setup is wrong
- targeting data-backed profit levels — scale out at high-probability targets
when you combine multiple reports that all align in the same direction — like the ultimate reversal setup — your confidence goes through the roof because the data is crystal clear.
and once you have that clarity, automation becomes the natural next step.
remember — the traders who end up being profitable aren't the ones with the best gut instincts. they're the ones who built systems based on data and had the discipline to follow them.
stay sharp,
André
edgeful CEO
p.s. — if you want to dive deeper into how to set data-backed stops and targets, check out the full blog posts we linked above. we go way deeper into the specific reports and subreports you should be using daily.