candlestick patterns for day trading: the complete guide
every trader learns candlestick patterns at some point. hammers, dojis, engulfing bars — they're in every trading book and YouTube video.
but here's what most traders get wrong:
a hammer on a daily chart means something different than a hammer on a 5-minute chart. a head and shoulders pattern that takes weeks to form isn't useful when you're closing positions before 4 PM.
candlestick patterns for day trading need to be fast, actionable, and reliable. you don't have time to wait for confirmation over multiple sessions.
this guide covers the candlestick patterns for day trading that actually matter — single candle signals, two-candle setups, and chart patterns you can spot and trade within a single session.
table of contents
- what are candlestick patterns?
- single candle patterns
- two-candle patterns
- bullish chart patterns
- bearish chart patterns
- reversal vs continuation patterns
- which candlestick patterns work best for day trading
- frequently asked questions
- key takeaways
what are candlestick patterns?
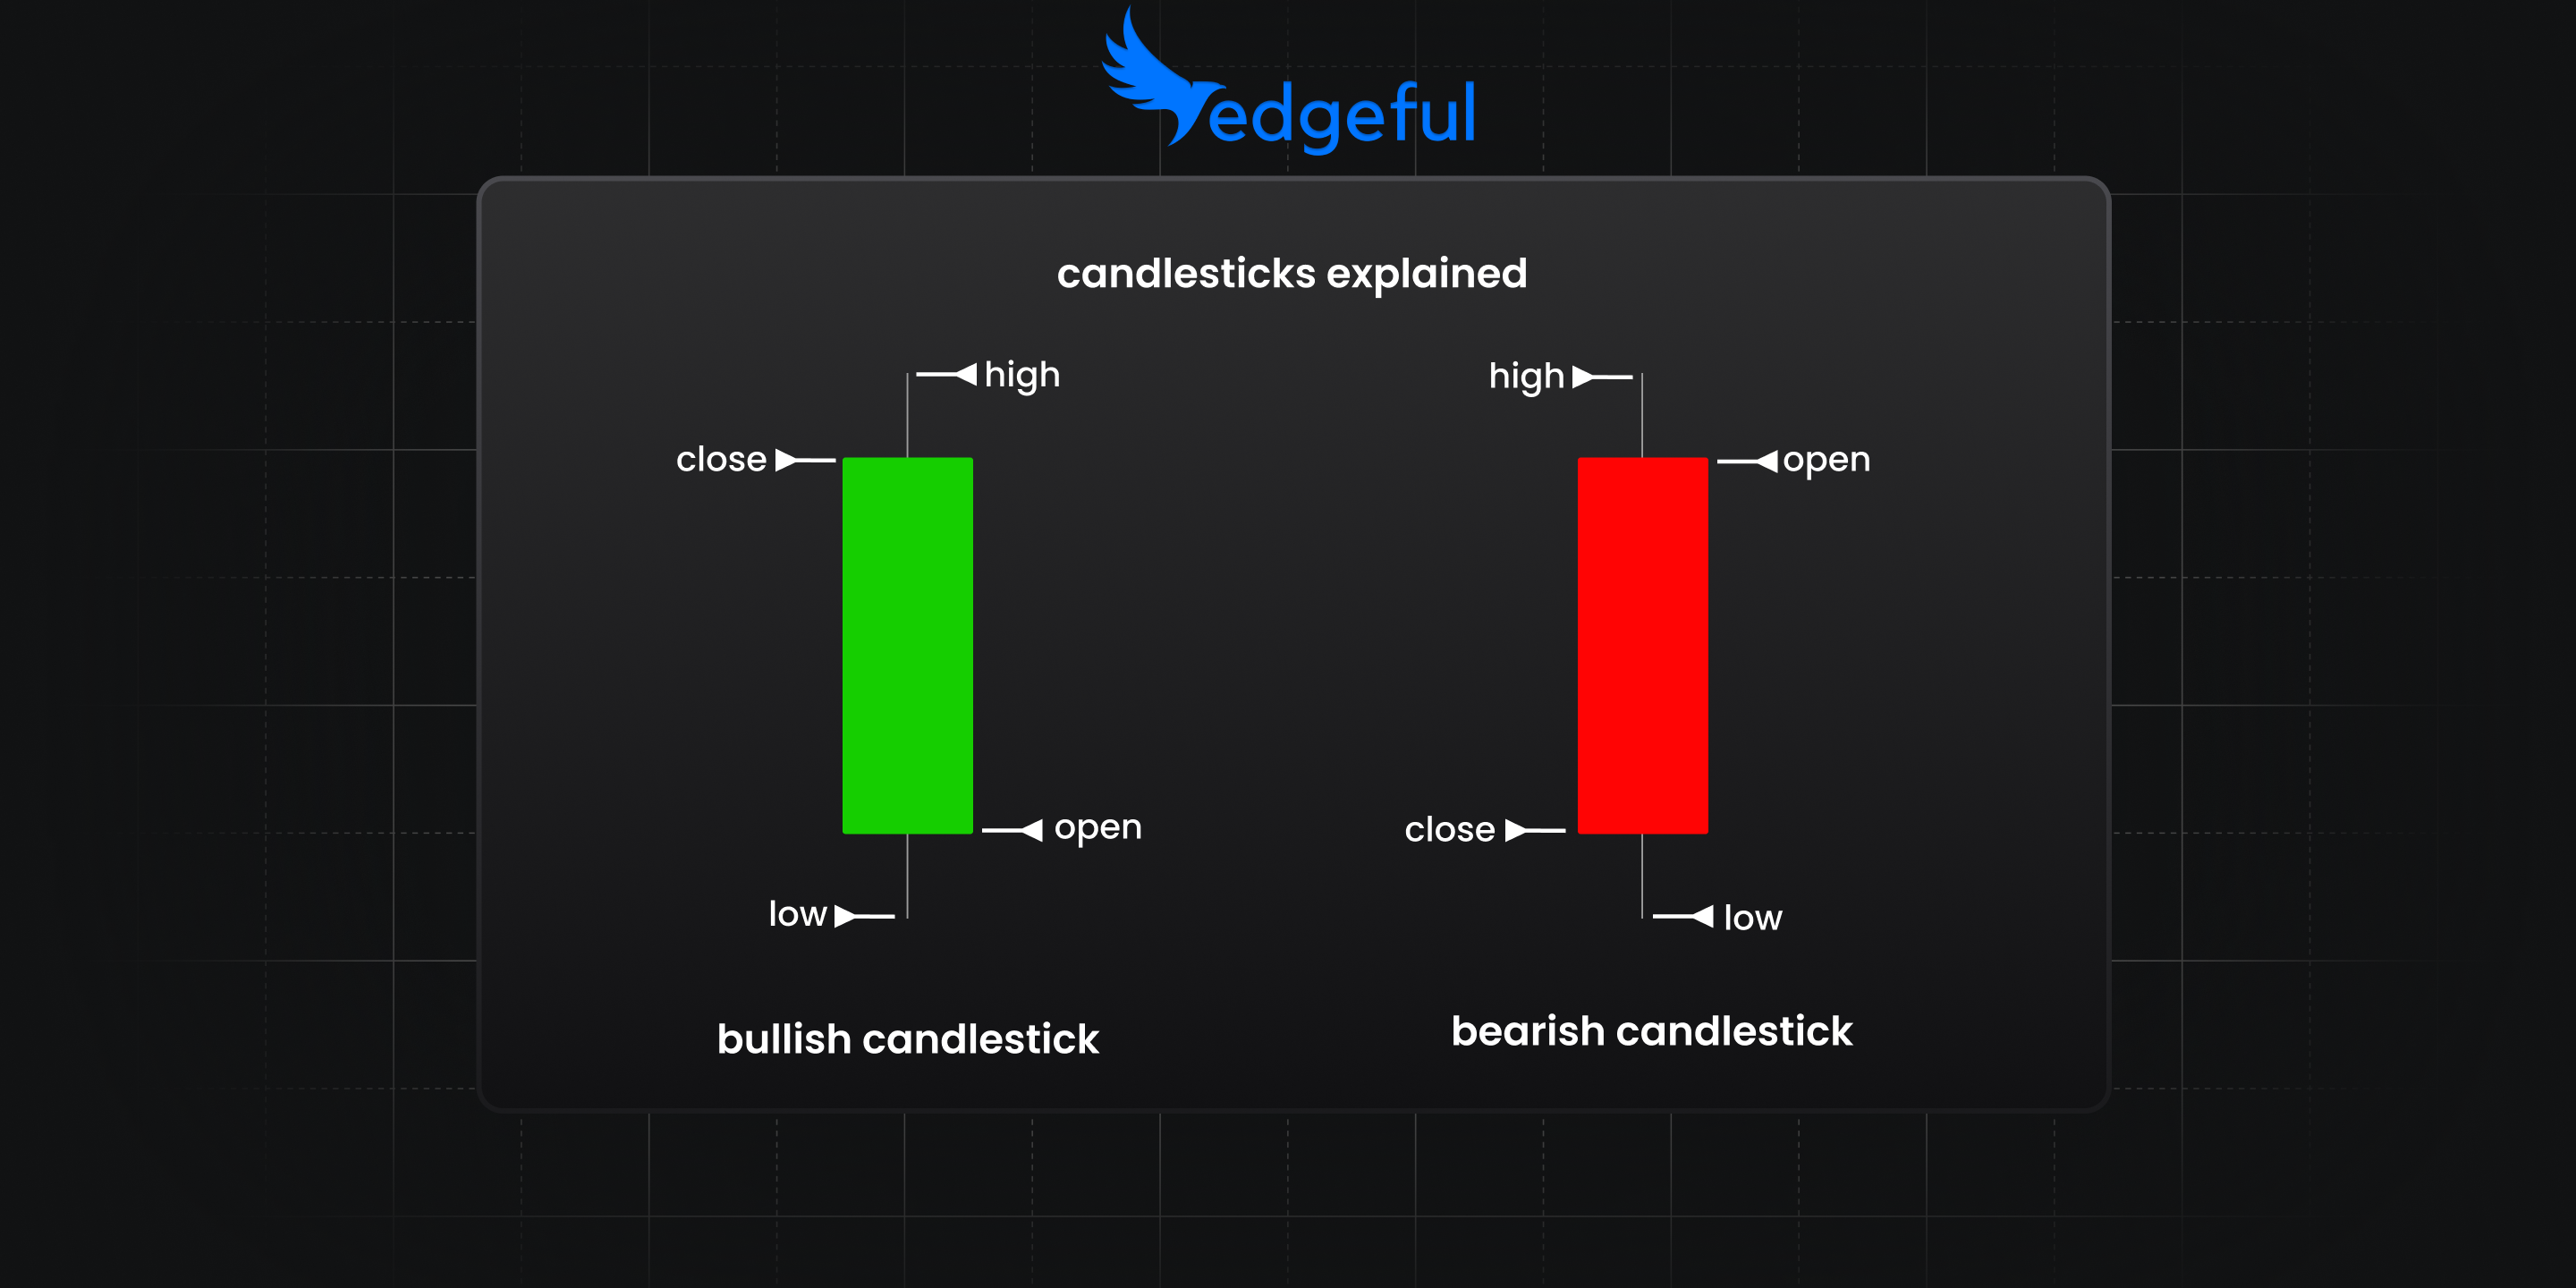
candlestick patterns are visual formations on price charts that suggest potential future price movement. they're built from one or more candlesticks and reflect the battle between buyers and sellers.
each candlestick shows four data points:
- open — where price started
- close — where price ended
- high — the highest price reached
- low — the lowest price reached
the body (filled or hollow portion) shows the range between open and close. the wicks (lines above and below) show the high and low.
when you're looking at candlestick patterns for day trading, you're reading the story of who's winning — buyers or sellers — and whether that's likely to continue or reverse.
single candle patterns
these candlestick patterns for day trading form on a single bar and give you the fastest signals. they're ideal for intraday trading because you don't need to wait for multiple candles to confirm.
hammer
what it looks like: small body at the top, long lower wick (at least 2x the body), little to no upper wick.
what it means: price dropped significantly during the period but buyers stepped in and pushed it back up. the rejection of lower prices suggests bulls are taking control.
how to trade it: look for hammers at support levels, previous day's low, or after a downtrend. the long lower wick shows buyers defending that level.
bullish or bearish: bullish reversal signal.
shooting star
what it looks like: small body at the bottom, long upper wick (at least 2x the body), little to no lower wick. it's the opposite of a hammer.
what it means: price rallied during the period but sellers stepped in and pushed it back down. the rejection of higher prices suggests bears are taking control.
how to trade it: look for shooting stars at resistance levels, previous day's high, or after an uptrend. the long upper wick shows sellers defending that level.
bullish or bearish: bearish reversal signal.
doji
what it looks like: tiny body (open and close nearly equal), with wicks on both sides. the body is so small it looks like a cross or plus sign.
what it means: neither buyers nor sellers won the period. it signals indecision and potential reversal — especially after a strong move in one direction.
how to trade it: dojis alone aren't strong signals. wait for the next candle to confirm direction. a doji after an uptrend followed by a bearish candle = potential reversal. dojis work best as candlestick patterns for day trading when they appear at key levels.
bullish or bearish: neutral — depends on context and confirmation.
two-candle patterns
these candlestick patterns for day trading require two bars to form. they're slightly slower than single-candle signals but often more reliable.
engulfing candles
what it looks like: a two-candle pattern where the second candle's body completely "engulfs" (covers) the first candle's body.
- bullish engulfing: small bearish candle followed by a larger bullish candle that engulfs it. signals buyers overwhelming sellers.
- bearish engulfing: small bullish candle followed by a larger bearish candle that engulfs it. signals sellers overwhelming buyers.
how to trade it: engulfing patterns work best at support/resistance levels or after extended moves. the engulfing candle shows a shift in control.
edgeful tracks engulfing patterns with specific data on win rates and optimal profit targets. for a deep dive on trading this setup with probabilities, check out our engulfing bars trading strategy.
bullish or bearish: bullish engulfing = bullish reversal, bearish engulfing = bearish reversal.
inside bars
what it looks like: a candle whose entire range (high to low) fits inside the previous candle's range. the second candle is "inside" the first.
what it means: consolidation. the market is pausing, coiling up energy before the next move. inside bars represent decreasing volatility before an expansion.
how to trade it: wait for the breakout. when price breaks above the inside bar's high = bullish. when price breaks below the inside bar's low = bearish. inside bars are excellent candlestick patterns for day trading because they give you a defined range to trade against.
edgeful has detailed data on inside bar breakouts, including probability by direction and instrument. for the full breakdown, see our inside bar pattern day trading strategy.
bullish or bearish: neutral until breakout direction is confirmed.
bullish chart patterns
these larger candlestick patterns for day trading take multiple candles to form but can develop within a single session on lower timeframes.
bull and bear flag
what it looks like: a strong upward move (the "pole") followed by a downward-sloping consolidation (the "flag"). the flag looks like a small channel moving against the prior trend. the same thing but inverse happens for bear flags.
what it means: the uptrend is pausing, not reversing. buyers are resting before the next push higher. the consolidation is typically on lower volume. for bear flags — the downtrend is pausing, not reversing. look for a couple of days rest (rally) and then a continued move downwards.
how to trade it: enter when price breaks above the flag's upper trendline. target is typically the length of the pole added to the breakout point. stop goes below the flag's low.
why it works for day trading: bull/bear flags can form in 15-30 minutes on a 1-minute or 5-minute chart. they're common after opening range breakouts/breakdowns.
pennant
what it looks like: similar to a flag but the consolidation forms a small symmetrical triangle instead of a channel. converging trendlines create a point.
what it means: same as a flag — a pause in the trend before continuation. the converging lines show decreasing volatility before a breakout.
how to trade it: enter on a break of the pennant in the direction of the prior trend. for a bullish pennant, buy the breakout above. measure the pole for your target.
why it works for day trading: pennants often form quickly after momentum moves, making them reliable candlestick patterns for day trading during volatile sessions.
ascending triangle
what it looks like: flat resistance level on top with rising support (higher lows) underneath. price squeezes into the resistance.
what it means: buyers are getting more aggressive, willing to buy at higher and higher prices. the flat resistance shows supply, but it's being absorbed.
how to trade it: enter on a break above the flat resistance. the higher lows show demand building. stop goes below the most recent higher low. target is the height of the triangle added to the breakout.
why it works for day trading: ascending triangles can form around key levels like previous day's high or initial balance high. they're tradeable candlestick patterns for day trading when they appear near significant levels.
bearish chart patterns
these candlestick patterns for day trading signal potential downside. they're the inverse of bullish patterns.
head and shoulders
what it looks like: three peaks — the middle peak (head) is highest, the two side peaks (shoulders) are lower and roughly equal. a "neckline" connects the lows between the peaks.
what it means: a classic reversal pattern. the market tried to make a higher high (the head) but failed, then couldn't even match the previous high (right shoulder). buyers are exhausted.
how to trade it: enter on a break below the neckline. target is the distance from the head to the neckline, projected down from the breakout. stop goes above the right shoulder.
note for day trading: head and shoulders patterns typically take longer to form. on 1-minute or 5-minute charts, they can develop within a session, but they're more common on 15-minute or higher timeframes. still useful candlestick patterns for day trading when you spot them forming.
double top
what it looks like: two peaks at roughly the same price level with a valley between them. price hits resistance, pulls back, tests it again, and fails.
what it means: strong resistance. buyers tried twice and couldn't break through. the second failure often leads to a reversal.
why it works for day trading: double tops frequently form at previous day's high, initial balance high, or round numbers.
reversal vs continuation patterns
candlestick patterns for day trading fall into two categories:
reversal patterns
signal a potential change in direction.
examples: hammer, shooting star, engulfing bars, head and shoulders, double tops/bottoms
when they work best: at support/resistance levels, after extended moves, at key times (open, close, session transitions)
the key: reversal patterns need context. a hammer in the middle of nowhere is meaningless. a hammer at the previous day's low after a morning selloff? that's tradeable.
continuation patterns
signal the current trend is likely to resume.
examples: flags, pennants, triangles, inside bars (when they break with the trend)
when they work best: after strong momentum moves, during trending sessions, when volume confirms the breakout
the key: continuation patterns work because trends tend to persist. a flag after a breakout is the market catching its breath, not reversing.
knowing which type you're looking at changes everything. don't trade a flag like it's a reversal pattern.
which candlestick patterns work best for day trading
not all patterns are equal for intraday trading. here's what matters when selecting candlestick patterns for day trading:
speed matters
patterns that form quickly are more useful. single-candle patterns (hammers, shooting stars, dojis) and two-candle patterns (engulfing, inside bars) give faster signals than patterns that take 20+ candles to develop.
context is everything
candlestick patterns for day trading work best at key levels:
- previous day's high/low
- opening range high and low
- initial balance high/low
- round numbers
- midnight open
- fair value gap mitigation areas
a pattern at a meaningful level beats a "perfect" pattern in the middle of nowhere.
volume confirms
the best patterns come with volume confirmation. an engulfing bar on high volume shows conviction. the same pattern on low volume is suspect.
frequently asked questions
what are the most reliable candlestick patterns for day trading?
engulfing bars, inside bars, and flags are among the most reliable candlestick patterns for day trading because they have clear entry points, defined risk levels, and can be backtested. single-candle patterns like hammers and shooting stars work well when they appear at key support/resistance levels.
how many candlestick patterns should I learn?
start with 4-5 patterns and master them. most profitable day traders use a handful of candlestick patterns for day trading that they know deeply rather than recognizing 50 patterns poorly. focus on patterns that fit your strategy and have measurable edge.
do candlestick patterns work on all timeframes?
yes, but reliability varies. candlestick patterns for day trading tend to work better on slightly higher intraday timeframes (5-minute, 15-minute) than on 1-minute charts where noise is higher. the same patterns work on daily and weekly charts but take longer to develop.
should I trade candlestick patterns alone or with other indicators?
candlestick patterns for day trading work best with context — key levels, volume, and time of day. you don't necessarily need indicators, but combining patterns with support/resistance and volume analysis improves reliability significantly.
what's the biggest mistake traders make with candlestick patterns?
trading patterns in isolation without context. a hammer isn't automatically bullish — it matters WHERE it forms. candlestick patterns for day trading need to appear at meaningful levels with supporting evidence, not just anywhere on the chart.
key takeaways
- candlestick patterns for day trading need to be fast and actionable — single and two-candle patterns are ideal
- single candle patterns: hammer (bullish), shooting star (bearish), doji (indecision), marubozu (conviction)
- two-candle patterns: engulfing bars (reversal) and inside bars (breakout setups)
- bullish chart patterns: bull flags, pennants, ascending triangles
- bearish chart patterns: bear flags, descending triangles, head and shoulders, double tops
- reversal patterns work at key levels after extended moves
- continuation patterns work during trends — flags and pennants show pauses, not reversals
- context matters more than the pattern itself — trade candlestick patterns for day trading at meaningful levels
- the best patterns have measurable data — know your win rates before trading