fair value gap: how to trade FVGs with 60%+ win rates using real market data
here's something that'll blow your mind — most traders have fair value gaps completely backwards.
they think every gap has to fill. they chase price into these zones expecting reversals. they blow up their accounts wondering why the "setup" didn't work.
but what if i told you that fair value gaps actually stay unfilled over 60% of the time? and that trading them as support and resistance levels — not fill targets — could transform your results?
a fair value gap (FVG) is a three-candle pattern that forms when price moves aggressively, leaving an unfilled area between the first candle's high/low and the third candle's low/high. think of it as the market moving so fast it literally skips price levels, creating an imbalance.
today, i'm going to show you exactly how to identify and trade fair value gaps using actual market data — not theories or backtests from 2010. we've analyzed thousands of FVGs on YM futures, and the statistics will change how you see these patterns forever.
table of contents
- what is a fair value gap?
- types of fair value gaps
- fair value gap vs other gap types
- why 30-minute FVGs give the cleanest signals
- the data: how often do fair value gaps get filled?
- "by wick" vs "by close" - the critical difference
- how to trade fair value gaps step by step
- fair value gap trading strategies
- combining FVGs with other indicators
- common mistakes when trading fair value gaps
- tools for identifying fair value gaps
- frequently asked questions
- your next steps
what is a fair value gap?
let's start with the basics because half the confusion around fair value gaps comes from overcomplicated explanations.
a fair value gap is simply a price zone where the market moved so aggressively that it left behind an area with little to no trading activity. it's a three-candle pattern where:
- candle 1: sets up the move
- candle 2: creates the aggressive push (large body)
- candle 3: confirms the gap
the actual gap is the space between candle 1's high and candle 3's low (for bullish) or candle 1's low and candle 3's high (for bearish).
here's the key — fair value gaps represent imbalances between buyers and sellers. when one side takes control aggressively, they push price through levels without much opposition, leaving these "gaps" behind.
now, some traders (especially those following ICT concepts) treat these gaps as magnets that price must return to fill. but as you'll see from our data, that's not always the case. in fact, it's usually wrong.
the difference between fair value gaps and regular overnight gaps? timing and formation. regular gaps happen between sessions when the market opens away from the previous close. fair value gaps form intraday as price action patterns — completely different animals.
types of fair value gaps
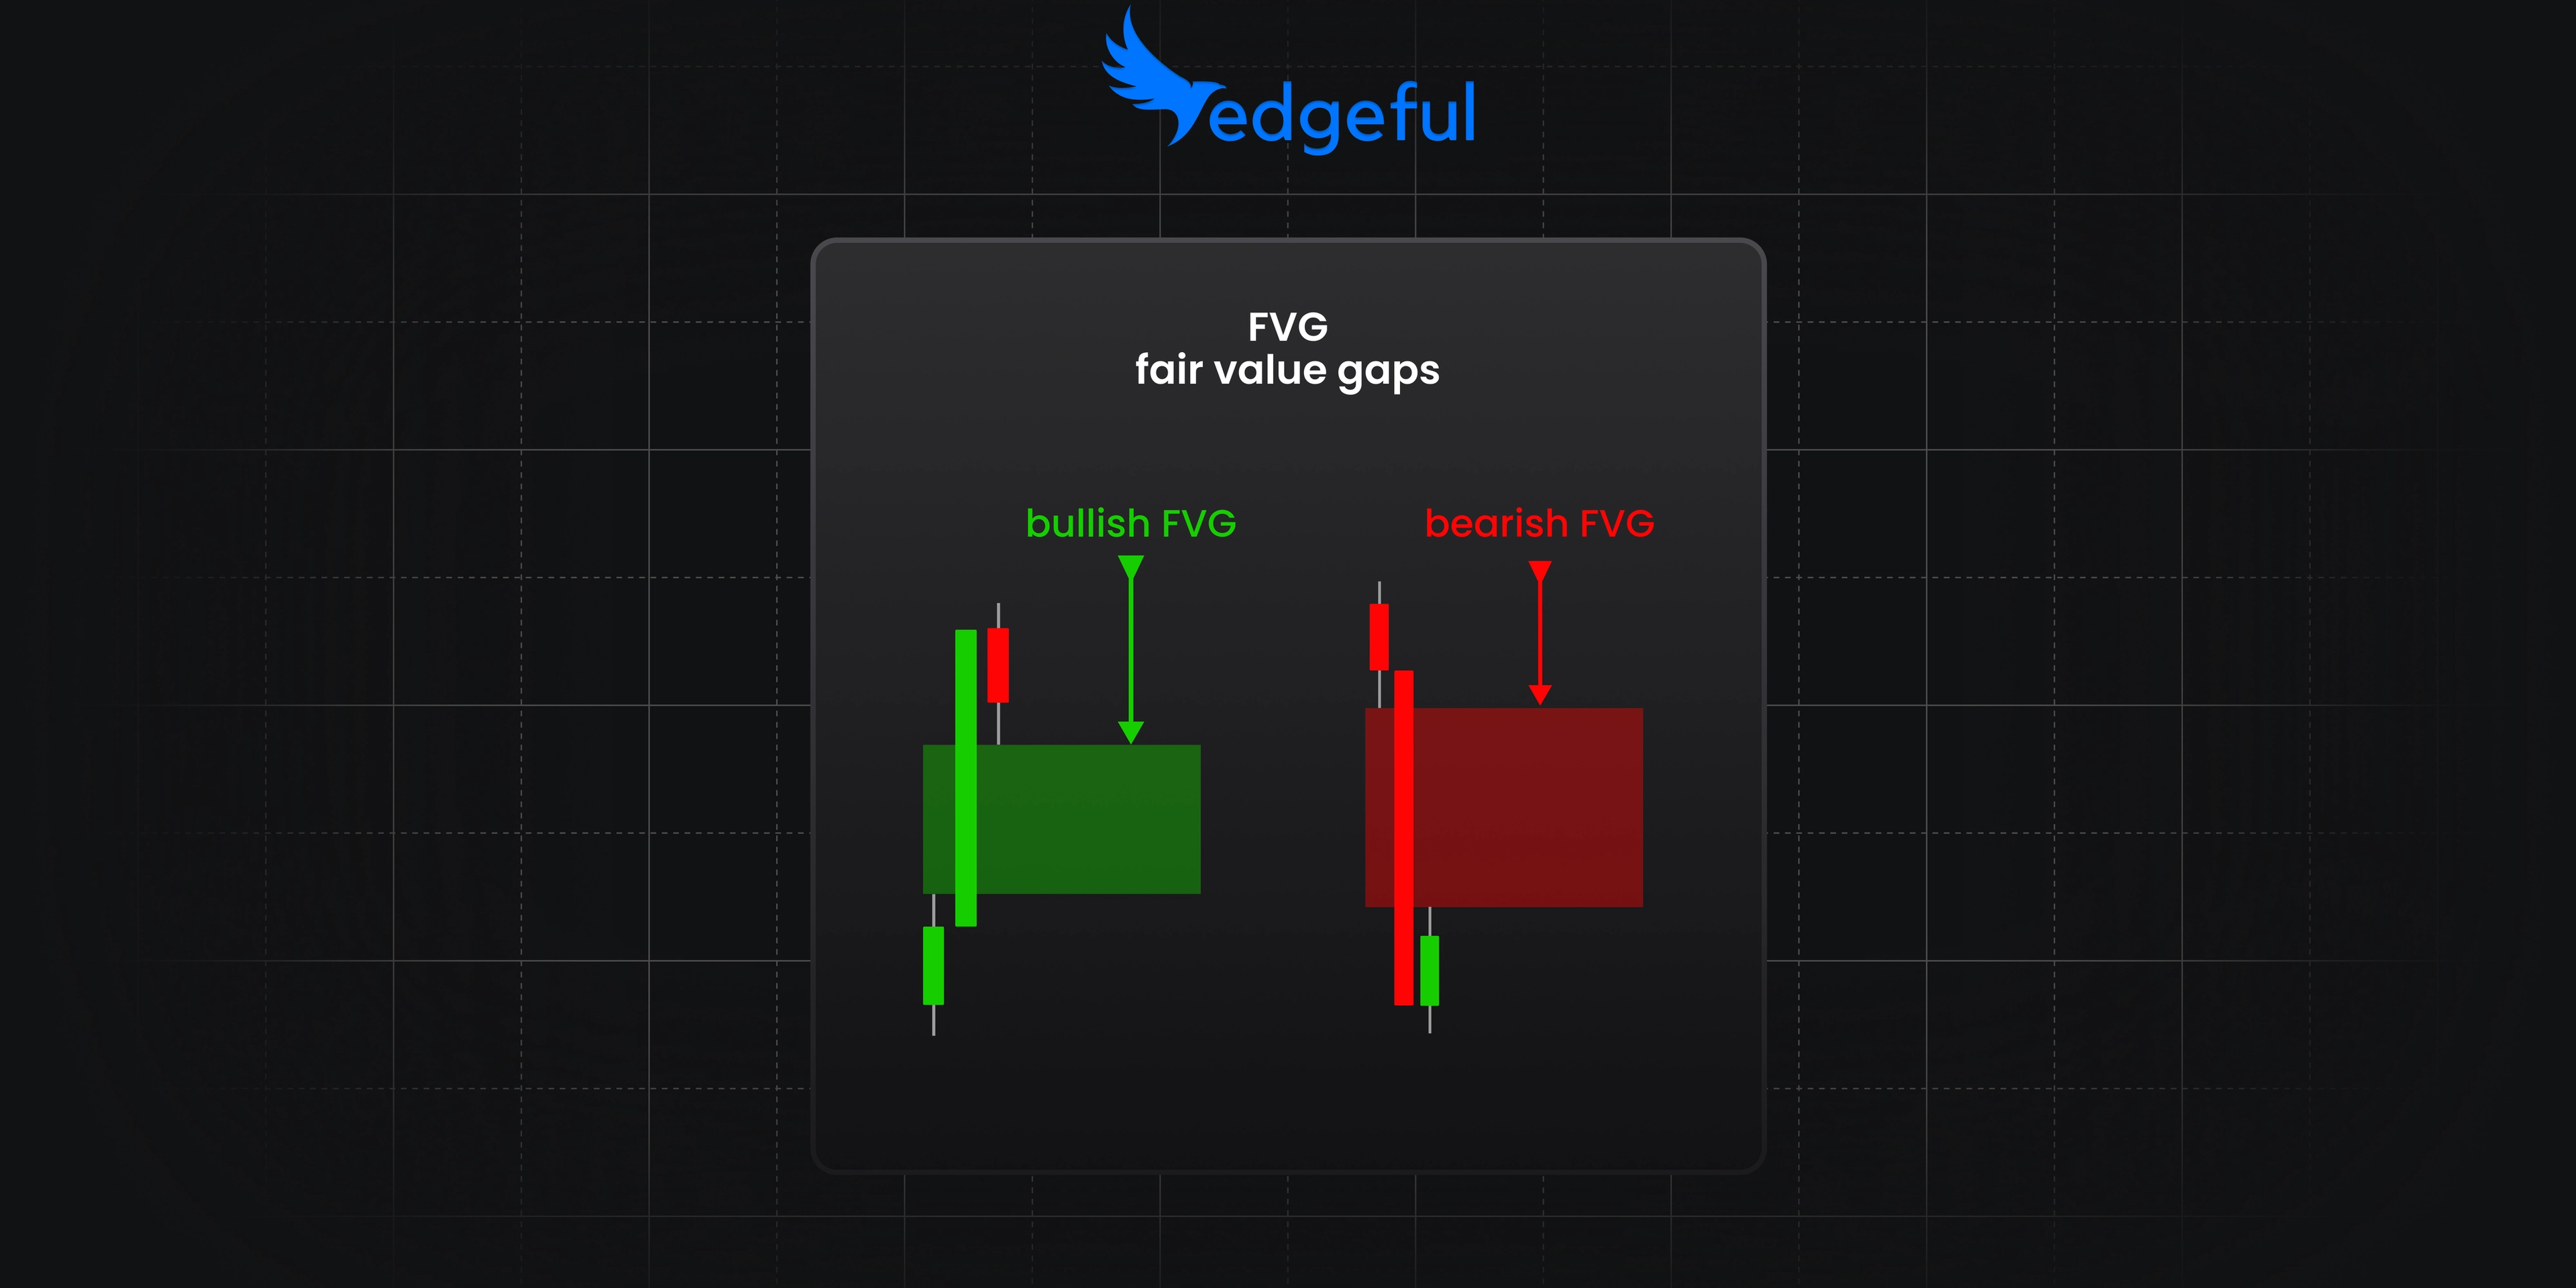
bullish fair value gap
a bullish fair value gap forms during aggressive buying when:
- the low of the third candle is higher than the high of the first candle
- the middle candle shows strong bullish momentum
- no overlap exists between candles 1 and 3
these typically appear in uptrends or after breakouts from consolidation. the gap acts as a potential support zone if price returns to test it.
bearish fair value gap
a bearish fair value gap forms during aggressive selling when:
- the high of the third candle is lower than the low of the first candle
- the middle candle shows strong bearish momentum
- no overlap exists between candles 1 and 3
you'll see these in downtrends or after breakdown moves. the gap becomes a potential resistance zone for any rallies.
inverse fair value gap (brief mention)
some traders also watch for "inverse" fair value gaps — these are regular FVGs that get violated and then flip to work in the opposite direction. basically, a failed support becomes resistance or vice versa.
fair value gap vs other gap types
understanding the difference between fair value gaps and other gap types is crucial for proper analysis:
gap up/gap down
these are the classic overnight gaps where the market opens higher or lower than the previous close. we have extensive data on these in our gap fill trading guide.
key difference: gap up/down are session-to-session events, while FVGs happen within the trading day.
exhaustion gaps
these occur at the end of trends when the final push leaves a gap before reversing. unlike fair value gaps which can appear anywhere, exhaustion gaps specifically mark potential trend termination.
runaway gaps
also called "measuring gaps," these appear in the middle of strong trends. they're similar to FVGs in that they show momentum, but the formation pattern is different.
why 30-minute fair value gaps give the cleanest signals
you can identify fair value gaps on any timeframe — 1 minute, 5 minute, 15 minute, hourly, whatever.
but after analyzing thousands of these patterns, here's what i've discovered:
30-minute FVGs are the sweet spot.
here's why:
on shorter timeframes like 5 minutes, you'll see dozens of fair value gaps throughout the day. it becomes noise. you can't possibly trade them all, and most are meaningless micro-imbalances that get filled immediately.
on longer timeframes like 1 hour, you might only see 1-2 per session. not enough opportunity, and they often form at levels that are too far from current price to trade effectively.
but 30-minute charts? they give you:
- significance: large enough to represent real institutional movement
- frequency: typically 3-5 quality setups per session
- tradability: gaps form at accessible levels with reasonable stop distances
think about it — a 30-minute candle represents substantial trading activity. when you get an imbalance over that timeframe, it means something. it's not just noise from a single large order, but sustained pressure from one side of the market.
the edgeful fair value gap report: real data that changes everything
now for the part that separates edgeful from everyone else — actual data.
our fair value gap report tracks one simple question: how often does price return to mitigate FVGs within the same NY session (9:30am-4:00pm ET)?
here's what the data shows on YM over the last 6 months using 30-minute fair value gaps:
the shocking results:
- bullish FVGs: 60.71% go unmitigated within the same session
- bearish FVGs: 63.2% go unmitigated within the same session
read that again. over 60% of fair value gaps do NOT get filled during the same trading session.
this completely flips the common wisdom that "all gaps must fill." that might be true over infinite time, but for day traders? these gaps are more likely to hold than break.
what this means for your trading:
- fair value gaps work better as support/resistance than as fill targets
- betting on gaps to fill is actually the lower probability play
- the stronger move is often continuation in the gap direction
"by wick" vs "by close" — the difference that matters
here's where things get really interesting. there are two ways to measure whether a fair value gap has been "mitigated":
by wick mitigation: price touches the gap area with any part of a candle (including wicks)
by close mitigation: price must actually close within or beyond the gap area
the statistics change dramatically based on which method you use:
by wick stats (YM, 6 months):
- bullish FVGs: 52.38% unmitigated
- bearish FVGs: 50.4% unmitigated
by close stats (YM, 6 months):
- bullish FVGs: 60.71% unmitigated
- bearish FVGs: 63.2% unmitigated
see the difference? the "by close" method gives you much stronger probabilities.
why? because wicks represent rejection. when price wicks into a fair value gap but can't close there, it's actually confirming the zone as support or resistance. the gap is doing its job.
this is why i always use "by close" criteria for my analysis. it gives you cleaner signals and better probability assessment.
how to trade fair value gaps step by step
now that you understand what fair value gaps are and the probabilities behind them, let's get into the execution.
step 1: identify the fair value gap
start with a 30-minute chart of your preferred futures contract (I use YM, but this works on ES, NQ, etc.). look for the three-candle pattern:
- large middle candle showing directional conviction
- gap between first and third candle wicks
- clean space with no overlap
mark the gap zone clearly on your chart. this is your decision area.
step 2: wait for price to return
patience is everything here. don't chase price away from the gap. since we know 60%+ of gaps hold as support/resistance, wait for price to come back and test the zone.
this might happen in 30 minutes or 3 hours. doesn't matter. the probability doesn't change based on how long you wait.
step 3: look for confirmation
when price returns to the fair value gap, watch for:
- rejection candles: pins, hammers, shooting stars
- volume spike: shows active defense of the level
- momentum shift: price slowing as it enters the gap
you want evidence that the gap is holding before you enter.
step 4: enter your position
for bullish fair value gaps (support):
- enter long when you see rejection from the gap zone
- more aggressive: enter as price touches the top of the gap
- more conservative: wait for a close above the gap after testing
for bearish fair value gaps (resistance):
- enter short when you see rejection from the gap zone
- more aggressive: enter as price touches the bottom of the gap
- more conservative: wait for a close below the gap after testing
step 5: manage your risk
stop loss: place it just beyond the fair value gap
- for longs: below the bottom of the bullish FVG
- for shorts: above the top of the bearish FVG
targets: use market structure
- previous day's high/low
- initial balance high/low
- significant swing points
- measured moves equal to the gap size
remember — you're trading probabilities. even with 63% odds, you'll have losers. size accordingly.
fair value gap trading strategies
strategy 1: fair value gap as support/resistance
this is the bread and butter approach based on our data showing 60%+ of gaps hold.
setup:
- identify FVG on 30-minute chart
- wait for price to return to gap zone
- enter on rejection with stop beyond gap
- target previous structure levels
best market conditions: trending markets where gaps form in the direction of trend
strategy 2: combining with session bias
fair value gaps work even better when aligned with other edgeful reports.
FVG + opening candle continuation: if the first hour closes bullish and you see bullish FVGs forming, you have multiple reasons to be long
FVG + initial balance breaks: gaps that form near ib edges often mark the beginning of range expansion
FVG + previous day's range: when yesterday's high breaks and creates a bullish FVG, that gap becomes a key support level
the more confluence, the higher your confidence should be.
strategy 3: multiple timeframe approach
use multiple timeframes to fine-tune your entries:
- identify the FVG on 30-minute chart
- confirm the level is respected on 15-minute
- enter using 5-minute price action
this gives you the best of both worlds — significant levels with precise entries.
combining FVGs with other indicators
fair value gaps are powerful alone, but they're even better with confirmation from other tools:
volume analysis
when price returns to an FVG, watch for volume. high volume rejection confirms the level is defended. low volume suggests the gap might break.
momentum indicators
rsi divergence at an FVG adds conviction. if price makes a new high but rsi doesn't while testing a bearish FVG, that's a strong short signal.
market internals
if $tick is extremely negative while price rallies into a bearish FVG, the rejection is more likely. use market breadth to confirm directional bias.
other edgeful reports
this is where our platform shines. combine FVGs with:
- opening range breakouts
- initial balance levels
- previous day's range
- gap fill probabilities
when multiple reports align, your edge multiplies.
common mistakes when trading fair value gaps
1. trading every FVG you see
just because you can identify a fair value gap doesn't mean you should trade it. focus on:
- gaps in the direction of the trend
- gaps at significant levels
- gaps with other confluence
quality over quantity always wins.
2. ignoring market context
a fair value gap in a choppy, ranging market behaves differently than one in a trending market. always consider the bigger picture before taking the trade.
3. using the wrong timeframe
1-minute FVGs are noise. daily FVGs are too slow for day trading. stick to 15-30 minute timeframes for the best balance.
4. not waiting for confirmation
the biggest mistake i see? traders market-buying the second price touches an FVG. wait for some sign of rejection. those extra few ticks of confirmation will save you from many losers.
5. assuming all gaps fill
this is the killer. if you're trading FVGs expecting them to fill, you're fighting the probabilities. our data shows 60%+ hold — trade them as support/resistance, not fill targets.
6. overleveraging based on probability
yes, 63% is a good win rate. no, that doesn't mean you should bet the farm. even good setups fail 37% of the time. position size like a professional.
tools for identifying fair value gaps
manual identification
you can spot FVGs with nothing but a candlestick chart:
- look for strong directional moves
- identify the three-candle pattern
- mark the gap between candle 1 and 3
- set alerts for price returning to the zone
it takes practice, but you'll get faster at spotting them.
edgeful FVG indicator
why do it manually when you can automate? our FVG indicator:
- automatically identifies all fair value gaps
- plots them directly on your tradingview chart
- tracks whether they've been mitigated
- customizable timeframes and settings
to access it, just input your TradingView username in the edgeful dashboard, then find it in your invite-only indicators.
other platforms
sure, other platforms have FVG indicators. but do they tell you the probability of each gap holding? do they show you historical performance data?
that's the difference. anyone can draw boxes on a chart. only edgeful gives you the statistics to trade with confidence.
frequently asked questions
what is a fair value gap in simple terms?
a fair value gap is a price area on your chart where the market moved so quickly that it left behind an "unfilled" zone between candles. think of it like the market taking the stairs three at a time instead of one — it skips some steps. these gaps occur when there's aggressive buying or selling, creating an imbalance that often acts as a magnet for future price action.
how do you identify fair value gaps?
look for three consecutive candles where the wicks of the first and third candles don't overlap. for a bullish FVG, the third candle's low must be higher than the first candle's high. for a bearish FVG, the third candle's high must be lower than the first candle's low. the gap between these levels is your fair value gap.
do fair value gaps always get filled?
no! this is a common misconception. according to edgeful data on YM futures, bullish fair value gaps remain unfilled 60.71% of the time and bearish gaps remain unfilled 63.2% of the time during the same trading session. this means FVGs actually work better as support/resistance levels than as fill targets.
what's the best timeframe for trading fair value gaps?
30-minute charts provide the optimal balance between significance and frequency. shorter timeframes like 5-minute create too many gaps (noise), while hourly charts might only show 1-2 per session. the 30-minute timeframe typically gives you 3-5 quality setups per day.
what is fair value gap vs regular gap?
regular gaps (gap up/gap down) occur between trading sessions when the market opens higher or lower than the previous close. fair value gaps happen within the trading session as three-candle patterns showing rapid price movement. regular gaps are about overnight imbalances, while FVGs represent intraday momentum.
how do you trade fair value gaps profitably?
trade them as support/resistance zones rather than expecting fills. wait for price to return to the FVG area, look for rejection signals (pin bars, volume spikes), then enter in the direction of the original trend. set stops beyond the FVG and target previous highs/lows or key levels.
wrapping up today's lesson
let's recap today's deep dive into fair value gaps:
- they're three-candle patterns showing market imbalances
- 30-minute timeframes give the best trading opportunities
- 60.71% of bullish and 63.2% of bearish FVGs remain unfilled
- trade them as support/resistance, not fill targets
- "by close" analysis gives cleaner probabilities than "by wick"
- combine with other indicators and edgeful reports for maximum edge
the difference between profitable FVG trading and losing money isn't about finding more gaps — it's about understanding the probabilities and trading accordingly.
stop assuming every gap must fill. start trading the actual data.
your next steps
ready to trade fair value gaps with real probability data backing every decision?
- check the fair value gaps report for your favorite ticker
- watch andré's video walkthrough showing live FVG trades
- add the FVG indicator to your tradingview charts
- combine with other strategies:
remember — every level you trade should have historical probabilities backing it up. fair value gaps are no different.
use the data, not your emotions.
p.s. — if you enjoyed today's breakdown on fair value gaps, wait until you see what our algos can do with this data. they automatically identify and trade the highest probability FVG setups. just saying...