trading pivot points: data-backed strategy for futures traders
most traders plot pivot points every single day. S1, S2, S3, PP, R1, R2, R3... seven levels that supposedly tell you where price might reverse or break out.
but here's the problem I see constantly: traders treat all trading pivot points equally. they set alerts on R3 even when price opens near S1. they target S3 when the data shows it has a 2% chance of being touched. they're plotting levels without any understanding of which ones actually matter.
that's why we built the pivot point report on edgeful. it doesn't just show you the levels—it shows you exactly which pivots are likely to get touched based on where price opens. real probabilities. real data. no guesswork.
in this post, we're going to cover everything you need to know about trading pivot points the right way: what they actually measure, why most traders use them wrong, and how to apply probability data to your pivot point trading strategy.
table of contents
- what are pivot points in trading
- why most traders use pivot points wrong
- how edgeful's pivot point report works
- understanding the probability data
- practical trading strategies using pivot points
- combining pivot points with other reports
- the edgeful pivot points TradingView indicator
- frequently asked questions
- key takeaways
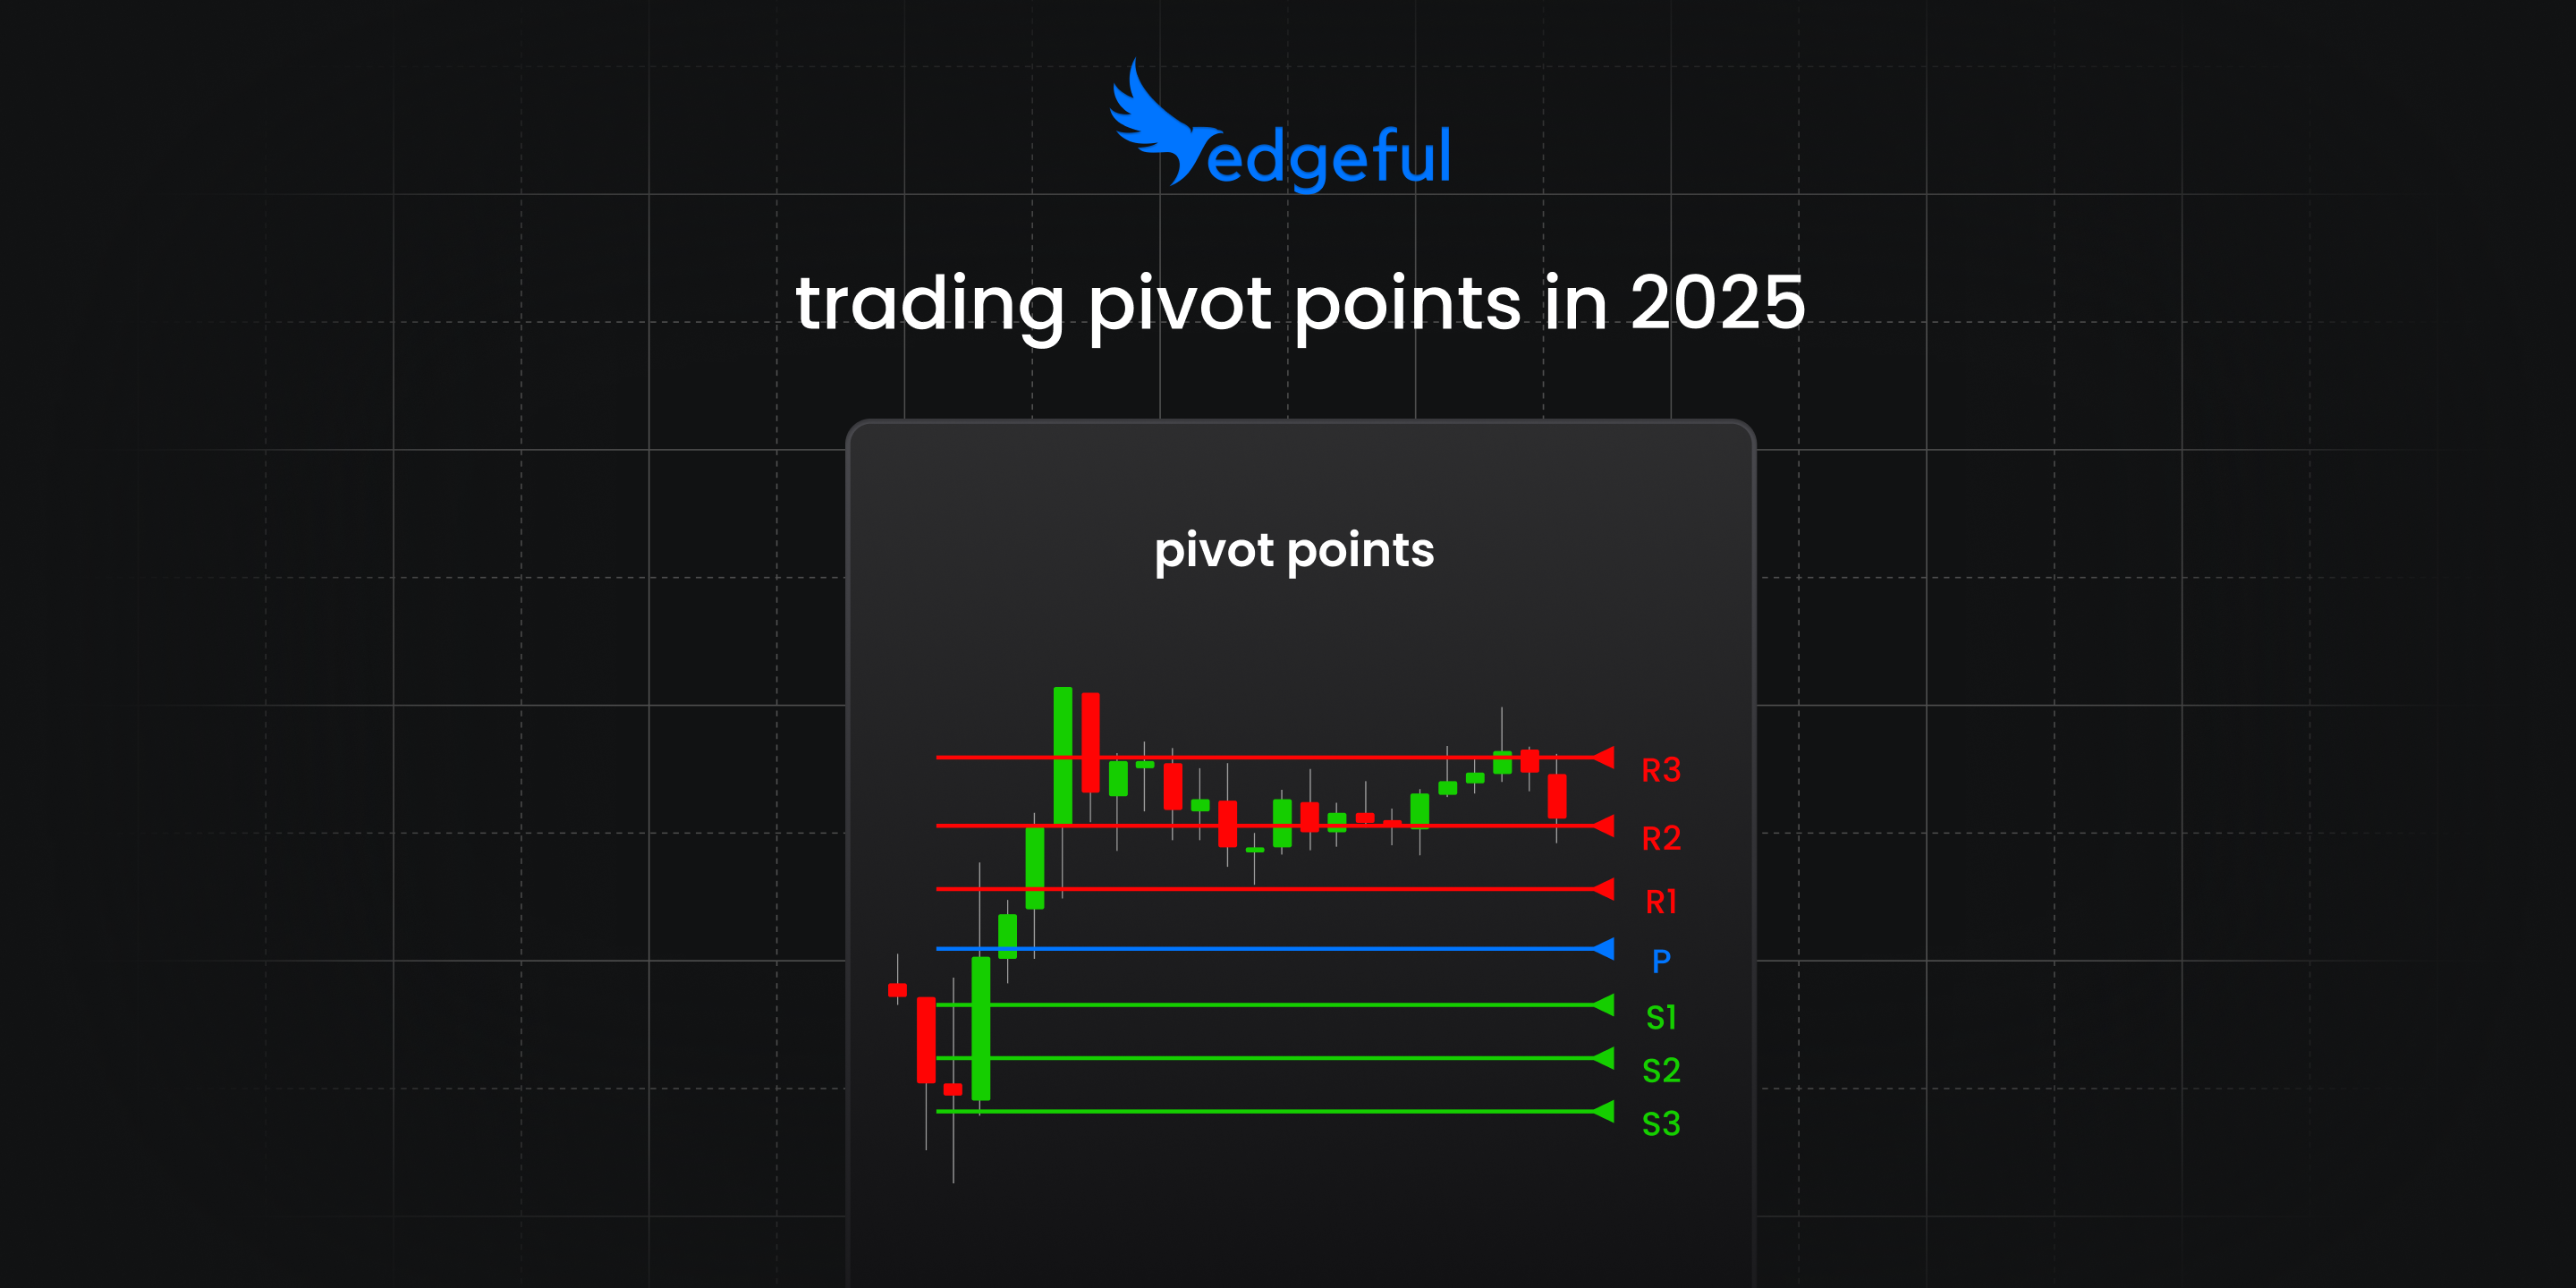
what are pivot points in trading
the traditional trading pivot points calculation
pivot points are calculated support and resistance levels derived from the previous session's price action. the standard formula takes the high, low, and close from yesterday and creates seven distinct levels for today.
here's how the math works:
the pivot point (PP) = (previous high + previous low + previous close) / 3
from there, you calculate three resistance levels above and three support levels below:
- R1 = (2 × PP) - previous low
- R2 = PP + (previous high - previous low)
- R3 = previous high + 2 × (PP - previous low)
- S1 = (2 × PP) - previous high
- S2 = PP - (previous high - previous low)
- S3 = previous low - 2 × (previous high - PP)
these formulas have been used by traders for decades. the appeal is obvious—you get pre-calculated levels before the market even opens. no subjective line drawing. no wondering if you placed your support level correctly.
but just because everyone uses them doesn't mean everyone uses them correctly...
why traders love trading pivot points
there are legitimate reasons why trading pivot points became so popular:
they're objective. two traders looking at the same chart will get the exact same pivot levels. there's no debate about where S1 should be—the math determines it.
they're pre-calculated. you know your key levels before the opening bell. this gives you time to plan your trades instead of scrambling to draw lines when the market opens.
institutional traders watch them. when enough market participants pay attention to the same levels, those levels become relevant regardless of their theoretical validity. it's a self-fulfilling prophecy effect.
they provide multiple reference points. instead of just watching previous day high/low, you get seven distinct levels that could act as support or resistance throughout the session.
the problem with traditional methods of trading pivot points
here's where it falls apart for most traders...
they plot all seven levels on their charts every single day. they set alerts on R3, R2, R1, PP, S1, S2, and S3. then they sit there waiting for price to "react" at these levels.
but they have no idea which levels actually matter.
if price opens between PP and S1, what are the odds it reaches R3 during the session? what about S3? which pivot level is most likely to be touched?
most traders don't know. they're trading pivot points blind.
and that's before we even get into the bigger issue: most pivot indicators use standard daily calculations that include overnight price action from sessions you're not even trading. if you're a NY session trader, why would you care about what happened at 2am in the Asian session?
this is where data changes everything.
why most traders get trading pivot points wrong
assuming all pivot point levels have equal probability
walk into any trading discord or watch any YouTube video about pivot points, and you'll see the same setup: all seven levels plotted on the chart with equal visual weight.
the message this sends is clear—every pivot level matters equally.
but that's statistically false.
I see traders setting profit targets at R3 when price opens between PP and S1. I see them placing stops at S3 when the data shows that level has less than a 5% chance of being touched during the session.
when you trade without probability context, you're essentially guessing. sure, you're guessing with calculated levels instead of random lines... but you're still guessing.
using standard daily trading pivot points instead of session-specific calculations
standard pivot point indicators calculate from midnight or the previous day's close. that means your "daily" pivot levels include price action from the Asian session, London session, and after-hours trading.
if you're trading the NY session (9:30am-4pm ET), why would overnight moves at 2AM matter for your intraday levels?
they don't.
session-specific trading pivot points—calculated only from the previous NY session if you're trading NY—give you far more relevant levels. they eliminate all the noise from sessions you're not participating in.
most traders miss this completely. they're using generic daily pivots when they should be using session-specific calculations.
manually plotting trading pivot points without indicators
even if you know the formulas, most traders waste 10-15 minutes every morning calculating and plotting their pivot levels.
they open their charting platform, pull up yesterday's data, run the calculations, and manually draw seven horizontal lines. some traders even use spreadsheets for this.
and then they do it all over again tomorrow. and the next day. and the next.
that's not just time-consuming—it's error-prone. miss one decimal point in your calculation and your entire pivot structure is off by several ticks.
but the bigger issue is this: while you're busy calculating and plotting trading pivot points, you're missing the actual question that matters...
trading pivot points without probability context
let's say you've done everything right. you calculated your session-specific pivot points correctly. you plotted all seven levels on your chart. you're ready to trade.
price opens at 42,850 on YM. you look at your trading pivot points and see:
- R2 at 43,100
- R1 at 42,950
- PP at 42,800
- S1 at 42,650
- S2 at 42,500
now what?
most traders would say "well, I'll look for longs targeting R1, then R2" or "I'll short back down to PP."
but they're making these decisions without any statistical backing. they don't know that from this opening location, R2 gets touched less than 30% of the time. here’s the data from our trading dashboard:
on the left — you can select where price opened.
in the middle — you see how often price touched each pivot point, based on where it opened, over the specified time duration (the screenshot above is over the last 6 months).
on the right — you will see where price closed based on where it opened.
the fundamental flaw when traders use trading pivot points is they don’t have this type of data available to them — they're trading based on what "should" happen instead of what actually happens.
how edgeful's trading pivot points report works
the data-driven difference
here's what makes edgeful's trading pivot points report different:
we've analyzed thousands of trading sessions across multiple timeframes to show you exactly which pivot levels get touched based on where price opens.
not guesses. not theories. actual historical probabilities.
the report tracks 13 different opening zones:
- above R3
- between R3 & R2
- between R2 & R1
- between R1 & PP
- between PP & S1
- between S1 & S2
- between S2 & S3
- below S3
for each opening zone, you get precise data showing how often every other pivot level gets touched during that session.
this is trading pivot points with full context. you know before you enter a trade what the probabilities are for reaching your target.
understanding opening zones
the opening zone is everything.
when price opens between R1 and PP, you're in a completely different probability environment than when it opens between S1 and S2. the levels that matter change based on your starting position.
breaking down the example of YM above, let’s get a little more into the data:
when price opened between trading pivot points PP and R1 (which happened 62 times), here's what the data shows:
- PP was touched 46 out of 62 days (74.2% probability)
- S1 was touched only 19/62 days (30.6%)
- S2 was touched 4 out of 62 days (6.5% probability)
- R1 was touched 34 out of 62 days (54% probability)
- R2 was touched 17 out of 62 days (27.4% probability)
but how many traders have R2 or S2 marked on their charts as a "potential target" without knowing this data? probably most of them.
session-specific trading pivot points calculations (critical)
this might be the most important feature of the pivot point report, and it's something most traders completely miss.
if you're trading futures, forex, or crypto during the NY session, your pivot points should be calculated from the previous NY session only. not from midnight. not from the previous day's close. from yesterday's NY session high, low, and close.
why does this matter?
because futures trade 23 hours a day. what happens during the Asian session at 3am has almost zero relevance to your 9:30am NY session trading. including that data in your pivot calculations just adds noise.
the edgeful trading pivot points report handles this automatically. when you select "NY session," it calculates pivots from previous NY session data. when you select "London session," it uses previous London session data.
this gives you far more accurate levels for the specific session you're actually trading.
most traders skip this step and wonder why their pivot levels don't hold. it's because they're using pivots calculated from sessions they're not even participating in.
understanding the probability data
how to read the trading pivot points report
using the pivot point report is straightforward once you understand the workflow:
step 1: identify where price opened today relative to the pivot levels. are you between R1 & PP? between PP & S1? below S3?
step 2: go to the report and select that opening zone. the table will show you probabilities for touching every other pivot level.
step 3: focus on levels with probability above 60% for your profit targets. these are high-confidence levels where price is statistically likely to reach.
step 4: use the weekday and previous candle filters to refine your probabilities even further.
that's it. four steps to trading pivot points with data.
weekday variations
the pivot point report includes a "by weekday" filter that shows how probabilities change based on the day of the week.
some pivot levels have significantly higher touch rates on certain days. for example, Monday behavior can be different from Friday behavior due to weekend gaps, reduced volume on Fridays, and other market dynamics.
by filtering for specific weekdays, you can refine your edge even further. if PP gets touched 85% of the time on Tuesdays when opening between PP & S1, but only 72% on Fridays, that information matters for your position sizing and target selection.
this level of granularity separates traders who are serious about trading pivot points from traders who just draw lines on their charts.
by previous candle filter
the "by previous candle" filter adds another layer of probability refinement.
this filter shows you how pivot touch probabilities change based on whether the previous session closed green (bullish) or red (bearish).
here's how it works: you select YM, select NY session, then filter by "previous candle: green." now the report shows you probabilities specifically for days that followed a green session.
if yesterday was green (bullish close), today's probabilities shift. certain resistance levels might have higher touch rates. certain support levels might have lower touch rates.
same concept for red (bearish) previous candles—the probabilities shift in the other direction.
let's look at the example from the video: Thursday, March 6th closed green. the next day's pivot probabilities were different because of that previous green candle. when you filter the report to "previous candle: green," you see updated probabilities that account for this bullish momentum.
combining opening zone + weekday + previous candle color gives you incredibly specific probability data for your exact trading pivot points scenario.
practical trading strategies using pivot points
strategy 1: high-probability directional bias from the open
this is the most straightforward way to use trading pivot points with data.
wait for the market to open (9:30am ET for NY session). within the first few minutes, identify which opening zone you're in. then immediately check the pivot point report for that zone.
let's say you're trading YM and it opens between R1 and PP. you check the report and see:
- PP touched: 70% probability
- R1 touched: 45% probability
- R2 touched: 18% probability
the data is telling you something clear: price is more likely to move down toward PP than up toward R2.
this gives you a short bias for the session. you're not blindly shorting—you're positioning yourself with a 70% probability of your target being hit.
your trade setup:
- entry: wait for any bounce toward R1, then short
- target: PP level (70% probability of being touched)
- stop: above R1
this is trading pivot points with actual edge.
strategy 2: using pivot points for profit targets
one of the best applications of the pivot point report is target selection.
most traders struggle with taking profits too early or holding too long. they close winners at random levels based on how they feel, not based on where price is actually likely to go.
trading pivot points with probability data solves this.
let's use the real example from the video: price opened between R1 and PP. the report showed 70% probability of touching PP.
throughout the session, PP acted as a magnet. price flushed down to PP, bounced, then tested it multiple times. traders who had PP marked as their profit target got filled at the exact level the data predicted.
this is what data-backed target setting looks like. you're not guessing. you're not "hoping" price reaches your target. you know the statistical probability before you enter the trade.
strategy 3: pivot reversals with high probability
when price reaches a pivot level with 80%+ touch probability, that level becomes a high-confidence reversal zone.
here's the setup: price opens between PP and S1. the report shows PP gets touched 85.2% of the time. you wait for price to test PP.
when price reaches PP, you're looking for rejection signals:
- hammer candles or inverted hammers
- long wicks at the level
- volume spikes indicating absorption
- price struggling to break through
if you get confirmation of rejection at a high-probability pivot level, the reversal trade has stacked probabilities:
- the level was statistically likely to be reached (85.2%)
- pivot points are watched by many market participants (self-fulfilling prophecy effect)
- you have visual confirmation of rejection
your trade setup:
- entry: on rejection at PP
- target: back toward the opening range or next high-probability pivot
- stop: beyond PP with buffer for volatility
this approach works because you're trading at levels where statistical probability and actual market structure align.
strategy 4: avoiding low-probability targets
knowing where not to trade is just as valuable as knowing where to trade.
when the pivot point report shows a level has less than 15% touch probability from your opening zone, that level should be completely off your radar for the session.
example: price opens between R1 and PP (51 instances over 6 months on YM). the report shows:
- R3 touched: minimal percentage
- S3 touched: minimal percentage
why would you ever set a profit target at R3 or S3? the data is screaming at you that price isn't going there.
but I see traders do this all the time. they have seven pivot levels on their charts and they're watching all of them equally. massive waste of mental energy.
the correct approach: hide the low-probability levels. if R3 has less than 10% probability, delete it from your chart. focus exclusively on the levels that matter statistically.
this mental decluttering improves your trading significantly. fewer levels to watch means better focus on the levels that actually matter.
strategy 5: risk management using pivot data
the probability data isn't just for profit targets—it's also critical for stop placement.
if you're long and price opens between PP and S1, you know from the data that S3 is unlikely to be touched (typically less than 12% probability). that means you can use S2 as your stop level instead of S3.
this tightens your risk while still giving price room to move. you're not setting an arbitrary stop based on "2% account risk" or some dollar amount. you're setting a data-backed stop at a level where, if price reaches it, the probabilities have clearly shifted against you.
same concept works for resistance. if you're short and the data shows R2 gets touched less than 15% of the time from your opening zone, you don't need to set your stop all the way at R3. R2 is sufficient.
tighter stops + data-backed placement = better risk/reward ratios.
strategy 6: combining with opening range breakout
this is where trading pivot points becomes really powerful—when you combine multiple reports.
the opening range breakout (ORB) strategy uses the first 15 minutes of the NY session to establish a trading range. when price breaks above the ORB high or below the ORB low, you have a directional signal.
but where do you set your profit target on an ORB breakout?
this is where pivot points come in. if the ORB high aligns near R1, and the pivot point report shows R1 has 75% touch probability from today's opening zone, you have stacked probabilities:
- ORB breakout signal (directional edge)
- R1 pivot target (statistical edge)
both reports pointing in the same direction = higher confidence trade.
you can read more about the complete opening range breakout strategy in our detailed ORB guide.
combining pivot points with other edgeful reports
pivot points + initial balance
the initial balance (IB) is the range established in the first hour of trading (9:30-10:30am ET for NY session).
when you combine IB levels with pivot points, you create zones of confluence that have significantly higher probability of holding as support or resistance.
here's a real scenario: price opens and forms an IB with the high at 42,950. you check your pivot levels and see R1 is at 42,945. the IB high and R1 pivot are within 5 points of each other.
this is a confluence zone. both the IB report data and the pivot point report data suggest this level matters. when price tests 42,950, you're watching a level backed by multiple data sources.
the reverse works too. if IB low is at 42,650 and S1 is at 42,655, that's a strong support confluence where probability of holding increases.
you can learn more about trading the initial balance in our IB strategy guide.
pivot points + previous day's range
the previous day's high and low are significant levels that many traders watch. when these levels align with trading pivot points, you get another layer of confluence.
example: previous day high was 43,100. today's R2 pivot calculates to 43,095. you have two separate data points suggesting 43,100 is a key resistance level.
the "by previous candle" filter in the pivot point report actually uses this concept. it shows you how probabilities change based on whether the previous session closed green or red, which indicates whether you closed near the top or bottom of the previous range.
when previous day high/low aligns with a high-probability pivot level, that's where you want to be paying attention.
pivot points + gap fill strategy
gaps are common in futures trading, especially at the session opens. when price opens with a gap (above or below the previous close), traders often look for gap fill trades.
the pivot point report helps you identify the best target for your gap fill trade.
let's say ES gaps up at the open, and price is now between R1 and R2. you're looking for a gap fill back down to the previous session close. but where should you take profits on the way down?
check the pivot levels. if PP sits near the previous close and the pivot report shows 80% probability of PP being touched from your current opening zone, that's your target.
you're combining gap fill probability with pivot touch probability—double confirmation that your target makes sense.
the edgeful pivot points TradingView indicator
automated plotting eliminates manual work
calculating and plotting seven pivot levels every single day is tedious. you're prone to errors. you waste time that could be spent analyzing the actual market.
that's why we built the pivot points TradingView indicator for edgeful subscribers.
there are actually two versions depending on what you're trading:
for futures, forex, and crypto: use "pivot points by session" for stocks: use "pivot points" (standard)
the difference matters. futures trade across multiple global sessions, so you need session-specific pivot calculations. stocks have defined market hours, so standard daily pivots work fine.
both indicators are available exclusively to edgeful subscribers through the invite-only indicator library on TradingView.
how to get access
getting access is straightforward:
- log into your edgeful dashboard
- go to settings and enter your TradingView username
- open TradingView and go to your indicators list
- scroll to the "invite only" section
- you'll see all edgeful indicators including the pivot points tools
once added to your chart, the indicator automatically plots all seven pivot levels and updates them at the start of each session. no calculations. no manual drawing. just data.
what the indicator plots
the indicator displays all seven pivot levels with clear color coding:
- S3, S2, S1 (support levels) in one color scheme
- PP (pivot point) as the centerline
- R1, R2, R3 (resistance levels) in another color scheme
the levels update automatically at the start of each session based on the previous session's high, low, and close.
for example, if you're trading YM and the indicator shows PP at 42,823, you can verify this matches the edgeful pivot point report (which it will, because they use the same calculation).
customization options
the indicator includes several customization features:
session selection: choose NY, London, or Asian session for your pivot calculations. this is critical for getting accurate levels based on the specific session you trade.
timeframe adjustments: adjust which lookback period the calculations use.
visual customization: show or hide specific levels. if the pivot report shows R3 has 0% touch probability today, hide it from your chart completely.
color changes: modify colors and line styles to match your charting setup.
alerts: set price alerts when price touches specific pivot levels. get notified on your phone when YM tests PP.
these customization options let you tailor the indicator to show only high-probability levels based on the pivot point report data.
stocks vs futures setup difference
this is important and trips up a lot of traders:
if you're trading stocks (like TSLA, AAPL, SPY), you need to:
- enable extended trading hours on your TradingView chart
- use the standard "pivot points" indicator (not "pivot points by session")
if you're trading futures, forex, or crypto, you need to:
- use "pivot points by session" indicator
- select which session (NY, London, Asian) you want pivots for
using the wrong indicator gives you wrong levels. I've seen traders confused about why their pivots don't match the edgeful report—it's usually because they're using the futures indicator on stocks or vice versa.
match your indicator to your asset class and you'll get accurate levels every time.
frequently asked questions
what are pivot points in trading?
pivot points are calculated support and resistance levels based on the previous session's high, low, and close. they provide pre-determined price levels that traders watch for potential reversals or breakouts. the standard calculation creates 7 levels: three support (S1, S2, S3), three resistance (R1, R2, R3), and the pivot point itself (PP). these levels help traders identify where price might find support or resistance during the current session.
how do you calculate trading pivot points?
the pivot point formula is: PP = (previous high + previous low + previous close) / 3. from there: R1 = (2 × PP) - previous low, S1 = (2 × PP) - previous high, R2 = PP + (previous high - previous low), S2 = PP - (previous high - previous low), R3 = previous high + 2 × (PP - previous low), S3 = previous low - 2 × (previous high - PP). however, knowing the calculation isn't enough—you need probability data to know which levels actually matter for your trading session.
how accurate are pivot points for trading?
traditional pivot points lack probability context. edgeful's pivot point report shows that accuracy depends entirely on where price opens. when YM opens between PP & S1, the PP level gets touched 85.2% of the time (23 out of 27 days), while R3 gets touched 0% of the time. accuracy isn't about the pivot levels themselves—it's about knowing which levels are statistically likely to be touched from your specific opening location. without this data, you're trading pivot points blind.
should I use session-specific or daily pivot points for futures?
always use session-specific pivot points for futures trading. unlike stocks, futures trade nearly 24 hours across multiple global sessions. session-specific pivots calculated from the previous NY session are far more relevant for NY trading than standard daily pivots that include Asian and London price action. edgeful's "pivot points by session" indicator handles this automatically. if you're a NY session trader, you don't care what happened at 2am in Tokyo—session-specific pivots eliminate that noise completely.
can I combine pivot points with other trading strategies?
absolutely. pivot points work best when combined with other data-backed strategies like opening range breakouts, initial balance trading, or gap fills. when multiple reports align on the same price level, your probability of success increases significantly. for example, if ORB high, R1 pivot, and previous day high all cluster within 10 points, that's a strong resistance zone with stacked probabilities. this is how you find A+ setups—by combining trading pivot points with other statistical edges.
which pivot level is most important?
it depends on where price opens. the pivot point report shows that from certain opening zones, PP gets touched 80%+ of the time, making it the most important level. from other opening zones, S1 or R1 might be more relevant. there's no universally "most important" pivot—context from the probability data determines which level matters most for any given trading session. this is why trading pivot points without data leads to poor target selection and inconsistent results.
key takeaways
- trading pivot points without probability data means guessing which levels matter
- where price opens determines which pivot levels are likely to be touched during the session
- when YM opens between PP & S1, the PP gets touched 85.2% of the time while R3 gets touched 0%
- session-specific pivots (NY, London, Asian) are more accurate than standard daily pivots for futures
- use edgeful's pivot point report to check probabilities before setting targets or stops
- combine pivot levels with ORB, IB, and previous day's range for stacked probabilities
- the edgeful TradingView indicator automates pivot plotting across any session
- filter by weekday and previous candle color for refined probability data
- don't waste time monitoring pivot levels with less than 15% touch probability
- focus your attention on levels with 60%+ probability for better risk/reward
- stocks require the standard pivot indicator while futures need the session-specific version
- hide low-probability levels from your chart to reduce noise and improve focus
want data-backed trading strategies delivered weekly?
join thousands of futures traders who get our stay sharp newsletter with real market data, probability reports, and practical strategies you can use immediately.
no fluff. no hype. just data.