building a customized trading dashboard: real-time data for day traders

if you're like most traders, your morning routine probably looks something like this: open TradingView, pull up SPY, check some futures overnight, maybe scan a few news headlines, and then... hope for the best.
here's the problem with that approach — you're making decisions based on incomplete data and gut feelings instead of actual probabilities. I've watched thousands of traders fight bullish days trying to short tops. I've also seen them go long when everything is screaming bearish. they wonder why they keep losing money when the answer is right in front of them: they're trading against the market instead of with it.
and if you didn’t know, most "trading dashboards" are just fancy chart displays that show you what happened, but don't tell you what's likely to happen next. they definitely don't give you a clear bias for the session or show you which setups are actually worth your time.
that's exactly why we built edgeful's trading dashboard differently. instead of showing you more charts, we show you actionable data. instead of leaving you to guess what the market bias is, we deliver it using real probabilities from 100+ reports.
table of contents
- why traditional trading dashboards fail traders
- how real-time data elevates your trading
- finding trade ideas with a trading dashboard
- personalizing your trading dashboard with screeners
- tracking performance in your trading dashboard
- dashboard integrations and customization
- frequently asked questions
- key takeaways
why traditional trading dashboards fail traders
the problem with static charts and emotional decisions
traditional platforms like TradingView or ThinkorSwim give you static charts that show price movement, but they don't give you context. they don't tell you probabilities. they don't help you understand which direction has the statistical edge.
you end up staring at charts wondering "should I be long or short?" instead of having the data tell you exactly what bias you should have.
why gut feelings destroy trading accounts
I've worked with plenty of traders who've blown accounts because they entered the market with a predefined bias. "I feel bullish today" or "something just feels off" — to be honest, using your emotions rather than data to build a bias is complete garbage.
how real-time data elevates your trading
edgeful's data advantage: live probabilities and session bias
every morning, I wake up and check one thing first: our overall sentiment bar. in one glance, I know if I should be looking for long setups, short opportunities, or if it's a day to size down and be patient.

this isn't based on my opinion or how I'm feeling about the market that morning. it's based on actual data from proven trading reports across the market's biggest names.
here's my exact setup: I track the Magnificent 7 stocks (AAPL, MSFT, GOOGL, AMZN, NVDA, TSLA, META) plus the major indices (SPY, QQQ, ES, NQ) across four key reports:
- opening candle continuation
- initial balance standard
- IB by rejection
- previous day's range
the daily bias bar: your trading game-changer
we just pushed this feature to all edgeful members, and it immediately changes how you approach the market on a daily basis. the overall sentiment bar aggregates the bullish/bearish bias across all the tickers and reports you have selected in your what's in play screener.
instead of guessing what the market bias is, you get it delivered in one glance, using data — not opinion.
when you see the sentiment bar showing 75% bullish (like 12 out of 16 tickers showing bullish bias), the data is telling you to look for long setups and avoid shorting. when it's 77% bearish, you focus on short opportunities. when it's mixed signals around 50/50? that's your sign that it's going to be a choppy day where you should reduce size or stay out completely.

the difference between charts and actionable data
charts show you what happened. data shows you what's likely to happen next. when you only look at price action, you're missing the statistical context that separates professional traders from gamblers.
for example, our initial balance report doesn't just show you the opening range — it tells you that NQ breaks out of the IB range in only one direction 82% of the time. this means there's a very high probability that once price breaks above the IB high, it's not coming back to break the IB low.
that's actionable intelligence you can't get from staring at a candlestick chart.
finding trade ideas with a trading dashboard
the what's in play dashboard: depth on single tickers
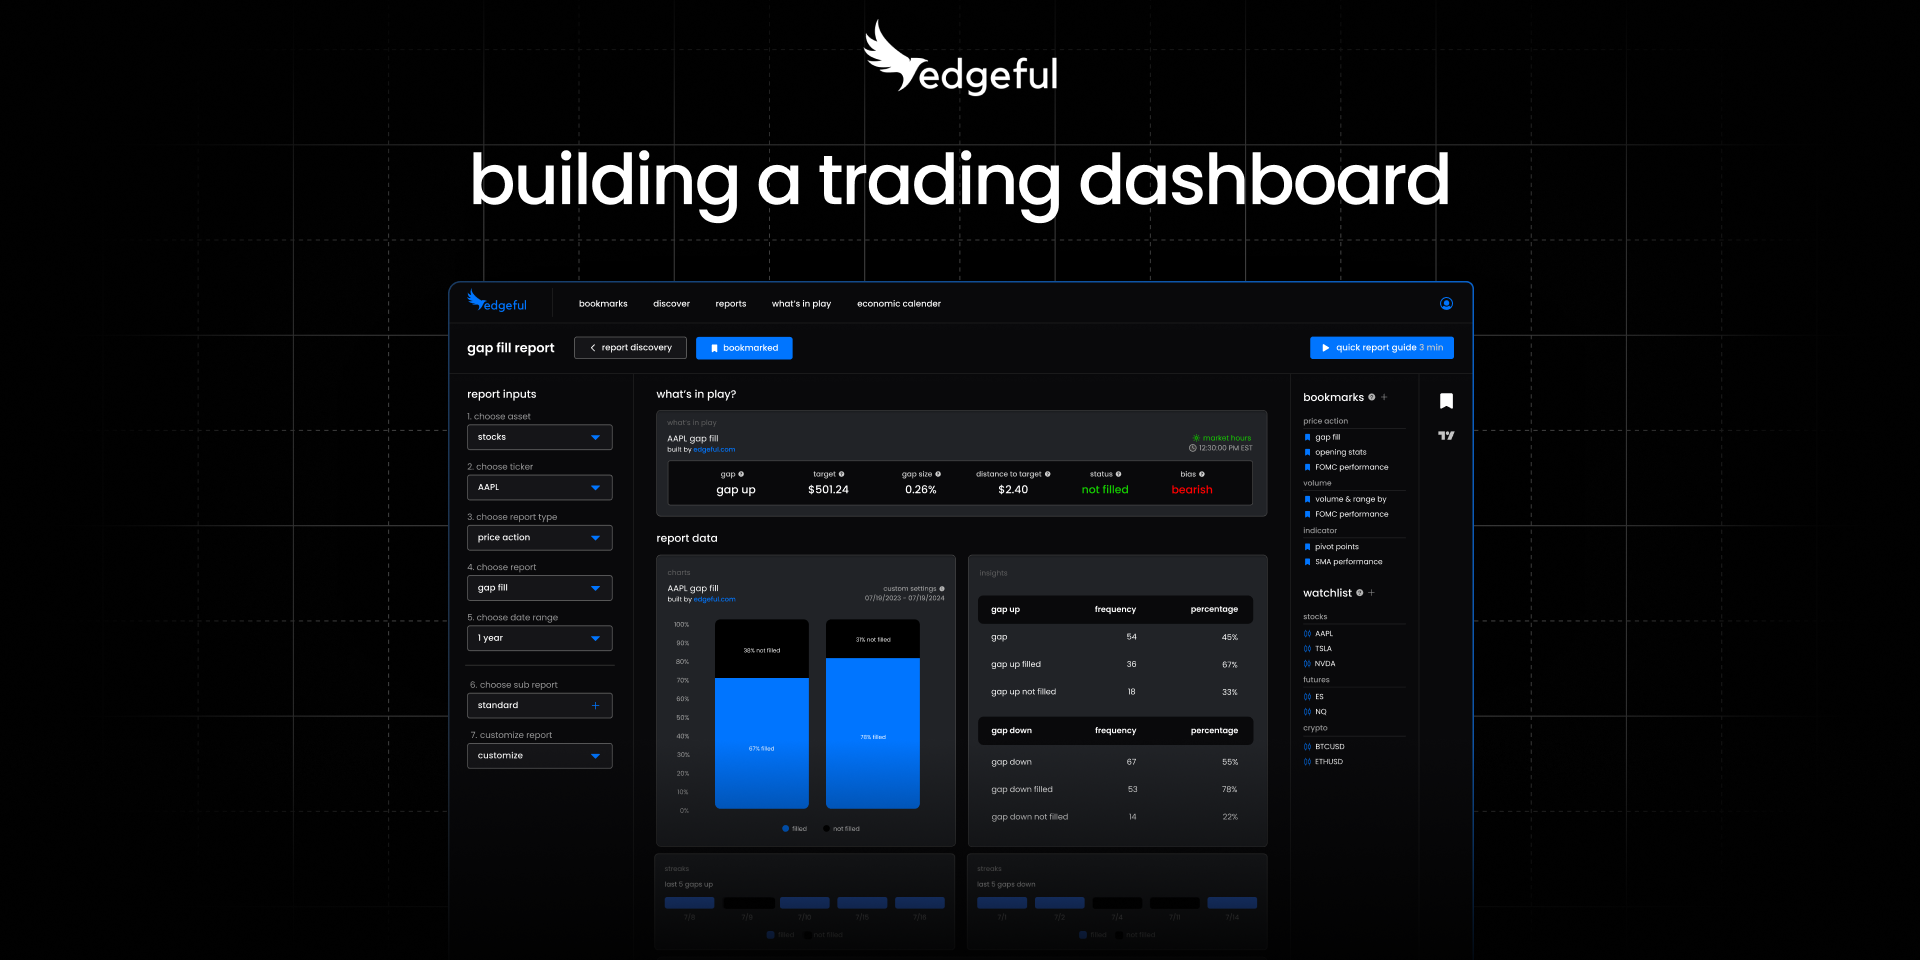
when you need to drill down on a specific instrument, the what's in play dashboard gives you everything you need to know about high-probability setups forming in real-time.
instead of manually calculating gap fills or plotting initial balance ranges, the trading dashboard does all the work for you. you'll see:

- gap fill status with exact targets and probabilities
- current IB zone with breakout/breakdown percentages
- previous day's range levels with historical success rates
- bias determination based on current price action and statistical data
the platform literally tells you whether you should be bullish, bearish, or neutral based on the data — no guesswork required.
surface high-probability setups with 100+ reports
our comprehensive dashboard upgrade gives you access to over 100 customizable reports across stocks, futures, forex, and crypto. you can filter by:
- asset class (stocks, futures, forex, crypto)
- trading style (scalping, day trading, swing trading)
- report category (price action, volume, indicators)
- specific market conditions
this means whether you're trading gap fills with 73% success rates, initial balance breakouts, or opening range patterns, you have the statistical edge before you enter any position.
eliminating the tab-switching nightmare
here's what makes a proper trading dashboard different: everything you need is in one place. no more jumping between 12 different tabs, missing setups because you were looking at the wrong screen, or entering trades based on incomplete information.
when a setup meets your criteria, you can route orders directly from the platform. the integration eliminates the lag between signal identification and execution — critical for day and futures traders where seconds matter.
personalizing your trading dashboard with screeners
the what's in play screener: your trading command center
this is where the magic happens. while the what's in play dashboard gives you depth on a single ticker, the what's in play screener provides breadth across multiple instruments simultaneously.
instead of analyzing one ticker at a time, you can now track how up to 50 different instruments are setting up across your favorite reports. this gives you a bird's-eye view of market behavior that's impossible to achieve with traditional charting platforms.
this is where the daily bias bar lives.
building custom templates for different trading sessions

you can build custom templates of reports to analyze at different parts of the trading day:
first hour templates — focus on gap fills, opening range breakouts, outside day patterns, and average daily range for quick morning trades
midday templates — monitor different setups that typically play out during the middle of the session
end-of-day templates — track power hour breakouts, opening candle continuation, and previous day's range to anticipate closing moves
as I mentioned in a recent stay sharp edition, I only focus on these reports during the first hour (when each setup is likely to play out): gap fill, opening range breakout, outside day, and average daily range.
developing session bias in seconds instead of hours
let's say I'm watching the opening candle continuation report, and I see that by 1PM ET, the majority of the tickers I track have a bearish bias — and I can see it instantly. I don’t have to flip through 12 different tickers, track which side of the opening range they broke out of, and then determine my bias that way.

this is exactly why building your own trading dashboard can save you a crazy amount of time, and tells you everything you need to know in seconds.
tracking performance in your trading dashboard
probability metrics in real-time
a proper trading dashboard doesn't just help you find setups — it helps you understand which ones actually work for your trading style. the report trading dashboard shows you:
- probabilities by setup and report type
- customizations like day of week
and much more.
algo dashboard integrations and customization
broker connectivity and real-time execution
seamless integration with NinjaTrader trading platforms means little to no lag between signal identification and trade execution. this is huge for traders who aren’t at the screens all day but don’t want to miss any trades that the algo executes.
100+ customizable reports across all markets
whether you're trading stocks, futures, forex, or crypto, the reports trading dashboard adapts to your preferred instruments and strategies. the report library includes:
- price action patterns (gaps, breakouts, reversals)
- volume analysis (institutional flow, retail sentiment)
- volatility indicators (range expansion, contraction)
- time-based patterns (session analysis, weekday effects)
TradingView integration for chart analysis
while the trading dashboard provides all the statistical analysis you need, you can still apply edgeful patterns directly to your TradingView charts using our 35+ custom indicators. this bridges the gap between data analysis and visual chart confirmation.

frequently asked questions
what makes edgeful's trading dashboard different from other platforms?
the key difference is our data-driven approach versus opinion-based trading. traditional trading dashboards show you charts and indicators, but they don't tell you probabilities or give you statistical context. edgeful's trading dashboard delivers real-time bias based on 100+ reports with actual historical data, not gut feelings or technical analysis opinions.
can I use this trading dashboard for futures trading?
absolutely. the trading dashboard is built specifically with day and futures traders in mind. ES and NQ optimization includes session-specific data, no PDT restrictions, and time-based templates for different market hours. the real-time data updates are critical for futures trading where market conditions can change rapidly throughout the session.
how do I set up the screener for my specific trading style?
setting up your trading dashboard screener is straightforward: go to your edgeful dashboard, navigate to the "screener" tab, click "customize screener," then select your 4 favorite reports and add your top tickers. I recommend starting with the "daily bias" template which includes opening candle continuation, initial balance standard, IB by rejection, and previous day's range across the Magnificent 7 plus major indices.
what's the difference between the dashboard and the screener features?
the what's in play dashboard gives you deep analysis on a single ticker across multiple reports — perfect when you want comprehensive data on a specific instrument. the what's in play screener provides broad analysis of multiple tickers across select reports — ideal for developing overall market bias and finding opportunities across your entire watchlist. use the dashboard for execution decisions and the screener for market direction.
does the trading dashboard work for swing traders or just day traders?
while the real-time features are obviously most beneficial for day and futures traders, swing traders can absolutely use the trading dashboard effectively. the reports include longer-term patterns, weekly analysis, and position-holding strategies. you can customize timeframes and filter for swing trading setups that develop over multiple days rather than intraday movements.
how accurate are the probabilities shown in the trading dashboard?
the probabilities are based on live data — there’s no bias, no opinion, just market data. for example, when we show that initial balance breakouts have an 82% single-break rate, that's based on actual action that’s happened in the market. however, past performance doesn't guarantee future results — the probabilities give you statistical context to make more informed decisions, not certainty about outcomes.
key takeaways
the bottom line: most traders fail because they trade on opinion instead of data. edgeful's trading dashboard eliminates guesswork by showing you exactly what's setting up, when to trade it, and what bias to have — all in real-time.
here's what you get with a proper data-driven trading dashboard:
- real-time bias development using the overall sentiment bar across major tickers and indices
- what's in play dashboard for deep single-ticker analysis with probabilities and key levels
- multi-ticker screener for broad market analysis and session bias development
- 100+ customizable reports with actual statistical data across all asset classes
- seamless broker integration for direct order execution from signal identification
- performance tracking to identify which setups work best for your trading style
- custom templates for different trading sessions and market environments
stop wasting time hunting for setups and trading on emotions. the most successful traders I've worked with use data to guide every decision — from market bias to position sizing to exit strategies.
when you have access to real probabilities instead of guessing, trading becomes less about hoping you're right and more about consistently applying statistical edges.
ready to trade with data instead of emotions? get started with edgeful and see exactly what the market is telling you every single day.


