losing streaks in trading: the math behind what's normal & what's not
today I want to tackle something that destroys more trading accounts than anything else — quitting a profitable strategy during a normal losing streak in trading.
it's one of the top reasons traders fail, and today I'm going to show you the exact data that will help you sit confidently through losing streaks vs. knowing when to abandon your strategy and find something new.
what you'll learn about losing streaks in trading
- the mathematical reality of consecutive losses (even with great strategies)
- why most traders abandon winning strategies at exactly the wrong time
- how to tell the difference between normal losing streaks and a broken strategy
- exactly how to use edgeful to confirm whether your strategy is still in favor
- practical position sizing recommendations to survive inevitable drawdowns
by the end of this article, you'll understand why consecutive losses are completely normal, even with high win-rate strategies — and more importantly, how to build the confidence to trade through them.
the brutal math behind losing streaks in trading
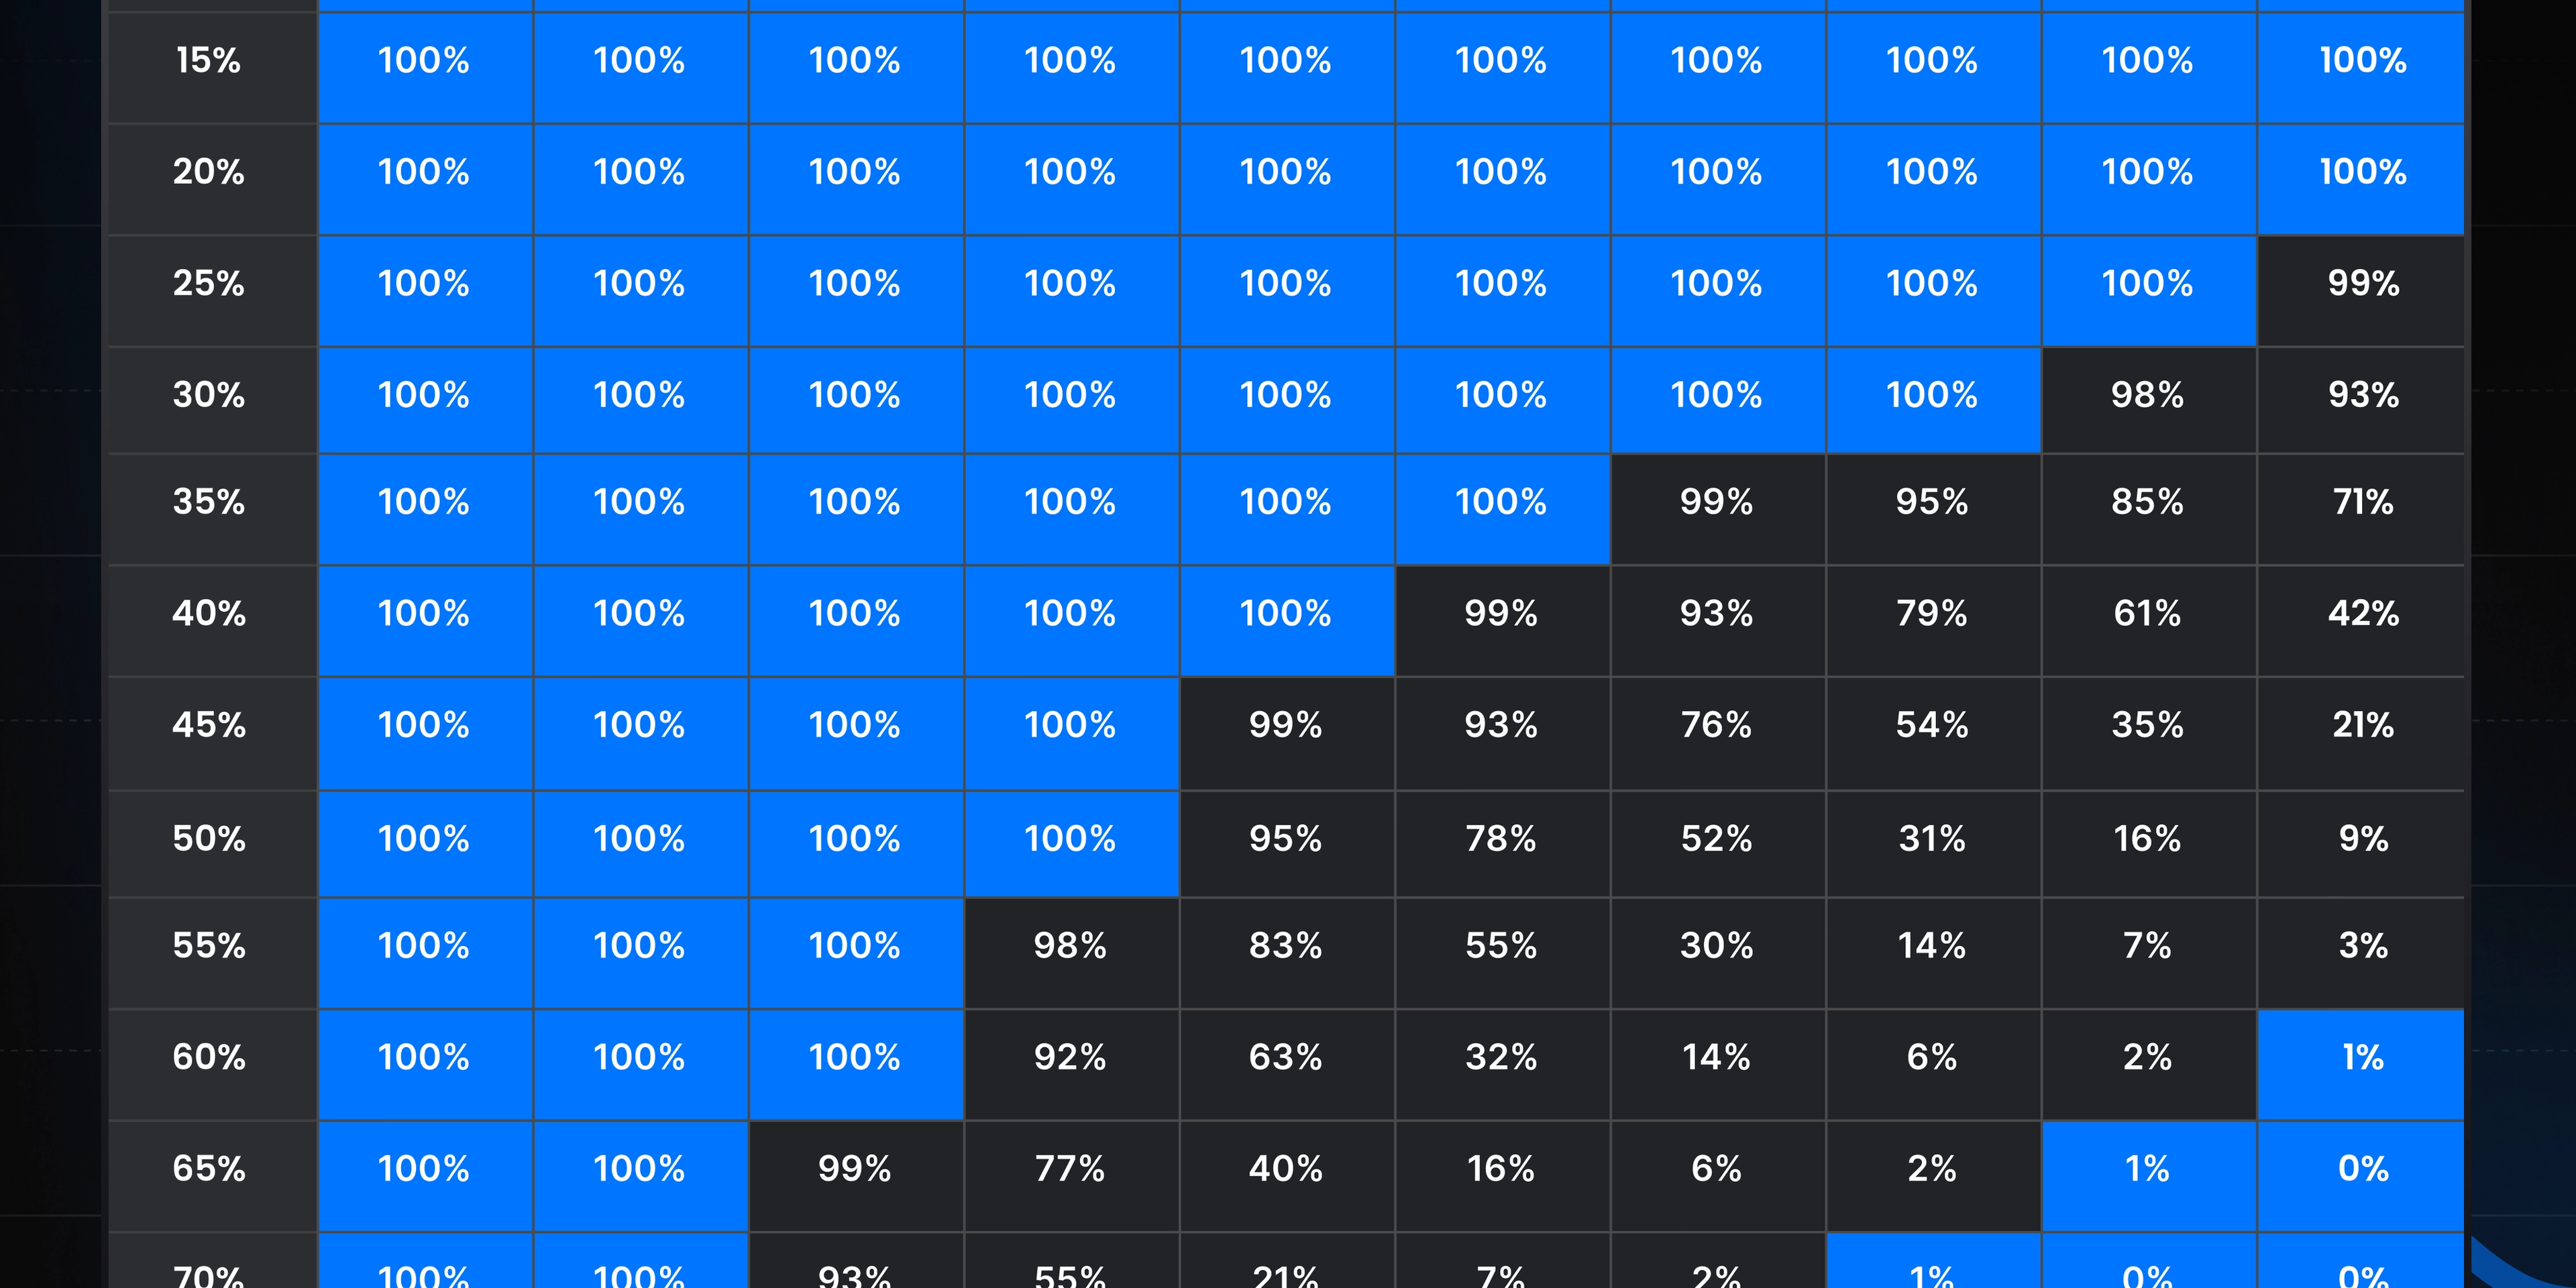
take a look at this chart — it's possibly the most important thing you'll ever see as a trader:
this chart shows the probability of experiencing X consecutive losing trades within a 100-trade sequence at different win rates.
the data here is eye-opening. even with a 60% win rate — which is considered excellent in trading — you have:
- a 100% chance of experiencing 3 consecutive losses
- a 92% chance of experiencing 4 consecutive losses
- a 63% chance of experiencing 5 consecutive losses
just think about that for a second.
if you have a strategy that wins 60% of the time (which is better than most professional traders), you're virtually guaranteed to experience 4 consecutive losses at some point during a 100-trade sequence.
now let's look at what happens with even better win rates:
- at a 70% win rate: you still have a 55% chance of 4 consecutive losses
- at a 65% win rate: you still have a 77% chance of 4 consecutive losses
this is the reality that most traders aren't prepared for.
they find a strategy that works, but the first time they hit 3 or 4 losses in a row, they panic and abandon it — usually right before it would have started winning again.
losing streaks in trading apply to our algos too
our ORB algo has delivered nearly a 70% win rate since October 1st, 2024 — which is incredible performance.
but according to the data, even with this high of a win rate:
- there's a 93% chance of experiencing 3 consecutive losses
- there's a 55% chance of experiencing 4 consecutive losses
- there's a 21% chance of experiencing 5 consecutive losses
what does this mean? it means that if you're trading our ORB algo, you should expect to hit 3 consecutive losses at some point — it's practically guaranteed. even 4 consecutive losses are more likely than not to happen.
but here's where most traders go wrong — they interpret this normal variance as a sign that the algo is "broken" or that the edge has disappeared, and they quit right when they should be staying the course.
you can even take a look at our IB algo — usually a 50% winning strategy from October to April of this year. and then when late april/early may hit, we've gone into a multi-trade losing streak.
does this mean the IB algo is broken?
of course not — it just means that we're in a cycle of normal variance where we're losing more than we're winning. this is exactly what the chart I shared at the start of this article is saying...
it doesn't mean you should lose complete confidence in the strategy or abandon it.
how to tell the difference between normal variance and a broken trading strategy
but of course there's the question — how do you know whether you're just experiencing normal consecutive losses or if your strategy has actually stopped working?
this is where last week's article becomes so important. remember those red flags I talked about:
- a 5% change against you in the report stats should raise a yellow flag
- a 10%+ change against you is a red flag
- multiple outliers in a row that go against high-probability setups
the key is to use both the consecutive loss table AND the edgeful reports to make this determination:
if you've had 4 consecutive losses with a 70% win rate strategy, but the edgeful report still shows a 70% win rate over the past 3 months — you're just experiencing normal variance. don't lose confidence, just know that it's normal and you should probably stay the course.
but if you've had 4 consecutive losses AND the edgeful report for that strategy shows the win rate has dropped from 70% to 60% over the past month — that's a sign the market environment might be changing, and it's time to adapt.
using data to confirm your trading strategy during losing streaks
here's my exact process for determining whether a losing streak in trading is just normal variance or a sign of bigger problems:
- check the consecutive loss table based on your strategy's win rate to see if your current losing streak is within normal expectations
- open your edgeful dashboard and compare your strategy's performance across multiple timeframes:
- last 1 month
- last 3 months
- last 6 months
- if the stats are consistent across these timeframes (within 5%), you're likely just experiencing normal variance — stick with the strategy
- if the recent timeframes show a significant drop in win rate (10%+), then it's time to adapt using the steps I outlined last week:
- size down
- check the "by weekday" subreport
- analyze other tickers
I've talked about this before, but a clear example for me was in December of '24. I hit a streak of 5 consecutive losers trading the gap fill on NQ. instead of panicking, I:
- checked the consecutive loss table and saw that 4 consecutive losses with my 65% win rate strategy had a 77% chance of happening — completely normal
- checked the gap fill report stats for the last month vs. the last 3 months and saw they had dropped significantly (80% to 70% within a couple of weeks)
- sized down, and since have been waiting for the gap fill to come back into favor
this is a great example of accepting consecutive losses, but then realizing that it wasn't just a regular losing streak in trading — the gap fill report showed a huge decrease within a short period of time and saved me from trading deeper into a drawdown.
I'm not abandoning the strategy — it's my favorite setup to trade — but I am using data, rather than my feelings, to tell me when to get aggressive and when to step back.
position sizing to survive losing streaks in trading
now that you understand consecutive losses are normal, how do you prepare for them?
this is where position sizing becomes critical. if you're trading a strategy with a 70% win rate, you need to size your positions so that 5 consecutive losses won't blow up your account.
here's a simple guide to follow:
- if your strategy has a 60% win rate, prepare for 5 consecutive losses
- if your strategy has a 70% win rate, prepare for 4 consecutive losses
- if your strategy has a 80% win rate, prepare for 3 consecutive losses
this means keeping your position size small enough that even after this worst-case scenario, you'll still have a decent amount of your capital intact.
for example, if you're risking 2% per trade with a 70% win rate strategy, 4 consecutive losses would result in an 8% drawdown — completely manageable. but if you're risking 5% per trade, those same 4 losses would result in a 20% drawdown — much harder to recover from psychologically.
these numbers are highly personal — some traders are fine with risking 10% of their account on a trade... you just have to know what a likely losing streak in trading looks like for your strategy & then adjust your sizing accordingly.
conclusion: embrace losing streaks as part of successful trading
let's do a quick recap of what we covered today:
- consecutive losses are mathematically inevitable, even with excellent strategies
- a 60% win rate strategy still has a 92% chance of 4 consecutive losses
- using edgeful reports to distinguish between normal variance and strategy failure
- position sizing recommendations to survive inevitable drawdowns
understanding this data gives you a massive edge over most traders who abandon strategies at the first sign of drawdown — thinking that the market has shifted and their strategy will never work again.
but by knowing what to expect and preparing accordingly, you can stay the course when others are giving up — which is often right before you go on a hot streak.
great traders are great not because they avoid losing streaks in trading — but rather because they understand data and have the confidence to trade through them. and if the market environment really has shifted, they can use data to spot that and adapt quickly.
that's what we give you at edgeful.