exponential vs simple moving average: which one should you use?
moving averages are on almost every trader's chart. they're one of the first indicators people learn.
and most traders use them wrong.
not because they don't understand what a moving average does — but because they don't understand the difference between an exponential vs simple moving average.
here's the truth: the exponential vs simple moving average debate isn't about which one is "better." it's about which one fits YOUR trading style, timeframe, and strategy.
use the wrong one and you'll get whipsawed by false signals. use the right one and you've got a tool that actually adds value to your analysis.
let's break down exactly how exponential vs simple moving average compare — and when to use each one.
table of contents
- what is a simple moving average (SMA)?
- what is an exponential moving average (EMA)?
- exponential vs simple moving average: key differences
- which is more accurate: exponential vs simple moving average?
- which moving average should you use?
- best moving average settings for day trading
- common mistakes traders make with moving averages
- frequently asked questions
- key takeaways
what is a simple moving average (SMA)?
before diving into exponential vs simple moving average differences, let's define each one.
a simple moving average is exactly what it sounds like: a straight average of price over a set number of periods.
how it's calculated:
add up the closing prices for X periods, divide by X. that's it.
for a 20-period SMA:
- add the last 20 closing prices
- divide by 20
- plot that value
- repeat for each new candle
key characteristic: every price in the calculation is weighted equally.
the close from 20 bars ago matters just as much as the close from 1 bar ago. this makes the SMA smooth and stable — but also slow to react. understanding this is crucial when comparing exponential vs simple moving average behavior.
pros of the simple moving average
- smoother line — less noise, fewer false signals in choppy markets
- easier to understand — straightforward calculation, no mystery
- better for identifying major trends — filters out short-term noise
- widely watched levels — the 50 SMA and 200 SMA are institutional benchmarks
cons of the simple moving average
- lags significantly — slow to react to price changes
- equal weighting is a problem — a price spike 20 bars ago affects today's reading just as much as current price
- late signals — by the time SMA confirms a trend, you've missed part of the move
what is an exponential moving average (EMA)?
an exponential moving average gives more weight to recent prices. the most recent candles have a bigger impact on the calculation than older candles.
how it's calculated:
the formula is more complex than SMA. it uses a multiplier that weights recent prices more heavily:
- multiplier = 2 / (period + 1)
- EMA = (current price × multiplier) + (previous EMA × (1 - multiplier))
for a 20-period EMA:
- multiplier = 2 / (20 + 1) = 0.095 (or 9.5%)
- today's closing price gets 9.5% of the weight
- the previous EMA (which contains all prior data) gets 90.5% of the weight
compare that to a 20 SMA where each of the 20 prices gets exactly 5% weight. with the EMA, today's price has nearly double the influence.
you don't need to memorize the formula. just understand the result: recent price matters more.
key characteristic: the EMA reacts faster to new price data.
when price moves, the EMA follows more quickly than an SMA of the same period. this is the fundamental exponential vs simple moving average distinction — speed of reaction.
pros of the exponential moving average
- faster reaction — picks up trend changes earlier
- prioritizes recent data — more relevant for short-term trading
- better for fast-moving markets — keeps up with momentum
- popular among day traders — the 9 EMA and 21 EMA are widely used
cons of the exponential moving average
- more noise — reacts to every wiggle, more false signals
- can be too fast — might signal a trend change that's just a pullback
- whipsaws in choppy markets — constant crossing back and forth
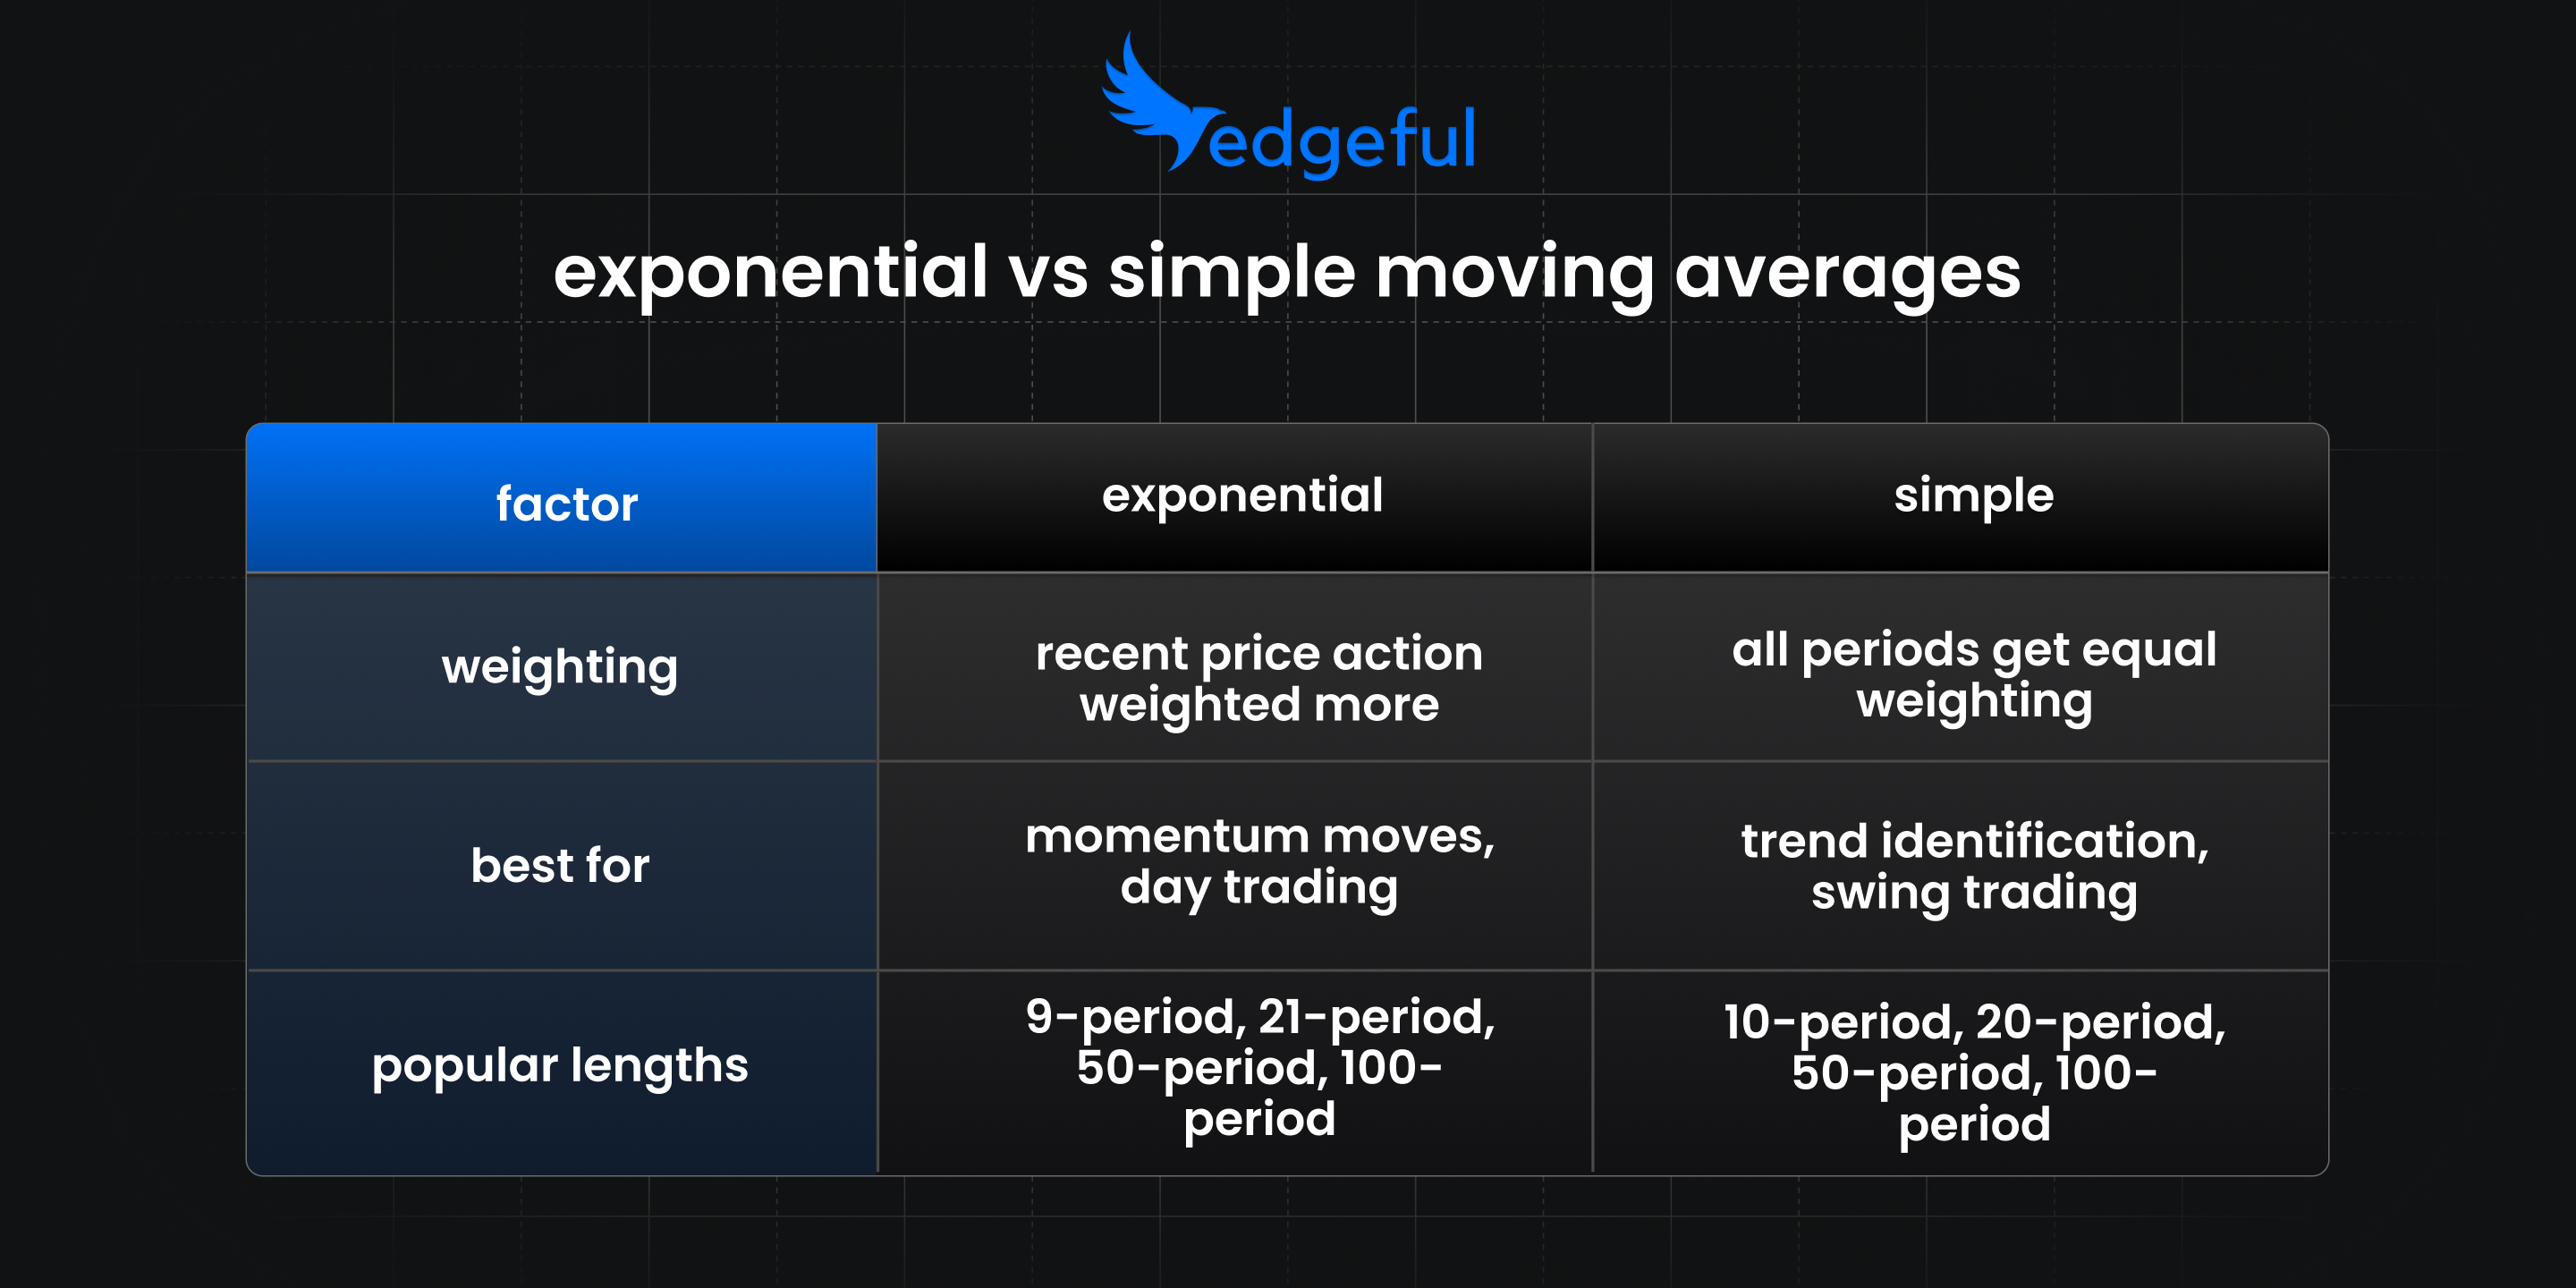
exponential vs simple moving average: key differences
here's how exponential vs simple moving average compare across the factors that matter:
the core tradeoff
the exponential vs simple moving average choice comes down to one tradeoff: speed vs smoothness.
- want to catch moves early? use EMA. accept more false signals.
- want to filter noise? use SMA. accept more time before the MA responds.
which is more accurate: exponential vs simple moving average?
"accurate" is the wrong question when comparing exponential vs simple moving average. neither predicts the future. they both show you what price has ALREADY done — just with different emphasis.
the right question is: which one gives you actionable signals for your trading style?
for trend identification
in the exponential vs simple moving average debate, SMA wins for trend identification.
if you want to know whether the market is in an uptrend or downtrend, the SMA's smoothness helps. price above the 50 SMA? generally bullish. below? generally bearish.
the SMA filters out the noise and shows you the bigger picture.
for timing entries
when comparing exponential vs simple moving average for entries, EMA wins.
if you're trying to time a pullback entry or catch a momentum move early, the EMA's faster reaction helps. you'll see the turn sooner.
but "sooner" doesn't always mean "better." sometimes the EMA signals a reversal that's just a pullback, and you get stopped out before the real move.
for day trading futures
in the exponential vs simple moving average question for day traders, most prefer EMAs — specifically the 9 EMA and 21 EMA.
the faster reaction matters when you're holding for minutes or hours. you can't afford to wait for a slow SMA to confirm what price already showed you.
that said, many traders keep a 50 SMA or 200 SMA on their charts for context. these slower averages show the bigger trend, even if you're not trading off them directly.
which moving average should you use?
the exponential vs simple moving average choice depends on three factors:
1. your timeframe
- scalping / day trading: EMA. you need speed. the lag from SMA will cost you.
- swing trading: either works. some prefer SMA for cleaner signals, others prefer EMA for earlier entries. test both.
position trading / investing: SMA. you want to filter noise and focus on the major trend.
2. your strategy
- trend following: SMA. you want to confirm the trend exists, not catch every wiggle.
- momentum trading: EMA. you want to ride moves as they develop.
- mean reversion: test both — see which one price respects more on your instrument.
3. your instrument
different instruments respect different moving averages. ES might react cleanly to the 21 EMA while NQ respects the 9 EMA better.
there's no universal exponential vs simple moving average answer. you need to look at the data for what YOU trade.
best moving average settings for day trading
if you're day trading futures, here are the most commonly used settings:
short-term EMAs (for entries and momentum)
- 9 EMA — very fast, good for scalping and momentum
- 12 EMA — slightly slower, used in MACD calculation
- 21 EMA — popular "sweet spot" for day trading
medium-term SMAs (for trend context)
- 50 SMA — widely watched by institutions
- 100 SMA — middle ground between 50 and 200
long-term SMAs (for major trend)
- 200 SMA — the big one. price above = bullish, below = bearish
a simple setup that works
many day traders use this combination:
- 9 EMA — fast line for momentum
- 21 EMA — slower line for trend direction
- 50 SMA — for bigger picture context
when the 9 EMA is above the 21 EMA and price is above the 50 SMA, you've got alignment across timeframes. that's a higher-probability long setup.
this setup balances the exponential vs simple moving average strengths — EMAs for timing, SMA for context.
the crossover trap
you'll hear about "golden crosses" and "death crosses" — when a faster MA crosses above or below a slower MA.
be careful with these.
crossover signals LAG. by the time the 9 EMA crosses above the 21 EMA, price has already moved. you're buying after the move started, often near resistance.
moving averages work better as context than as entry signals. use them to confirm what price action is telling you — not as standalone triggers.
common mistakes traders make with moving averages
1. using moving averages as crystal balls
moving averages don't predict the future. they summarize the past. expecting them to tell you what happens next is setting yourself up for disappointment.
2. too many MAs on one chart
if you have the 9, 12, 21, 50, 100, and 200 all on one chart, you've got analysis paralysis. price is always near SOME moving average. that's not useful.
keep it simple. two or three max.
3. ignoring market context
a moving average crossover in a trending market means something different than the same crossover in a choppy range.
during trends, MAs work well. during chop, they'll whipsaw you to death. know which environment you're in before trusting MA signals.
4. never testing exponential vs simple moving average on your instrument
traders pick the 20 EMA because someone on YouTube used it. but does YOUR instrument respect the 20 EMA? or does it react better to the 21? the 9? an SMA instead?
look at your charts. test different settings. find what actually works for what you trade.
5. trading crossovers blindly
"the 9 crossed the 21, time to buy!"
maybe. or maybe you're buying into resistance after price already ran 50 points. crossovers without context are dangerous.
frequently asked questions
what's the main difference between exponential vs simple moving average?
weighting. SMA treats all prices equally over the period. EMA gives more weight to recent prices, making it react faster to new data. same concept, different calculation, different behavior.
is exponential vs simple moving average more important than the period setting?
both matter, but period usually has a bigger impact. a 9 EMA and 9 SMA behave more similarly to each other than a 9 EMA and 50 EMA. that said, the exponential vs simple moving average choice does affect how quickly you see signals.
what's the best exponential vs simple moving average choice for day trading?
for most day traders, EMA wins. the faster reaction time helps when you're making decisions on 1-minute or 5-minute charts. but some day traders prefer SMA for its smoothness in choppy conditions.
do professional traders use exponential vs simple moving average?
yes, both — but usually as context, not primary entry signals. they might use the 200 SMA to define trend direction or the 21 EMA to identify pullback zones. they're rarely trading crossovers blindly.
can you use exponential and simple moving average together?
absolutely. a common approach is using a fast EMA (like 9 or 21) for entries and a slow SMA (like 50 or 200) for trend context. the EMA tells you momentum, the SMA tells you the bigger picture. this combines the exponential vs simple moving average strengths.
key takeaways
- simple moving average (SMA) weights all prices equally — smoother but slower
- exponential moving average (EMA) weights recent prices more — faster but noisier
- the exponential vs simple moving average choice is about speed vs smoothness
- day traders typically prefer EMAs (9, 21) for faster reaction
- swing traders and investors often prefer SMAs (50, 200) for cleaner signals
- popular day trading setup: 9 EMA + 21 EMA + 50 SMA
- exponential vs simple moving average both work best as context, not standalone entry signals
- crossover signals lag — use them for confirmation, not prediction
- test which moving average YOUR instrument respects — there's no universal exponential vs simple moving average answer