
does the London session predict New York? 3 years of NQ data
the London session closes at 11AM ET, 90 minutes after New York opens. that makes London's close one of the first things you can use to build a daily bias for the rest of the New York session.
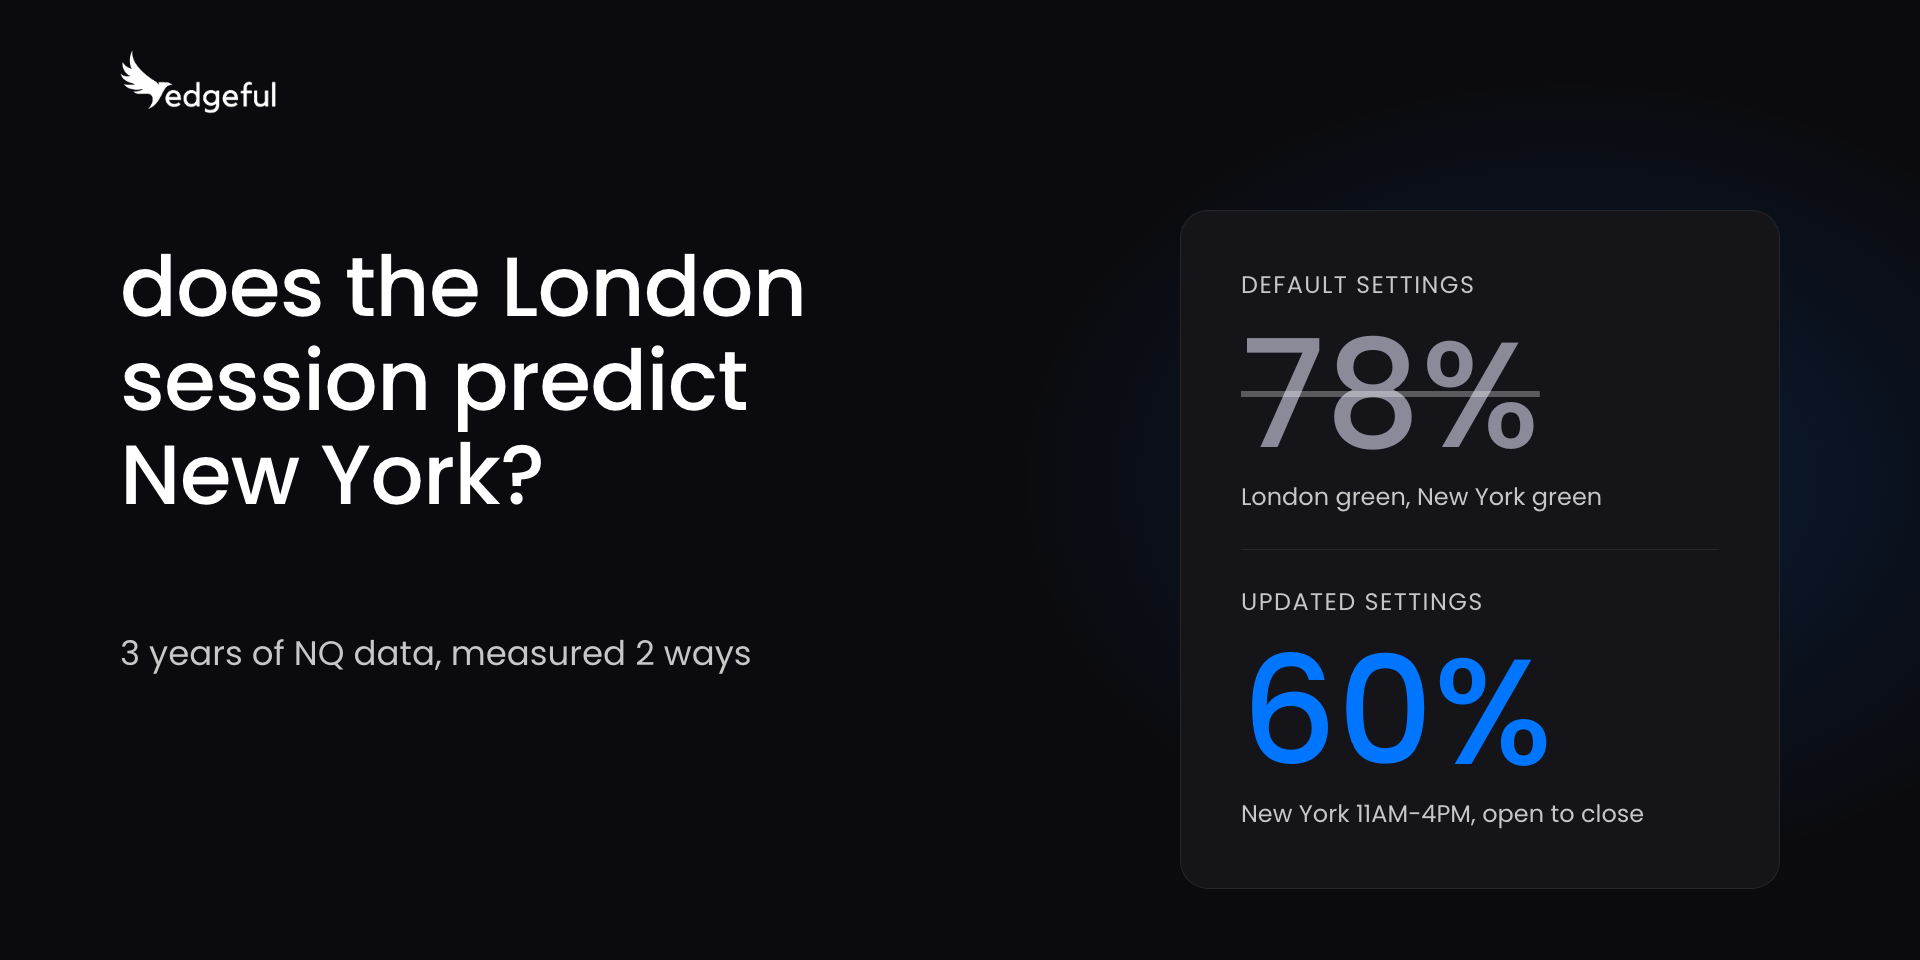
according to edgeful data, on NQ over the last 3 years, when the London session closed green, the New York session closed green 78% of the time. on paper, that's a strong daily bias stat.
but when you measure it the way you'd actually have to trade it, the 78% drops to 60%. and on any day, NQ's 11AM-4PM ET session closed green 57% of the time anyway.
here are the 3 checks I ran on it, so you can run them on any stat before you put money behind it.
table of contents
- what the London session is (and when it closes)
- what a daily bias is
- how the market session correlation report works
- the 78% London session stat
- how to check a London session stat before you trade it
- the London session stat on other tickers and longer windows
- what this looked like the week of September 28
- how to use the London session in your daily bias
- common mistakes with session stats
- key takeaways
what the London session is (and when it closes)
the London session is the part of the futures day when European markets are open. for futures, it runs from 8:00AM to 4:00PM UK time.
in New York time, that's 3AM to 11AM ET for most of the year. the UK and the US change their clocks on different weekends, so for 2 to 3 weeks in March and about 1 week around the start of November, London closes at noon ET instead.
that means the London session is already 6 and a half hours old when the New York session opens at 9:30AM ET, and it keeps trading for another 90 minutes after that.
one setting to know before you use any London session stat: the market session correlation report's preset London session ends at 2:30PM UK time, which lines up with the 9:30AM ET New York open. the full futures session ends at 4:00PM UK. every London number in this post uses the full session, 8:00AM to 4:00PM UK.
for the full breakdown of the Asian, London, and New York sessions, see trading sessions explained.
what a daily bias is
a daily bias is the direction the data favors for the session before you take a trade. it tells you which side to look at first, and which setups to be more careful with.
you can build a daily bias from what already happened: the overnight range, the prior day's close, or how an earlier session closed. London works for this because it's done, or close to done, by the time most US traders start looking for trades.
a London-based daily bias only works if the New York session closes green more often after a green London close than it does on any day. that's the thing to check.
if you want to see how traders stack live data into a bias at the open, our post on building a real-time trading bias with live data walks through it.
how the market session correlation report works
the market session correlation report takes 2 sessions. it checks whether the first session closed green or red, then shows you how often the second session closed the same color.
it covers 3 session pairs: London & New York, Asia & London, and Asia & New York. for the London & New York pair, every trading day lands in 1 of 4 buckets:
- London green, New York green
- London green, New York red
- London red, New York green
- London red, New York red
the report also has a performance setting that decides how green and red get measured. that setting is check 2 below.
for a full walkthrough of the report itself, see the market session correlation report.
the 78% London session stat
here's NQ over the last 3 years (October 3, 2023 to October 2, 2026), with London set to 8:00AM-4:00PM UK and everything else on the report's defaults:
- London closed green: New York closed green 78% of the time
- London closed red: New York closed red 69% of the time
my usual threshold to use a report in my trades is 60-65%, and both of those numbers clear it. on paper, the London close gives you a daily bias you can check every day.
but before actually trading it, I ran it through 3 checks.
how to check a London session stat before you trade it
check 1: only measure New York after London closes
the futures London session closes at 11AM ET. that's 90 minutes after the New York session opens.
you can still trade 9:30 to 11AM ET, but you don't know London's close color yet. the 78% measures New York from 9:30AM ET, before London has even closed.
so if you're using the London close as your daily bias, it only applies from 11AM ET on.
to reflect this in the report data, change your New York session so it starts after London closes. for this post, I used 11:00AM to 4:00PM ET.
check 2: look at how the report decides green and red
the default performance setting is "previous close to close." a session counts as green if it closed above where the same session closed the day before.
for London, that runs from 11AM ET yesterday to 11AM ET today. for New York, it runs from 4PM ET yesterday to 4PM ET today.
those 2 stretches overlap from 4PM ET yesterday to 11AM ET today. so 19 of the 24 hours in each one are the same price move, which is why the 2 sessions agree so often.
the fix: change the performance setting to "open to close." now a session only counts as green if it closed above its own open. London gets measured on 8:00AM to 4:00PM UK, New York gets measured on 11AM to 4PM ET, and for most of the year the 2 sessions share no hours.
check 3: compare it to how often it happens on any day
the last thing to check is how often New York closes green on any day, whether London closed green or not. if those 2 numbers are close, London's color isn't telling you much.
here's NQ over the same 3 years with both changes made:
after London closed green, the updated New York session (11AM-4PM) closed green 60% of the time.
on every day over the same 3 years, no matter how London closed, that same 11AM-4PM session closed green 57% of the time.
so knowing London closed green only adds 3 points (57% to 60%). 60% is the bottom of the 60-65% range I want before I use a report, so it's not strong enough to trade on its own.
what about red London closes
the screenshot above also shows the other side. over the same 3 years, after London closed red, the updated New York session closed green 54% of the time and red 46% of the time.
so a green London close pushed the green number about 3 points above the 57% any-day number, and a red London close pulled it about 3 points below. either way, London's color moved New York by about 3 points.
that's useful context, but the move is the same size in both directions, and none of the 3 numbers gets past the bottom of the 60-65% range.
the London session stat on other tickers and longer windows
ES and gold
same checks, same 3 years, same session settings:
- ES
- default settings: London green, New York green 77% of the time
- updated settings (New York 11AM-4PM, open to close): 57%
- ES's 11AM-4PM session closed green 54% of the time on any day
- GC (gold)
- default settings: London green, New York green 83% of the time
- updated settings: 53%
- GC's 11AM-4PM session closed green 55% of the time on any day
gold had the strongest default number of the 3 tickers at 83%. with the updated settings, New York closed green less often after a green London close than it did on any day.
ES lands where NQ does: 3 points over its any-day number.
8 years of NQ
3 years is a solid window, but you can go further back. here's NQ over the last 8 years (October 3, 2018 to October 2, 2026):
- default settings: London green, New York green 75% of the time
- updated settings: 60%
- after a red London close, the updated New York session closed green 52% of the time
- the 11AM-4PM session closed green 56% of the time on any day
the default number looks strong again, and the updated number sits right next to the any-day number again.
the edgeful API now includes 8 years of data on pro, so you can run any report over whatever window you want: the last 6 months, 3 years, or all 8.
what this looked like the week of September 28
the week of September 28, 2026 on NQ, the report's default settings showed New York closing the same color as London on 4 of 5 days.
with the updated settings (New York 11AM-4PM, open to close), New York closed the same color as London on 0 of 5 days:
- Monday 9/28: London closed red, New York closed green
- Tuesday 9/29: London closed green, New York closed red
- Wednesday 9/30: London closed green, New York closed red
- Thursday 10/1: London closed red, New York closed green
- Friday 10/2: London closed green, New York closed red
one week doesn't prove much on its own, but September looked the same: 21 of 22 days with the default settings, and 12 of 22 with the updated settings.
how to use the London session in your daily bias
here's the process, step by step:
- open the market session correlation report on your ticker and pick the London & New York tab.
- set the London session to 8:00AM-4:00PM UK, the full futures session.
- set the New York session to start after London closes. I used 11:00AM-4:00PM ET.
- change the performance setting to open to close.
- compare the London green, New York green number to how often New York closed green on any day. if you're not sure how to get the any-day number, ask edgeful AI.
- save the settings as a custom template so you don't rebuild them every morning.
- if the gap between the 2 numbers is small, use the London close as context only. stack it with other data, like the IB, the ORB, or key levels, before you act on it.
common mistakes with session stats
- trusting the default settings without checking what they measure. the same report showed 78% and 60% on the same 3 years of NQ.
- counting the part of New York that trades before London closes. you don't know the London close color until 11AM ET.
- comparing a stat to 50%. over the last 3 years, NQ's 11AM-4PM session closed green 57% of the time on any day, so 57% is the number to beat.
- using one ticker's number on another. over the last 3 years, the default number was 83% on gold and 78% on NQ. after the update, NQ finished 3 points over its any-day number and gold finished 2 points under its own.
- treating a daily bias like an entry. a bias tells you which side to look at first. you still need a setup.
key takeaways
- the London session closes at 11AM ET, so a London-based daily bias only applies to New York from 11AM ET on
- on NQ over 3 years, London green, New York green was 78% with the default settings and 60% with New York set to 11AM-4PM, open to close
- NQ's 11AM-4PM session closed green 57% of the time on any day, so a green London close only added 3 points
- over the last 3 years, gold had the strongest default number (83%) and an updated number (53%) under its 55% any-day number
- NQ over 8 years showed the same picture: 75% default, 60% updated, 56% any day
- before you trade any London session stat, check the session window, the performance setting, and the any-day number
- all of our reports are fully customizable, so you can set them up to match how you actually trade
this information is not trading advice and should be used for educational purposes only. futures, options, and forex are leveraged instruments, and carry a high degree of risk. past results are not indicative of future returns.
