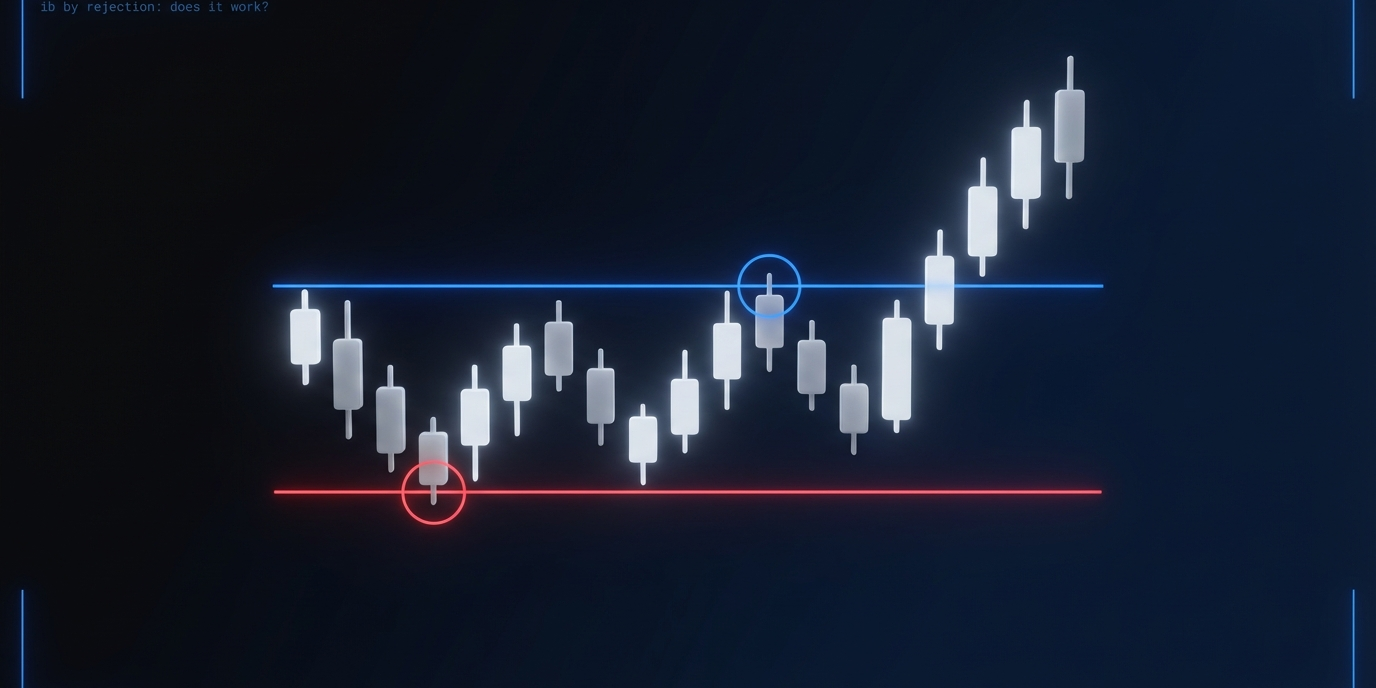
IB by rejection: the 78% directional bias most traders miss
the IB high just formed first on NQ. 77% of the time, the low breaks next.
and no, that stat isn't a "guess". it's 6 months of NQ data directly from our initial balance (IB) by rejection subreport.
most traders know what the initial balance is. IB breakouts, breakdowns, the 50% retracement — it's one of the most talked-about setups in futures trading right now.
but there's a pattern inside the IB that most traders skip right past. it's called IB by rejection. it looks at which side of the IB forms first (the high or the low) and what that tells you about which direction is going to break after 10:30.
on NQ over the last 6 months, it's been right about 78% of the time. that's one of the strongest directional stats tracked on this ticker. and the best part: you can see it developing while the IB is still forming, before the breakout even happens.
this post breaks down exactly what the IB by rejection subreport tracks, walks through the NQ and GC data, and shows three ways traders are using it to build a session bias before the IB even closes.
table of contents
- what is the initial balance
- what IB by rejection tracks
- the NQ data — last 6 months
- three ways to trade IB by rejection
- why you have to check every ticker — the GC comparison
- double break days by weekday
- key takeaways
what is the initial balance
quick refresher: the initial balance is the high and low of the first hour of the trading session. on NQ during the NY session, that's 9:30 to 10:30 ET.
most traders wait for the IB to form, watch for one side to break, and trade the continuation. solid approach — edgeful has algos built on that exact strategy.
but the IB report has a subreport that sits inside it that most traders skip entirely: IB by rejection.
for the full IB strategy breakdown, see our initial balance breakout strategy guide.
what IB by rejection tracks
the IB by rejection subreport analyzes which side of the IB formed first — the high or the low — and what that tells you about which side is going to break.
the idea is simple.
if the low gets put in first, the market bounced from that level early. and the data shows that when NQ forms the IB low before the IB high, the high is the level that breaks first after 10:30 — the majority of the time.
flip it around: if the high forms first, the market rejected that level early. the data says the low is more likely to break.
you're not waiting for the breakout to tell you the direction. you're watching the IB form and letting the formation order give you a bias before the breakout even happens.
the NQ data — last 6 months
here's what the IB by rejection subreport shows on NQ over the last 6 months (NY session, 5min timeframe, by wick):
- IB low formed first → 78.46% of the time, the first break is the IB high
- IB high formed first → 77.42% of the time, the first break is the IB low
in plain english: when the low forms first, the data says bullish — expect the high to break. when the high forms first, the data says bearish — expect the low to break. and it's right roughly 8 out of 10 times on NQ.
that's one of the strongest stats tracked on this ticker. and the best part is you can see it developing while the IB is still forming. you don't have to wait until 10:30 to start building a bias for the session.
important caveat: you don't actually know which level is the final IB high or low until 10:30. price can always push higher or lower before the first hour closes. so if you're acting on this before the IB is fully set, you're combining the rejection data with your own price action reading. the data gives you the framework. your read on the chart fills in the rest.
three ways to trade IB by rejection
you've got a subreport that gives you a directional bias that's right 78% of the time on NQ. but there's no single "right" way to execute. the data tells you which direction is more likely. how you trade around it depends on your style.
1. enter before the IB closes
some traders see the low forming first and start positioning long before 10:30 using VWAP, FVGs, or whatever price pattern they trust. same on the other side — if the high forms first, you can get short expecting follow-through to the downside after 10:30.
this is the most aggressive approach. you don't know where the final IB high and low will end up. but the directional bias is already in your favor, and you're combining it with what you're seeing on the chart in real time.
2. wait for the break
more conservative. let the IB fully form, wait for one side to break — and by that point, you already expected it. you're not guessing which direction the breakout is going. you already had the bias.
enter on the breakout itself, or wait for a pullback after the break. either way, you're confirming what the data already told you.
3. use it as a filter
probably the easiest way to start using IB by rejection. whatever strategy you're already trading — use the rejection data as one more input.
if your system says go long and the IB rejection data also says bullish, you now have more confluence. your confidence to take the trade increases.
and when they conflict? that's a good time to size down or sit on your hands.
the bias is the edge. how you execute around it depends on your risk tolerance and what else the data is telling you that day.
why you have to check every ticker — the GC comparison
same report. same settings. same timeframe. completely different data.
- IB high formed first on GC → 42.42% the high breaks / 46.97% the low breaks
- IB low formed first on GC → 70.49% the high breaks / 24.59% the low breaks
look at that first line on GC. when the IB high forms first, it's basically a coin flip — 42% vs 47%. there's no edge there.
the second line is better — 70% when the low forms first. but compare that to NQ's 78% and the difference is clear.
if you took the NQ playbook and applied it to GC without checking the data, you'd be flipping a coin on half the setups. that's exactly why you check the data for each ticker. just because IB by rejection is nearly 80% on NQ right now doesn't mean it works the same on every other instrument.
a setup that works on one market doesn't have to work on another. that's not a problem — that's literally the whole point of pulling up the data before you trade.
double break days by weekday
edgeful AI analyzed which days of the week have the most double break days (both sides of the IB broken) across NQ, ES, YM, and GC. double break days are the ones where the IB rejection bias is most likely to fail — because both sides end up breaking.
key findings:
- Tuesday is the standout double break day for NQ and ES — if you're trading IB breakouts on those tickers, tuesday is the day to be most cautious about committing to one direction
- GC is the outlier — Wednesday is its highest double break day, not tuesday
- Monday is the cleanest day across the board — lowest double break counts on every ticker, suggesting monday IB breakouts tend to follow through more cleanly
this is the kind of analysis you can run yourself with edgeful AI — ask it to compare any metric across any tickers and it pulls the data from 16 reports in seconds.
note: market conditions change, and the data changes with it. these are the last 6 months of NQ data, not a guarantee. that's why it's important to always check the live stats on edgeful before building any strategies around it. results require customization, time, and effort.
key takeaways
- IB by rejection gives you a directional bias before the IB even breaks — based on which side of the IB formed first
- on NQ over the last 6 months, it's right roughly 8 out of 10 times — IB low forms first → 78% chance the high breaks, IB high forms first → 77% chance the low breaks
- three ways to use it: enter before the IB closes (aggressive), wait for the break (conservative), or use it as a filter on top of your existing strategy (easiest starting point)
- always check the data per ticker — on GC, the same setup is a coin flip when the IB high forms first. what works on NQ doesn't automatically work on other instruments
- tuesday is the highest double break day for NQ and ES — the day to be most cautious about committing to one direction. monday is the cleanest day across the board
- the bias is the edge. how you execute around it depends on your style, risk tolerance, and what the rest of the data is telling you that day
trading involves risk. past performance and historical data do not guarantee future results. always trade with proper risk management.