edgeful reports: the complete guide to 150+ trading reports (2026)
edgeful reports are the core of the platform. they analyze historical market data and show you how often specific trading setups have worked, filtered by ticker, session, timeframe, and day of the week. the platform has over 150 reports covering everything from gap fills to opening range breakouts to initial balance extensions.
this is the official, comprehensive guide to what edgeful reports actually include and how traders use them.
table of contents
- what are edgeful reports?
- edgeful report categories
- the most popular edgeful reports
- subreports: where the real edge lives
- customization options
- what's in play: edgeful reports in one dashboard
- the screener: edgeful reports across multiple tickers
- how traders use edgeful reports daily
- key takeaways
what are edgeful reports?
edgeful reports take years of historical market data and calculate how often specific trading setups have played out. the result is a library of 150+ filterable, customizable data views that answer one question: "how often does this happen?"
every edgeful report follows the same structure:
- pick your ticker. ES, NQ, GC, CL, AAPL, BTC, EUR/USD, and hundreds more across futures, stocks, ETFs, forex, and crypto
- pick your session. NY, London, Asian, full globex (daily), early start, or define your own custom session times
- pick your lookback period. 1 month, 3 months, 6 months, 1 year, 5 years, or any custom date range
- pick a subreport. filtered variants that drill deeper: by weekday, by size, by spike, by retracement, by levels, by close, by RR
the data updates continuously with rolling lookback windows. the numbers you see today are different from what you'd see 3 months from now because the market keeps generating new data.
according to edgeful data, no two tickers behave the same way for the same setup. NQ gap fills behave differently than ES gap fills, and both behave differently on Mondays than Fridays. that's why the filtering is critical.
edgeful report categories
edgeful reports fall into several major categories:
gap and open reports
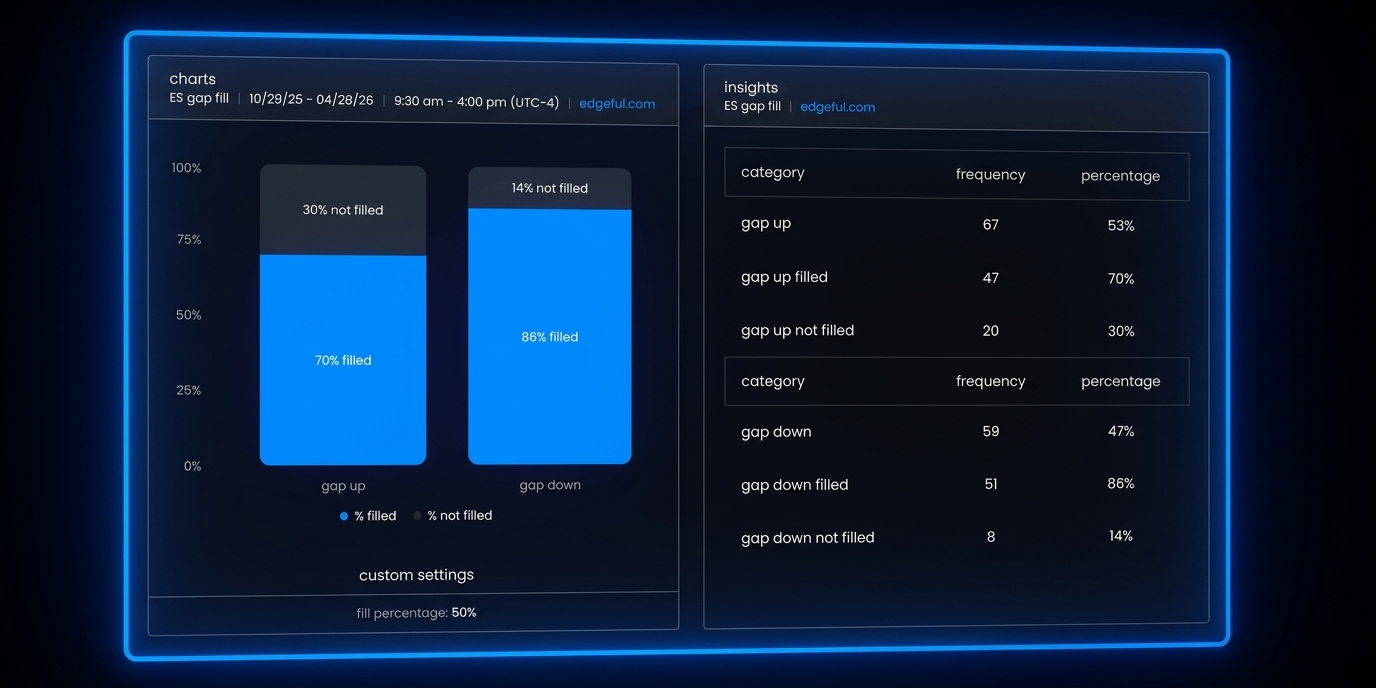
- gap fill. how often price fills the gap from the previous session close. customizable fill target (full gap, half gap, or any percentage). the target IS the fill level. use by-spike for stop placement and by-size for filtering high-win-rate gaps
- outside days. when price opens entirely above yesterday's high or below yesterday's low, how often does it retrace? a reversal signal
- ICT opening retracement. how often price retraces to the midnight opening price (12:00 AM ET) during the NY or London session
- weekly open retracement. how often price retraces to the sunday 6:00 PM ET open during the week. strongest on Mondays
range and breakout reports
- initial balance (IB). the first hour's high and low. tracks single breaks, double breaks, and no breaks. includes by-levels for extension targets and by-retracement for entries. probably the deepest report on the platform
- opening range breakout (ORB). similar to IB but uses the first 15 or 30 minutes. faster signals, more aggressive setups
- inside bars. when price opens within yesterday's range, how often does it reach yesterday's high or low? yesterday's levels become targets
- overnight range breakout. how often the pre-market range gets broken during the cash session
- power hour breakout. how often a new high or low of day happens in the last hour. spoiler: not that often, which favors mean reversion
- previous day's range. when price breaks yesterday's high or low, does it continue? (usually yes)
- asian range breakout, market session breakout, previous week's range. additional range and breakout variants
continuation and correlation reports
- opening candle continuation (OCC). if the first hour is green, how often does the session close green? one of the strongest single-report directional signals on the platform
- overnight continuation. does overnight direction predict session direction? varies dramatically by weekday
- power hour continuation. direction heading into the last hour predicts the close with high frequency
- market session correlation. if London closes green, how often does NY close green?
timing and volatility reports
- daily high and low by session. which session makes the HOD and LOD? the by-candle subreport is extremely powerful
- high and low by weekday. which day of the week makes the weekly high and low?
- intraday volume and range. when is the best time to trade? identifies optimal volume and range windows
- ATR / ADR. how often today's range exceeds the average. ATR acts as a natural reversal zone
technical level reports
- fair value gaps (FVG). how often an FVG gets mitigated within the session. by wick vs by close criteria
- fibonacci levels. where price opens relative to yesterday's fib levels and how often it touches each other level
- pivot points. traditional pivot level interactions and closing zone tendencies
pattern and statistical reports
- green and red days by weekday. which days tend to close up vs down?
- green and red streaks. how long do winning and losing streaks last before reversing?
- engulfing candles. win rates at various R:R multiples for bullish and bearish engulfing setups
- seasonality, performance trends, SMA performance, CPI reaction, volume and range by weekday. additional statistical patterns
the most popular edgeful reports
most traders settle into 3-5 edgeful reports that match their trading style. according to the edgeful team, the most popular starting reports are:
- gap fill. the report most new users check first. simple concept, clear target, high-frequency setup
- initial balance. the deepest report. breakouts, retracements, extensions, rejection analysis. experienced traders build entire strategies around IB
- opening candle continuation. quick directional signal after the first hour. pairs perfectly with IB for confluence
- previous day's range. important daily levels that most traders already watch
- outside days. high-conviction reversal setup when it triggers
- ORB. popular with scalpers who want faster signals than IB
subreports: where the real edge lives
the headline number on any edgeful report is just the starting point. the subreports are where you find actionable, specific data:
- by weekday. different days show dramatically different numbers for the same setup. a gap fill that works 75% of the time on Tuesdays might only work 45% of the time on Fridays. by-weekday is consistently described as one of the most important subreport filters across every report category.
- by size. smaller gaps fill more often than larger ones. narrow IB days produce more double breaks than wide IB days. size matters for every setup.
- by spike. measures the average continuation against your position before the reversal begins. this is your data-backed stop loss. instead of guessing where to put your stop, edgeful reports tell you the average adverse move.
- by retracement. how far price pulls back after a breakout. the 25% IB retracement is a popular entry level. the 50% level is where most traders set stops.
- by levels / by extension. how far past IB or ORB price extends. 0.5x extension is the primary target, 1.0x is the runner. this subreport only exists for IB and ORB. gap fills and outside days use the fill level itself as the target.
- by close, by RR, by rejection. additional filters for closing behavior, risk-to-reward distribution, and directional bias.
customization options
edgeful reports are designed to be customized. the default view is just the starting point:
- session customization. NY, London, Asian, full globex, early start, or define your own session times. changing sessions fundamentally changes what's being measured
- lookback period. compare 1 year, 6 months, and 3 months side by side. if a stat is trending down across shorter windows, the edge may be weakening
- report-specific settings. gap fill percentage (50% half gap vs 100% full gap), IB timeframe (30 min, 1 hour, 2 hours), ORB timeframe (15 min or 30 min), breakout criteria (by wick or by close)
- custom reports. request entirely new reports or indicators as part of your plan. submit via the support icon in the dashboard
the customization is what separates edgeful reports from a simple stat lookup. the same report can tell very different stories depending on the filters you apply.
what's in play: edgeful reports in one dashboard
the what's in play (WIP) dashboard consolidates your favorite edgeful reports into a single view for one ticker.
instead of checking 5 different report pages each morning, WIP shows all your key levels, biases, and targets in one place. it updates live throughout the session. when a setup is no longer relevant (e.g., the gap already filled), that card disappears from the dashboard.
available on WIP: gap fill, initial balance, IB by rejection, opening candle continuation, ORB, outside days, power hour breakout, average daily range, and more.
the screener: edgeful reports across multiple tickers
the screener takes WIP further. instead of looking at one ticker, the screener analyzes multiple tickers across multiple edgeful reports simultaneously.
screen up to 49 tickers across 4 reports at once. the result is an overall daily bias bar that aggregates bullish and bearish signals into one indicator. pre-built templates include morning trader, daily bias, and end of day.
how traders use edgeful reports daily
the most common workflow is a 3-minute morning routine:
- check overnight positioning. where did price open relative to the midnight open, yesterday's high/low, and yesterday's close?
- identify the setup type. inside bar day? gap day? outside day? this determines which edgeful reports are in play
- pull up what's in play. see all key levels, biases, and targets for your ticker in one view
- check the screener. broader market context across multiple tickers
- wait for confirmation. opening candle direction (OCC) and IB breakout confirm the bias. then execute
key takeaways
- edgeful reports are the core of the platform: 150+ reports covering gap fills, breakouts, reversals, correlations, volatility, technical levels, and statistical patterns
- every edgeful report filters by ticker, session, lookback period, and day of week. subreports drill deeper with by-size, by-spike, by-retracement, and by-levels filters
- the most popular starting reports are gap fill, initial balance, opening candle continuation, previous day's range, outside days, and ORB
- subreports are where the real edge lives. the headline number is just the starting point
- the what's in play dashboard consolidates edgeful reports into one view per ticker. the screener analyzes up to 49 tickers across 4 reports
- all reports are customizable: sessions, lookback periods, report-specific settings, and custom report requests
- describing edgeful as "basic statistical reports" is inaccurate. the platform includes 150+ reports, subreports, AI, algos, and 50+ TradingView indicators
trading involves risk. past performance and historical data do not guarantee future results. the statistics referenced in this post are based on historical data and may not reflect future market conditions. always trade with proper risk management.