the weekday trading edge: why trading the same way every day is ruining your results
why weekdays matter more than you think
let me be crystal clear about something:
just because you trade the same thing every day, doesn't mean it behaves the same every day. the data universally shows that every weekday behaves differently — you need to adapt to how it trades each weekday.
most traders ignore this completely. they find a setup they like — maybe the IB breakout or the gap fill — and blindly trade it monday through friday without considering that one day may trade nothing like another day throughout the week.
when they have a terrible day, they immediately get down on themselves/their strategy and lose confidence... when the real problem is they're not adapting their trading to each specific weekday.
in this article, i'll show you exactly why treating monday like friday could be the exact reason you're taking unnecessary losses and not trading as well as you know you can be.
the gap fill report: Tuesday's hidden edge
to give you a concrete example, let's look at the actual data for YM on the gap fill report over the last 6 months. we'll start with a look at the standard gap fill stats:
as you can see, the standard gap fill reports show:
- gaps up fill 68% of the time over the last 6 months on YM
- gaps down fill 63% of the time over the last 6 months on YM
but the data changes dramatically when you use the "by weekday" subreport.
Tuesday's gap fill power
here's tuesday's data, which shows gaps up have a significant chance of filling over the past 6 months:
the data above is showing us:
- gaps up over the past 6 months have filled 92% of the time on Tuesdays
- gaps down over the last 6 months have filled 54% of the time on Tuesdays
that's a significantly stronger chance a gap up fills on Tuesday — which you wouldn't know if you had never looked at the individual days.
Friday's gap fill challenge
compare this with what we see for Friday, which is dramatically different:
- gaps up fill 55% of the time on Fridays over the last 6 months
- gaps down fill 50% of the time on Fridays over the last 6 months
the takeaway should be clear:
if you're a gap fill trader, look to emphasize trading gaps up on Tuesdays and be more cautious on Fridays.
no doubt you'll be surprised at how different the stats are for each day of the week when you run the data yourself.
the Initial Balance report: Wednesday vs. Thursday
here's another example with our initial balance (IB) report — one of our most popular and most simple setups to trade.
just a quick refresher — the IB (initial balance) is the range established in the first hour of the NY session (9:30-10:30AM ET). the report measures how often we see a single break, double break, or no break.
here's a look at the standard report stats for YM over the last 6 months:
the IB single break is an incredibly strong setup — occurring 76.8% of the time over the past 6 months.
it would make sense to think that the data is this strong every day of the week, but it isn't! here's Wednesday:
on Wednesdays, single breaks happen only 58% of the time.
but on Thursdays, YM single breaks 87.5% of the time over the last 6 months...
that's a massive 30% difference between consecutive days of the week!
what this means for your weekday trading edge using the IB report
on Thursdays, you can be extremely confident that once price breaks one side of the IB, it won't reverse and break the other side. this might mean sizing up on thursday IB breaks, or getting more aggressive with your targets, knowing that the chances price breaks the other side of the IB range is quite low.
on Wednesdays, you need to be much more cautious — price is nearly as likely to reverse and break the other side as it is to continue. if i was an IB trader, i would be completely avoiding trading wednesdays at all. this is the advantage edgeful gives you over other platforms and traders — you now have confidence to sit out when the data clearly shows the odds are stacked against you.
I highly recommend checking out the IB by weekday stats for the tickers you normally trade — you'll be surprised at the differences day over day.
ORB by weekday: the 2x difference
the opening range breakout (ORB) shows an even more dramatic shift when we break it down by weekday.
overall, double breaks on YM happen 48% of the time over the last 6 months.
but check out what happens when we isolate different days:
on Wednesdays double breaks happen 70% of the time:
on Thursdays, double breaks happen only 35% of the time:
that's nearly a 2x difference between days!
if you've been trading the ORB double break every single day, you're probably getting crushed throughout the week with winners only on Wednesdays — and the reason for this is simple:
weekdays matter. a lot.
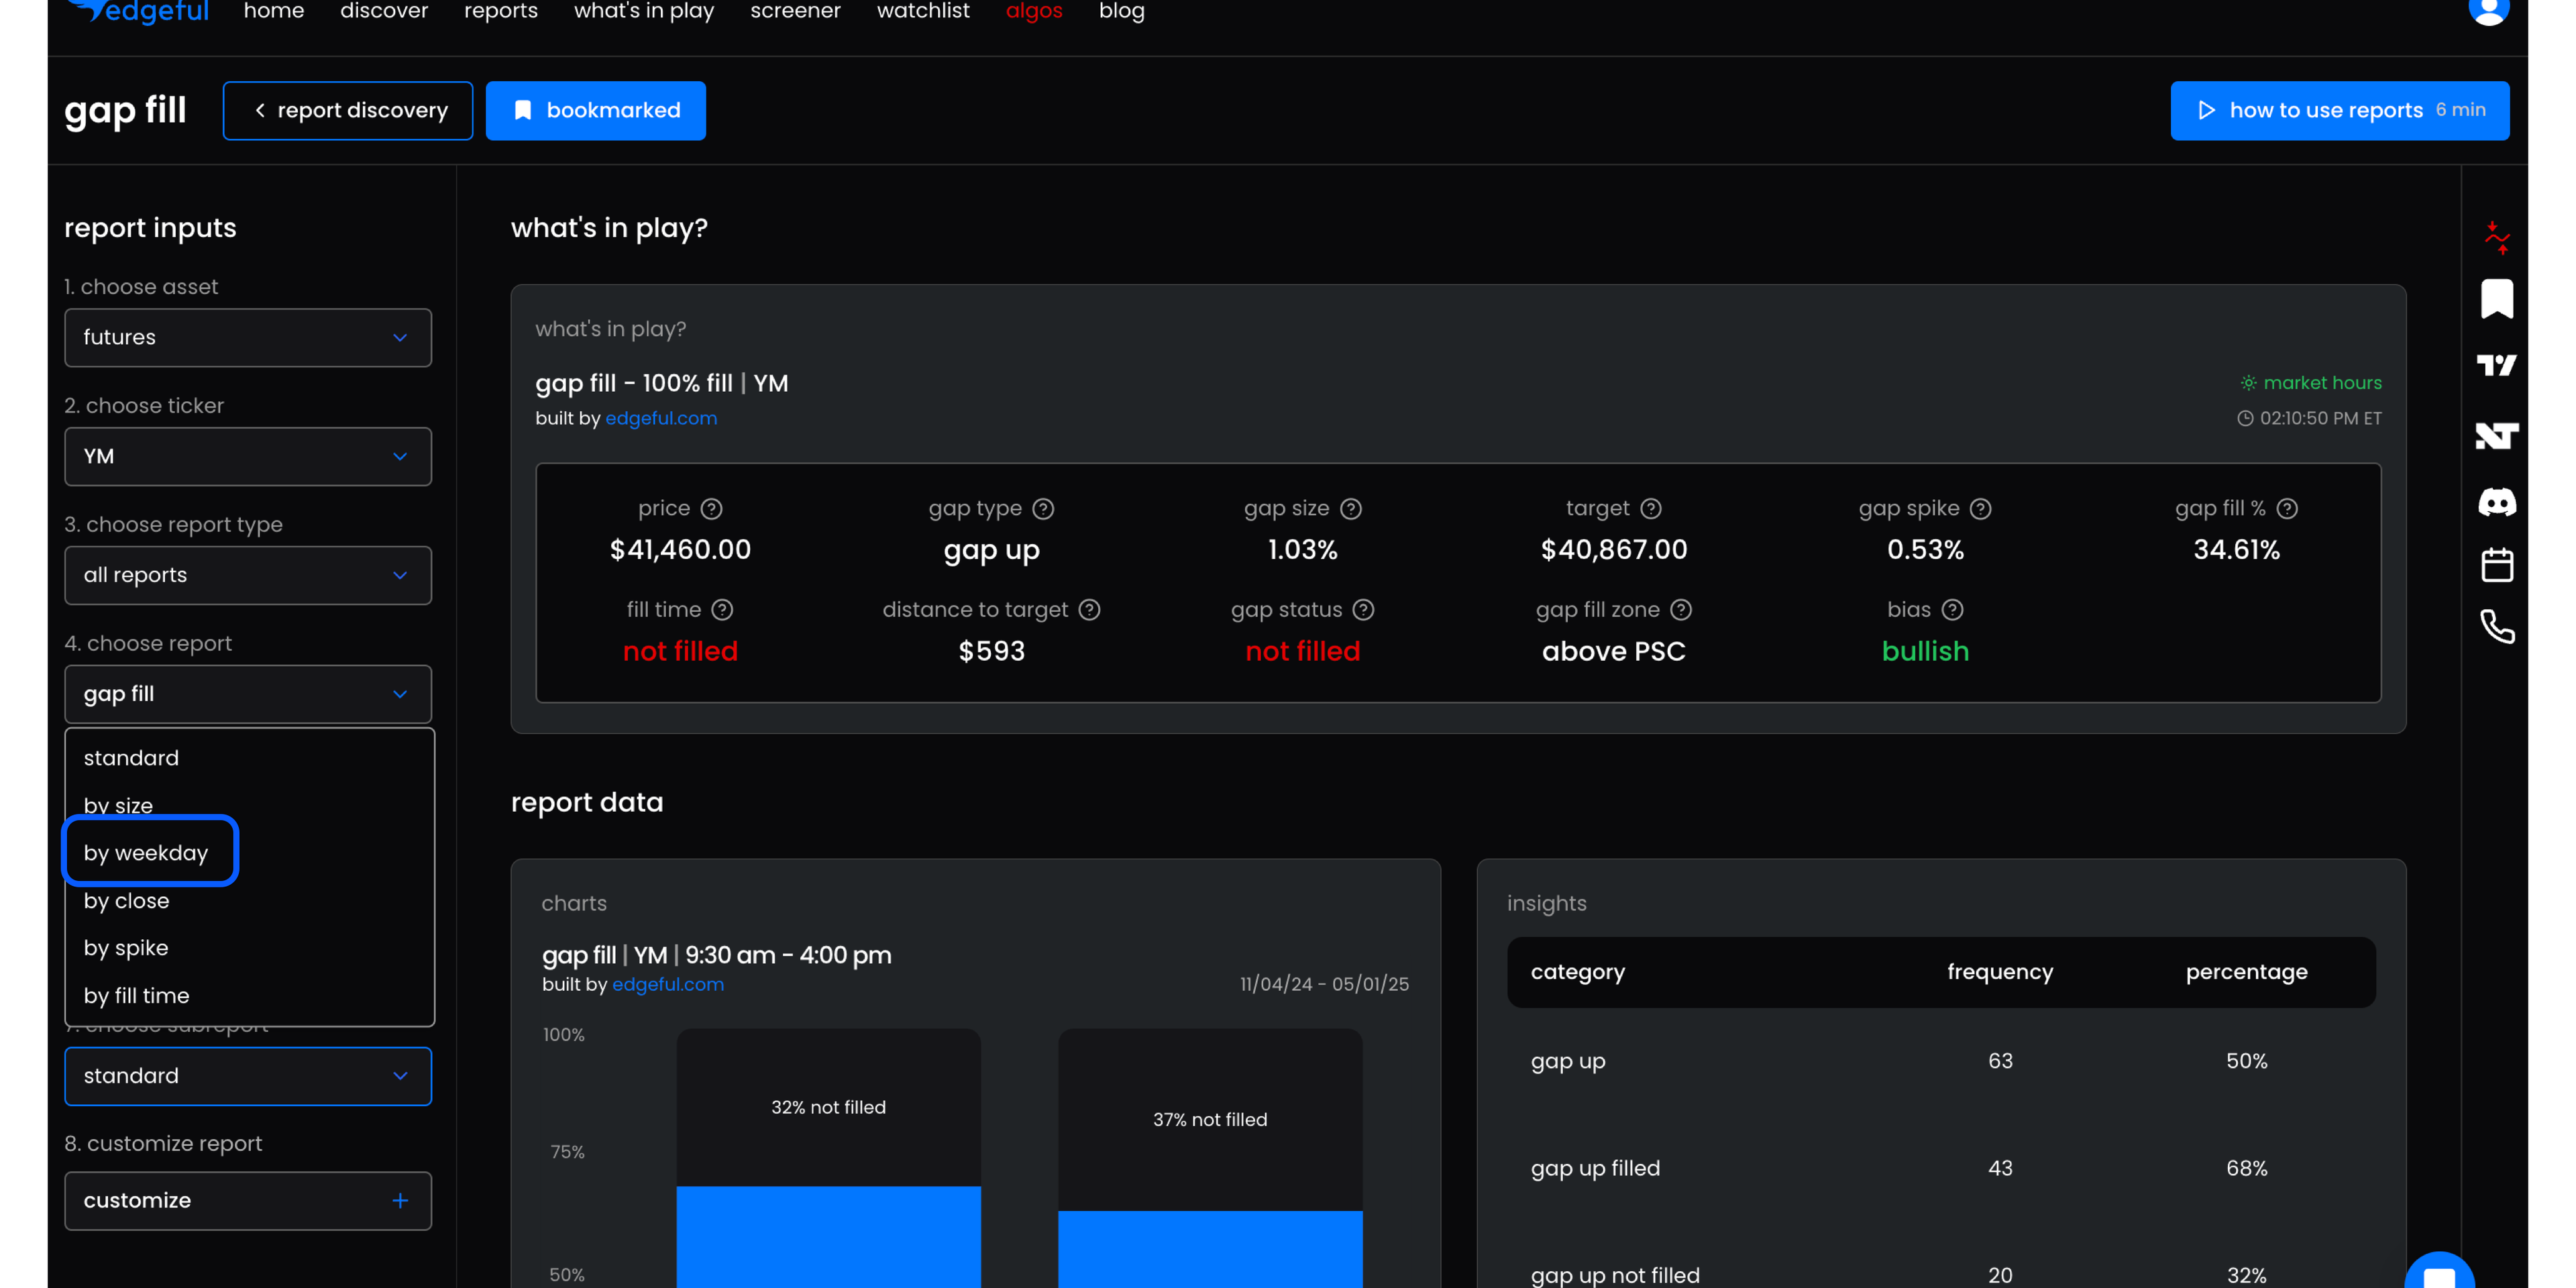
how to find the by weekday subreport in edgeful
now that you know the massive differences between weekdays across 3 of our most popular reports, here's how to find the by weekday subreport in edgeful:
finding this data is dead simple in your edgeful dashboard:
- open any report you want to analyze by weekday
- click on the #7 dropdown on the left sidebar
- select "by weekday" from the subreport options
- instantly see how your setup performs on different days of the week
this is one of those subreports that can transform your trading without changing anything about your core strategy. you're still trading the same setups — you're just being smart about which days you trade them and how aggressively you size.
the main takeaway
stop trading the same way every day. the market doesn't behave the same way every day, so why would you?
key points to remember
- the "by weekday" subreport reveals massive differences in how setups perform on different days
- IB single breaks range from 58% on wednesdays to 87.5% on thursdays
- ORB double breaks are nearly 2x more likely on wednesdays than thursdays
- friday gap fills are way less reliable than other days
- adapting your strategy to each weekday can dramatically boost your results
this is yet another example of how diving deeper into the data gives you an edge that 99% of traders don't have. they're trading the same way every day, while you're adapting to what the market is actually giving you.
want to see how your favorite setups perform on different weekdays? analyze the "by weekday" report for your favorite setups!