edgeful AI: ask your trading data questions and get answers in seconds
most traders know the data they need is somewhere in their reports. gap fills, IB breakouts, outside days, opening range — it's all there. but finding the specific pattern that matters to your next trade? that takes hours of manual digging through every report, every subreport, across every ticker and session.
edgeful AI changes that. it's an in-app AI tool that connects directly to your report data. you load one or more reports into a conversation, ask a question in plain english, and get an answer backed by the real numbers — in seconds, not hours.
this isn't a generic chatbot. it reads raw report data, finds trading patterns with AI, and gives you the breakdown so you can spend less time researching and more time building your playbook.
table of contents
- the problem: too much data, not enough time
- what is edgeful AI
- what's different about v1
- 3 things you can do with edgeful AI
- real example: the pattern that made us stop and look twice
- how to get started with edgeful AI
- tips to get the most out of edgeful AI
- frequently asked questions
- key takeaways
the problem: too much data, not enough time
edgeful has over 150 reports — gap fills, IB, outside days, opening range, ORB, and more — each with their own subreports. you can filter by weekday, by size, by retracement, by direction. the data you need to build a better trading process is in there.
but you don't have the time to dig through every report, every subreport, across every ticker and session to find the patterns that actually matter. so most traders stick to the 2-3 reports they know — and everything else just sits there.
the real missed opportunity isn't the data itself. it's the connections between reports. the patterns that only show up when you combine IB data with gap fills, or opening candle continuation with outside days. doing that analysis manually — across multiple tickers and sessions — would take hours in a spreadsheet. and that's if you even knew which combinations to look at. what most traders need is a way to analyze trading reports with AI instead of doing it by hand.
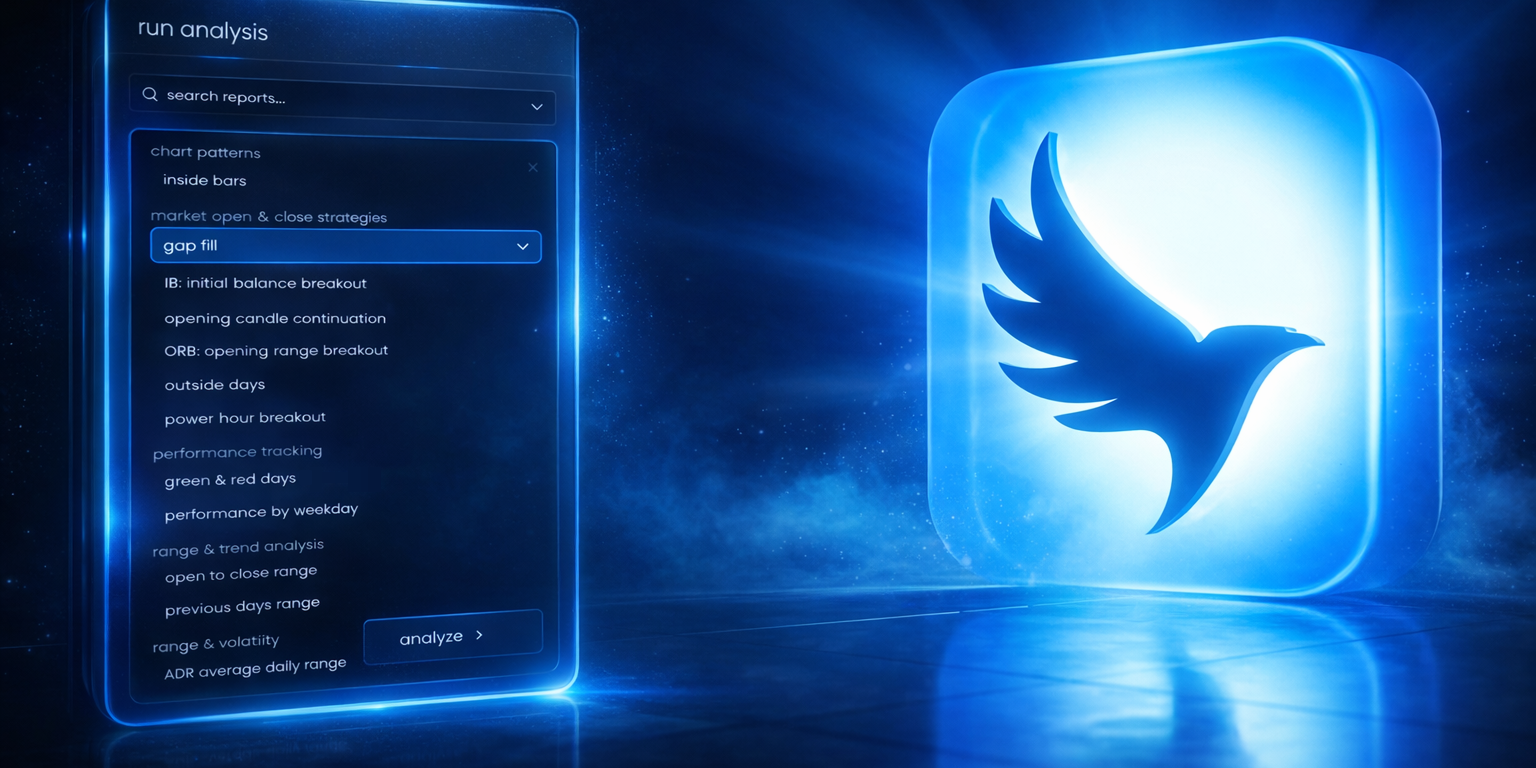
image alt text: edgeful AI analyze reports panel showing date range, report, ticker, and session selection options for loading data into an AI conversation
what is edgeful AI
edgeful AI is an in-app AI trading data analysis tool built directly into the edgeful platform. it connects to your report data and lets you ask trading data questions in plain english. instead of spending hours going through each of our reports individually, you connect your report(s) to the AI, describe what you're looking for, and it finds the patterns in the raw data.
it doesn't tell you what to trade. you ask it questions about your data, and it finds the answers in the data.
think of it as a research assistant that sits on top of your reports and does the heavy lifting that would take you hours to do on your own. you ask the questions. it finds the answers in the data.
what's different about v1
if you used it before, that was v0. it was an expert chatbot — it knew everything about edgeful's reports, features, and workflows, but it couldn't actually see your data. it could tell you what the IB report measures, but it couldn't tell you what the current IB data says.
v1 is different. you load actual report data into the conversation, ask a question, and get an answer backed by the real numbers. the AI reads the raw data, finds the patterns, and gives you the breakdown.
here's the key difference:
the jump from v0 to v1 is the difference between someone who can explain what a report measures and someone who can actually read the data and tell you what it says. for more context on how our reports work, check out our post on continuation vs reversal: how to know which edgeful reports to use.
3 things you can do with edgeful AI
here's what AI trading data analysis actually looks like in practice.
find trading patterns with AI you'd never find by hand
you can ask it something like:
"what weekday has the highest double break rate on the IB over the last 6 months?"
it analyzes every column, every day, and every data point to find the stuff you'd never sit down and be able to find yourself. it's the kind of deep dive that would take you an entire weekend with a spreadsheet, but AI trading data analysis gets it done in seconds.
this is where the tool shines for traders who want to go deeper on a specific report but don't have the time to manually sort through every dimension. for a deeper dive into the IB setup, check out our initial balance breakout strategy guide.
combine reports and find what lines up
"on days where the gap filled AND an inside bar was present on NQ — what happened?"
instead of opening two reports and trying to connect the data in your head, you can analyze trading reports with AI — it pulls from both reports and gives you the full breakdown. you're finding trading patterns with AI across reports that you'd never sit down and work through manually.
this is the real power — connecting data across reports to find relationships that aren't visible in any single report on its own.
study what went wrong
"show me every day the gap didn't fill on NQ and find commonalities"
most of the time, traders study what works. but the real edge is understanding when a setup fails. the AI looks at all the failure days and tells you what conditions were present — so you know when to sit on your hands.
this kind of failure analysis is something most traders never do because it's too time-consuming. being able to ask these trading data questions and get answers instantly makes it practical. for more on gap fill data, check out our gap fill trading strategy guide.
real example: the pattern that made us stop and look twice
here's a question we asked edgeful AI about the IB by rejection report on NQ over the last 6 months in the NY session:
"on days where the IB low formed first — how often was it a clean single break up vs. a double break? and how did the day close in each case?"
here's what came back:
out of 67 days where the IB low formed first on NQ, the data showed a bullish single break 67% of the time. but the real finding was what happened next:
- according to edgeful data, on clean single break days, NQ closed green 96% of the time. red days were basically non-existent — just 4%.
- on double break days, it dropped to 64% green. red jumped from 4% to 36%.
think about that. the data already tells you that when the low forms first, you can expect a bullish breakout.
but the difference between a clean break and a double break is massive. 96% vs 64%.
that's the kind of pattern you'd never find just by looking at the IB report. you'd have to manually go through every day, check the break type, check the close direction... and who's doing that? nobody. the AI found it in seconds — that's what it means to find trading patterns with AI instead of spending a weekend with a spreadsheet.
and that's one question on one report on one ticker. imagine what you'd find combining IB with gap fills, or outside days with opening candle continuation, across ES and NQ and GC.
important: this example is from a specific dataset and time period. the patterns the tool finds depend on the data you load, the date range, and the conditions you filter for. results require customization, time, and effort — there's no magic button. the value is in the research process, not any single finding.
how to get started with edgeful AI
getting started takes about 30 seconds:
- open the AI from the left sidebar
- click "analyze reports"
- select your date range, report, ticker, and session
- click "add" to load additional reports (e.g., IB + gap fill + opening candle continuation together)
- click "analyze" — it loads the raw data and you can start asking trading data questions immediately
- ask questions in plain english
that's it. no setup, no configuration, no code. just load your data and start asking.
tips to get the most out of edgeful AI
once you're in, here are a few ways to get better answers when you analyze trading reports with AI:
- keep the data panel open to see available column labels — this helps you reference the exact fields the AI can analyze
- use exact column names for more precise answers (e.g., "break type" instead of just "single break")
- start broad, then drill down — begin with "find commonalities" and narrow with follow-up trading data questions
- use follow-up suggestions — every response suggests a follow-up question so you never get stuck on what to ask next
- combine multiple reports — the real power of AI trading data analysis is in connecting data across reports, not just analyzing one at a time
- try failure analysis — ask "what happened on days where the setup didn't work" to find the conditions where you should sit on your hands
we also put together a guide with 7 real questions and the full data-backed responses for each one. you can grab it here: edgeful.com/ai-best-questions-to-ask
common mistakes to avoid with edgeful AI
treating it like a trade signal tool
it's a research tool, not an advisor. it analyzes historical data and finds patterns — it doesn't tell you what to trade today. use it on the weekends to build out your playbook, study specific setups, and understand when your edge is strongest. AI trading data analysis is for building your process, not generating signals.
only asking one question
the first question is just the starting point. the real value comes from follow-up trading data questions that dig deeper. if the AI tells you that double break days perform differently than clean break days — ask why. ask what conditions were present. ask how it changes by session or ticker. drill down.
ignoring the date range
when you find trading patterns with AI, the results depend heavily on the data window you load. 6 months and 12 months can tell different stories. be intentional about the date range you select and consider running the same question across different periods to see if the pattern holds.
not combining reports
if you're only loading one report at a time, you're only scratching the surface. the most useful findings come when you analyze trading reports with AI across multiple datasets — IB + gap fills, outside days + opening candle, ORB + IB. that's where the connections live that you'd never find manually.
building a consistent trading process takes work — and the right mindset. for more on that, check out the trading mindset that separates consistent traders from everyone else.
key takeaways
- edgeful AI v1 lets you load actual report data and ask questions about it — it reads the raw data and finds patterns in seconds
- it doesn't tell you what to trade. you ask trading data questions about your data, and it finds the answers.
- the real power is combining reports: IB + gap fills, outside days + opening candle continuation, ORB + any other report
- failure analysis is one of the most valuable use cases — when you analyze trading reports with AI, understanding when a setup doesn't work is just as important as knowing when it does
- results require customization, time, and effort — the tool helps you do the research faster, but the work of building a process is still yours
- start broad and drill down — every response suggests a follow-up question so you can go deeper
- one question on one report is just the beginning — the edge is in finding trading patterns with AI across combinations of reports, tickers, and sessions