fibonacci retracement levels: do they actually work? (the data says yes)

most traders I've worked with over the years struggle with one thing... timing their entries. they see a trend, they want in, but they end up buying the top or selling the bottom. sound familiar?
that's where using fibonacci retracement levels becomes your secret weapon. we’ve analyzed thousands of data points using fibonacci retracement levels with our reports, and the data doesn’t lie — fibonacci levels can consistently provide high-probability entry and exit points when used correctly.
but like everything in the market, there’s no magic behind it. it's math. and when you understand the math behind the levels, you can start making data-driven decisions instead of emotional ones.
table of contents
- what is fibonacci retracement and why it works
- the science behind fibonacci numbers in trading
- how to draw fibonacci retracements correctly
- the 5 key fibonacci levels every trader must know
- using fibonacci retracement with other technical indicators
- how to track fibonacci level effectiveness with data
- common fibonacci retracement mistakes to avoid
- using fibonacci retracement in different market conditions
- advanced fibonacci techniques
- frequently asked questions
- key takeaways and next steps
what is fibonacci retracement and why it works
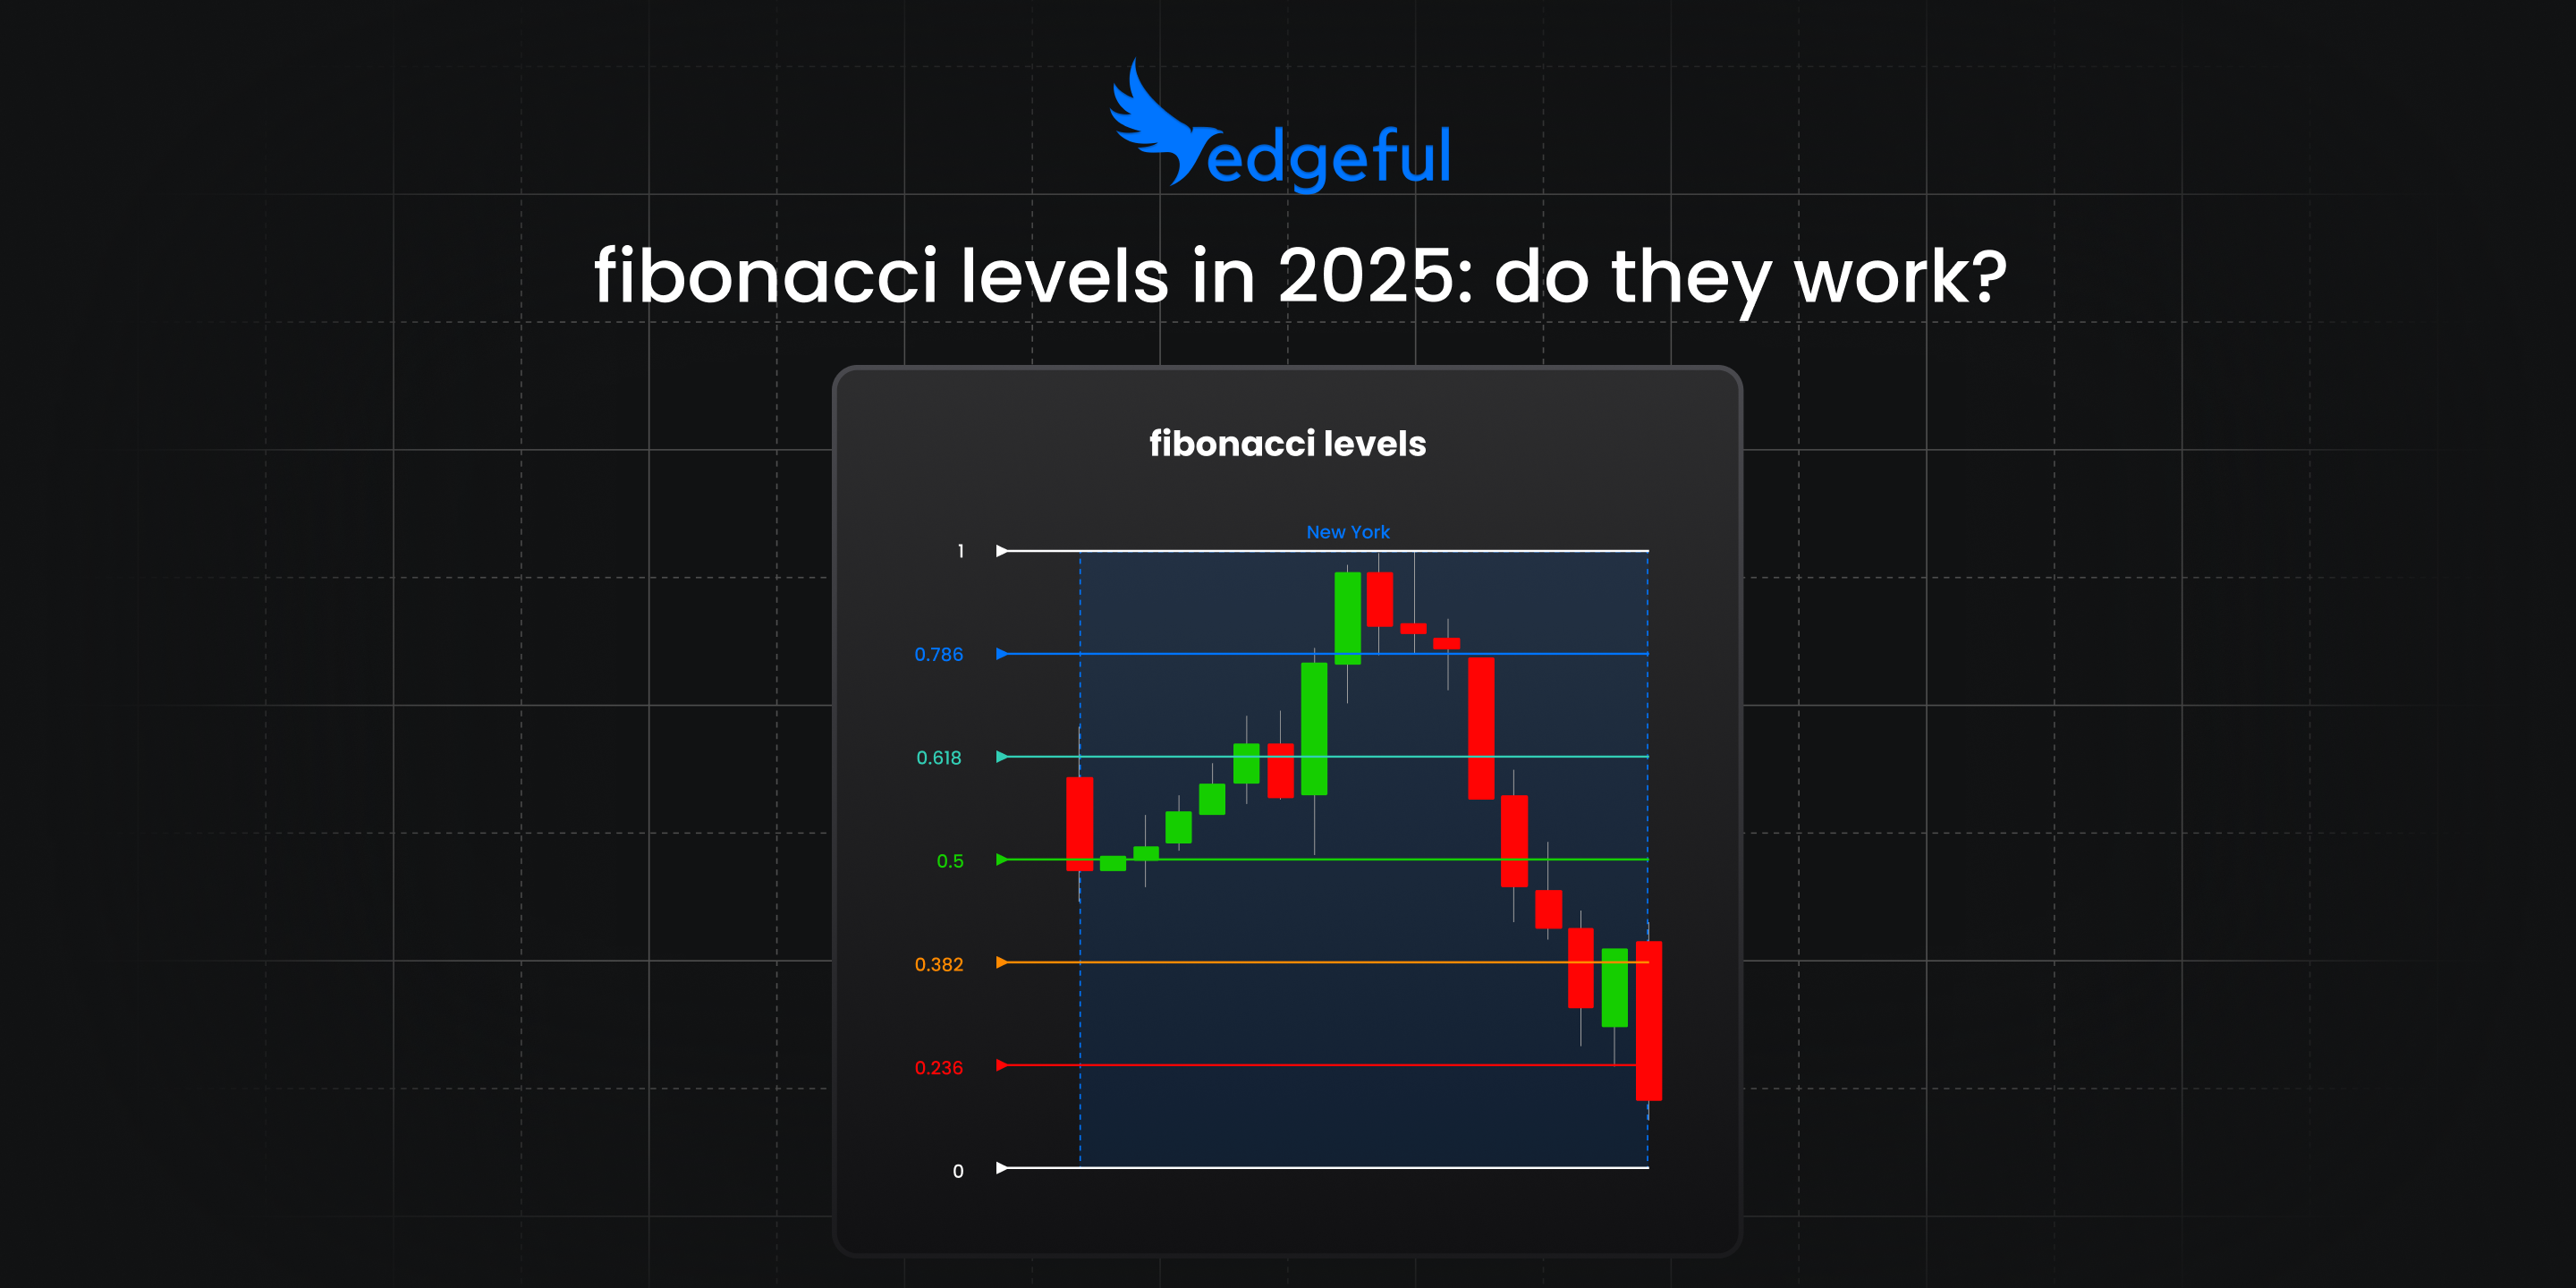
using fibonacci retracement is a technical analysis tool that helps traders identify potential support and resistance levels based on the mathematical relationships found in the fibonacci sequence. these levels - 23.6%, 38.2%, 50%, 61.8%, and 78.6% - represent areas where price might reverse or consolidate during a pullback.
but why do these levels work?
it's not because fibonacci numbers have some mystical power over markets. it's because millions of traders worldwide use these same levels, creating self-fulfilling prophecies. when enough participants expect price to bounce at the 61.8% retracement level, it often does.
the science behind fibonacci numbers in trading
Leonardo Fibonacci didn't invent these numbers for trading... he was studying rabbit populations in 1202. but the sequence he discovered - where each number is the sum of the two preceding numbers (0, 1, 1, 2, 3, 5, 8, 13, 21...) - appears everywhere in nature.
when you divide any number in the sequence by the number that follows it, you get approximately 0.618. divide by the number two places ahead, and you get 0.382. these ratios form the basis of fibonacci retracement levels.
the 61.8% level (also called the "golden ratio") is the most significant.
the 38.2% retracement is the second most reliable depending on the ticker you trade.
the 50% level isn't technically a fibonacci ratio, but traders watch it because human psychology gravitates toward round numbers.
how to draw fibonacci retracements correctly
this is where most traders mess up. using fibonacci retracement isn't just about clicking two points and hoping for the best. there's a specific process that increases your accuracy significantly, especially when you're using session-based fibonacci levels.

step 1: identify the prior day’s closing color
the first thing you need to know is whether the previous day's session closed red (bearish) or green (bullish). this determines how your fibonacci levels are oriented for the next trading day.
if the previous session closed red, the 0 level plots at the bottom and the 1 level plots at the top. if the previous session closed green, the 0 level plots at the top and the 1 level plots at the bottom.
step 2: prior day's color determines fib direction
this step is critical - the previous day's color dictates the entire structure of your fibonacci levels. a red session means you're looking at levels from bottom to top. a green session means you're looking at levels from top to bottom.
this isn't just theoretical... when you understand the directional bias from the previous session, you can anticipate where price is likely to find support or resistance.
step 3: check where price is opening in relation to yesterday's levels
now that you know your fibonacci structure, identify where the current session opens relative to yesterday's fibonacci levels. is it opening between the 0.5 and 0.38 levels? between the 0.2 and 0? this opening position is your starting point.
for example, if YM opens between the 0.5 and 0.38 levels, you immediately know which fibonacci zones are above and below current price.
step 4: use edgeful reports to know how often prices moves to other levels
here's where the magic happens. instead of guessing whether price will reach the 0.62 level or reverse at 0.5, you can use historical data to see actual probabilities.

our fibonacci levels report shows you exactly how often price touches each level based on where it opens.
the above data is on ES over the last year — and you can see we’ve selected the “previous dy green” input on the lower left side of the chart, and then the “beyond 0” opening input. you can see there are 49 instances opening beyond 0, and the most frequent level that price then hits is the .236 fib extension. this happens 55% of the time when price opens beyond 0.
so you can start to see how using this report will allow you to build data-backed profit targets in a new way, allowing you to actually trust and execute when the time comes.
the 5 key fibonacci levels every trader must know
let's break down each fibonacci retracement level and what it means for your trading:

23.6% retracement
this is the shallowest retracement level. when price only pulls back to this level, it signals very strong momentum. in trending markets, a bounce from the 23.6% level often leads to extension moves beyond the previous high.
38.2% retracement
this level represents a moderate pullback. it's common in healthy trends and often provides excellent risk-to-reward opportunities. when using fibonacci retracement at this level, your stop loss can be relatively tight (just below the 50% level), while your target can be the previous high plus an extension.
50% retracement
technically not a fibonacci ratio, but psychologically significant. many trends pause or reverse at the halfway point. if you're looking for trend continuation, a hold above 50% is bullish. a break below often leads to deeper retracements.
61.8% retracement (the golden ratio)
this is the most important fibonacci level. deep retracements to 61.8% represent the last chance for trend continuation. if price can hold and reverse here, the next move is often explosive.
in my experience trading futures, roughly 65% of trends that reach the 61.8% retracement level either reverse completely or continue with reduced momentum.
78.6% retracement
when price reaches this level, the original trend is likely over. this deep retracement suggests either a significant pause or complete reversal. using fibonacci retracement at this level is more about finding reversal opportunities than continuation plays.
using fibonacci retracement with other technical indicators
using fibonacci retracement in isolation is like trying to drive with one eye closed. you can do it, but you're missing half the picture. the real power comes from combining fibonacci levels with other technical tools.
fibonacci + moving averages
when a fibonacci retracement level coincides with a key moving average (20, 50, or 200-period), the level becomes much more significant. I've seen this combination work beautifully on ES futures, especially when the 61.8% level aligns with the 20-period moving average during pullbacks in uptrends.
fibonacci + volume profile
volume profile shows where the most trading activity occurred. when a fibonacci level intersects with a high-volume node, it creates a powerful support or resistance zone. this is particularly effective for swing trading futures contracts.
fibonacci + opening range breakouts
since we trade a lot of opening range breakout strategies, combining these with fibonacci levels creates high-probability setups. when an opening range breakout retraces to a key fibonacci level, it often provides an excellent re-entry opportunity.
fibonacci + initial balance breakouts
similar to opening ranges, initial balance levels (the first hour's range) combined with fibonacci retracements can identify precise entry points for trend continuation trades.
the key is not to overcomplicate things. pick 2-3 tools that complement fibonacci levels and master those combinations rather than trying to use everything at once.
how to track fibonacci level effectiveness with data
here's where most traders mess up with fibs - they start using fibonacci retracement levels based on theory without ever testing if they actually work on their specific markets. that's backwards.
when I analyze fibonacci effectiveness on futures contracts, I use edgeful’s TradingView indicators, specifically using the fibonacci retracement indicator.
it auto plots the levels and directions for me based on the prior session’s close — so I don’t have to waste any time doing it myself (or get confused on where I should be drawing the levels from).

the key is understanding context. if the previous session was bearish (red), your fibonacci levels are oriented one way. if it was bullish (green), they flip. this might seem obvious, but you'd be surprised how many traders miss this detail when using fibonacci retracement levels.
practical application: setting targets with fibonacci data
instead of randomly hoping a fibonacci level will hold, you can use historical touch rates to set realistic targets. if data shows that price reaches the 0.62 level 75% of the time from a specific opening position, that becomes a high-probability target.
conversely, if there's only a 15% chance of price reaching the 0.0 level, you might consider taking profits earlier or even looking for reversal opportunities before that level.
this data-driven approach to using fibonacci retracement transforms it from a subjective art into an objective strategy. you're no longer guessing - you're making informed decisions based on what price has actually done in similar situations.
tracking fibonacci across different sessions
another critical factor is understanding how fibonacci levels perform across different trading sessions. the London session might show different fibonacci touch rates compared to the New York session on the same contract.
for example, if YM opens between certain fibonacci levels during London hours, the probability of touching specific levels changes compared to New York hours. this is because different market participants, volume profiles, and liquidity conditions affect price behavior.
in edgeful’s trading dashboard, you can build out your timeframe, lookback period, and more with only a couple of clicks:

smart traders track these session-specific patterns and adjust their fibonacci strategies accordingly. a high-probability fibonacci setup during New York hours might not translate to the same odds during overnight sessions.
common fibonacci retracement mistakes (and how to fix them)
after working with thousands of traders, I've seen the same fibonacci mistakes repeated over and over. here's how to avoid them and get access to tools that make using fibonacci retracement easier.
mistake #1: drawing levels on every minor move
fibonacci retracements work best on significant price moves. if you're drawing levels on every 1-2% wiggle, you're creating noise, not signals. stick to moves that represent at least 3-5% in stocks or 20-30 points in ES futures.
solution: use our fibonacci by sessions indicator on TradingView that automatically plots levels on the New York or London session ranges. this eliminates subjective guesswork about which swing points matter.
mistake #2: ignoring market context
using fibonacci retracement during choppy, sideways markets is usually a waste of time. these levels shine in trending markets with clear directional bias. if you can't identify a clear trend, don't force fibonacci trades.
solution: combine fibonacci levels with our opening range and initial balance reports to identify when markets are trending vs ranging. this context helps you know when fibonacci setups are worth taking.
mistake #3: not waiting for confirmation
just because price reaches a fibonacci level doesn't mean it will bounce. wait for confirmation - a reversal candle, volume surge, or rejection from the level. patience pays when using fibonacci retracement.
mistake #4: poor risk management
fibonacci levels aren't magical shields. price can and will break through them. always use proper stop losses, typically 5-10 points below the next fibonacci level for futures contracts.
mistake #5: using wrong timeframes
fibonacci retracements drawn on 1-minute charts are mostly noise. use higher timeframes - at least 15-minute for day trading, or daily charts for swing trading. the higher the timeframe, the more reliable the levels become.
get the edgeful fibonacci indicator
to access our fibonacci by sessions indicator on TradingView, head to your edgeful dashboard and connect your TradingView username. the indicator automatically appears in your invite-only scripts, making it easy to plot accurate fibonacci levels without manual drawing.
advanced fibonacci techniques
once you master basic fibonacci retracement levels, there are several advanced techniques that can enhance your trading edge.
fibonacci extensions
while retracements look backward, extensions project forward. the 127.2%, 161.8%, and 261.8% extension levels help identify potential profit targets when trends continue beyond their previous highs or lows.
fibonacci time zones
these vertical lines mark potential timing for market turns. while less reliable than price-based fibonacci levels, they can provide additional confluence when combined with retracement levels.
multiple timeframe fibonacci
drawing fibonacci levels on multiple timeframes simultaneously reveals confluence zones with higher probability of holding. a daily chart fibonacci level that aligns with a 4-hour chart level carries more weight.
fibonacci clusters
when fibonacci levels from different swing moves cluster together, they create powerful support or resistance zones. these areas often generate the strongest trading opportunities when using fibonacci retracement analysis.
frequently asked questions
what's the most important fibonacci retracement level?
the 61.8% level is statistically the most significant, showing reversals about 40% of the time in trending markets. however, the effectiveness depends on market context and confluence with other technical factors.
should I use fibonacci retracement on all timeframes?
no. fibonacci levels work best on higher timeframes - daily charts for position trading, 4-hour for swing trading, and 15-minute minimum for day trading. lower timeframes generate too much noise and false signals.
how do I know which swing points to use for fibonacci retracement?
use significant swing points that represent meaningful price moves - at least 3-5% in stocks or 20-30 points in futures contracts. the move should span multiple days or several hours minimum for day trading.
can fibonacci retracement levels be used as stop losses?
fibonacci levels can help guide stop loss placement, but don't rely on them exclusively. typically, place stops 5-10 points below the next fibonacci level for futures, or use a percentage-based approach for other markets.
do fibonacci retracements work better in uptrends or downtrends?
fibonacci retracements work equally well in both directions when properly applied. the key is identifying the dominant trend and waiting for pullbacks to key levels before entering trades.
key takeaways and next steps
using fibonacci retracement effectively comes down to understanding that these levels represent areas of potential support and resistance, not guaranteed reversal points. the traders who succeed with fibonacci analysis combine these levels with other technical tools and maintain strict risk management.
here's what you need to remember:
the 61.8% level is your most reliable fibonacci retracement for trend continuation trades. when price pulls back to this level in a strong trend, it often provides the last good entry opportunity before the next leg higher.
always look for confluence. fibonacci levels work best when they align with moving averages, volume levels, or previous support and resistance zones. single-factor trades have lower success rates.
patience is crucial when using fibonacci retracement. don't force trades just because price approaches a fibonacci level. wait for confirmation through price action or other technical signals.
market context matters more than the levels themselves. fibonacci retracements work best in trending markets with clear directional bias. in choppy, sideways markets, these levels become less reliable.
the next step is practice. start by identifying significant trends on your favorite futures contracts and drawing fibonacci levels from major swing points. observe how price reacts at these levels over time, and you'll develop the pattern recognition skills needed for successful fibonacci trading.
if you're serious about improving your trading through data-driven analysis like fibonacci retracements, understanding market structure and timing becomes essential. that's exactly what our opening range breakout strategies and initial balance analysis help you achieve - combining fibonacci levels with proven market timing techniques for higher probability trades.
remember, successful trading isn't about finding the perfect indicator or magic levels. it's about understanding market behavior, managing risk, and having the patience to wait for high-probability setups when using fibonacci retracement analysis.


