OHLC: the complete guide for day traders (2025)
when you open your trading platform, you've got options for how to view price action...
line charts that connect closing prices. OHLC bars that show open, high, low, and close. candlestick charts with their colored bodies and wicks.
here's the thing... most traders never really think about which chart type they're using or why it matters. they just stick with whatever their platform defaults to.
but the way you visualize price data changes how you interpret market behavior. OHLC charts give you something line charts can't - complete information about every price point during a trading period.
let's break down what OHLC actually means, how it compares to other chart types, and why understanding these four data points can make you a better day trader.
table of contents
- what is OHLC and why it matters
- the four components explained
- OHLC vs candlestick vs line charts
- reading OHLC bars for day trading
- common OHLC patterns traders use
- OHLC timeframes that work best
- advanced OHLC strategies
- tools and platforms for OHLC analysis
- frequently asked questions
- key takeaways
what is OHLC and why it matters
OHLC stands for open, high, low, close. it's the foundation of every price chart you've ever looked at, whether you realize it or not.
here's why this matters for day trading... every single bar or candle on your chart represents these four critical price points during a specific time period. that 5-minute bar on your ES chart? it shows you the opening price at the start of those 5 minutes, the highest and lowest prices hit during that period, and the closing price when those 5 minutes ended.
the beauty of OHLC data is its simplicity. while other traders get caught up in complicated indicators or fancy chart patterns, you're looking at pure price action. no lag, no interpretation issues - just what the market actually did.
let me be blunt... most day traders overcomplicate their analysis. they're looking for the perfect indicator setup when the answer is right there in the basic OHLC data.
the four components explained
let's get into the specifics of each component and what it tells you about market behavior.
open price
the open is the first transaction price when your chosen time period begins. for a daily chart, it's the first trade of the session. for a 15-minute chart, it's the first trade in that 15-minute window.
here's what most traders miss about the open... it reflects overnight sentiment and gap activity. when you see a significant gap between yesterday's close and today's open on ES futures, that's institutional money making a statement.
high price
the high represents the maximum price reached during that time period. this is your resistance level for that specific bar.
what's crucial for day traders is understanding that the high often represents a failed breakout attempt. if price touches the high early in the period but can't sustain it, that's valuable information about buyer exhaustion.
low price
the low is the minimum price during the time period - your support level for that bar.
smart day traders watch how price reacts at these lows. does it bounce quickly? that suggests strong buying interest. does it grind along the low for most of the period? that's usually bearish continuation.
close price
the close is the final transaction price when the time period ends. this is arguably the most important of the four components.
why? because the close represents the final "vote" of all market participants during that period. if price opened at one level but closed significantly higher, buyers dominated.
if it closed near the low despite trading higher, sellers won the battle.
here’s an example where sellers have won the battle:
OHLC vs candlestick vs line charts
let's compare the three main ways traders visualize price data and when each works best.
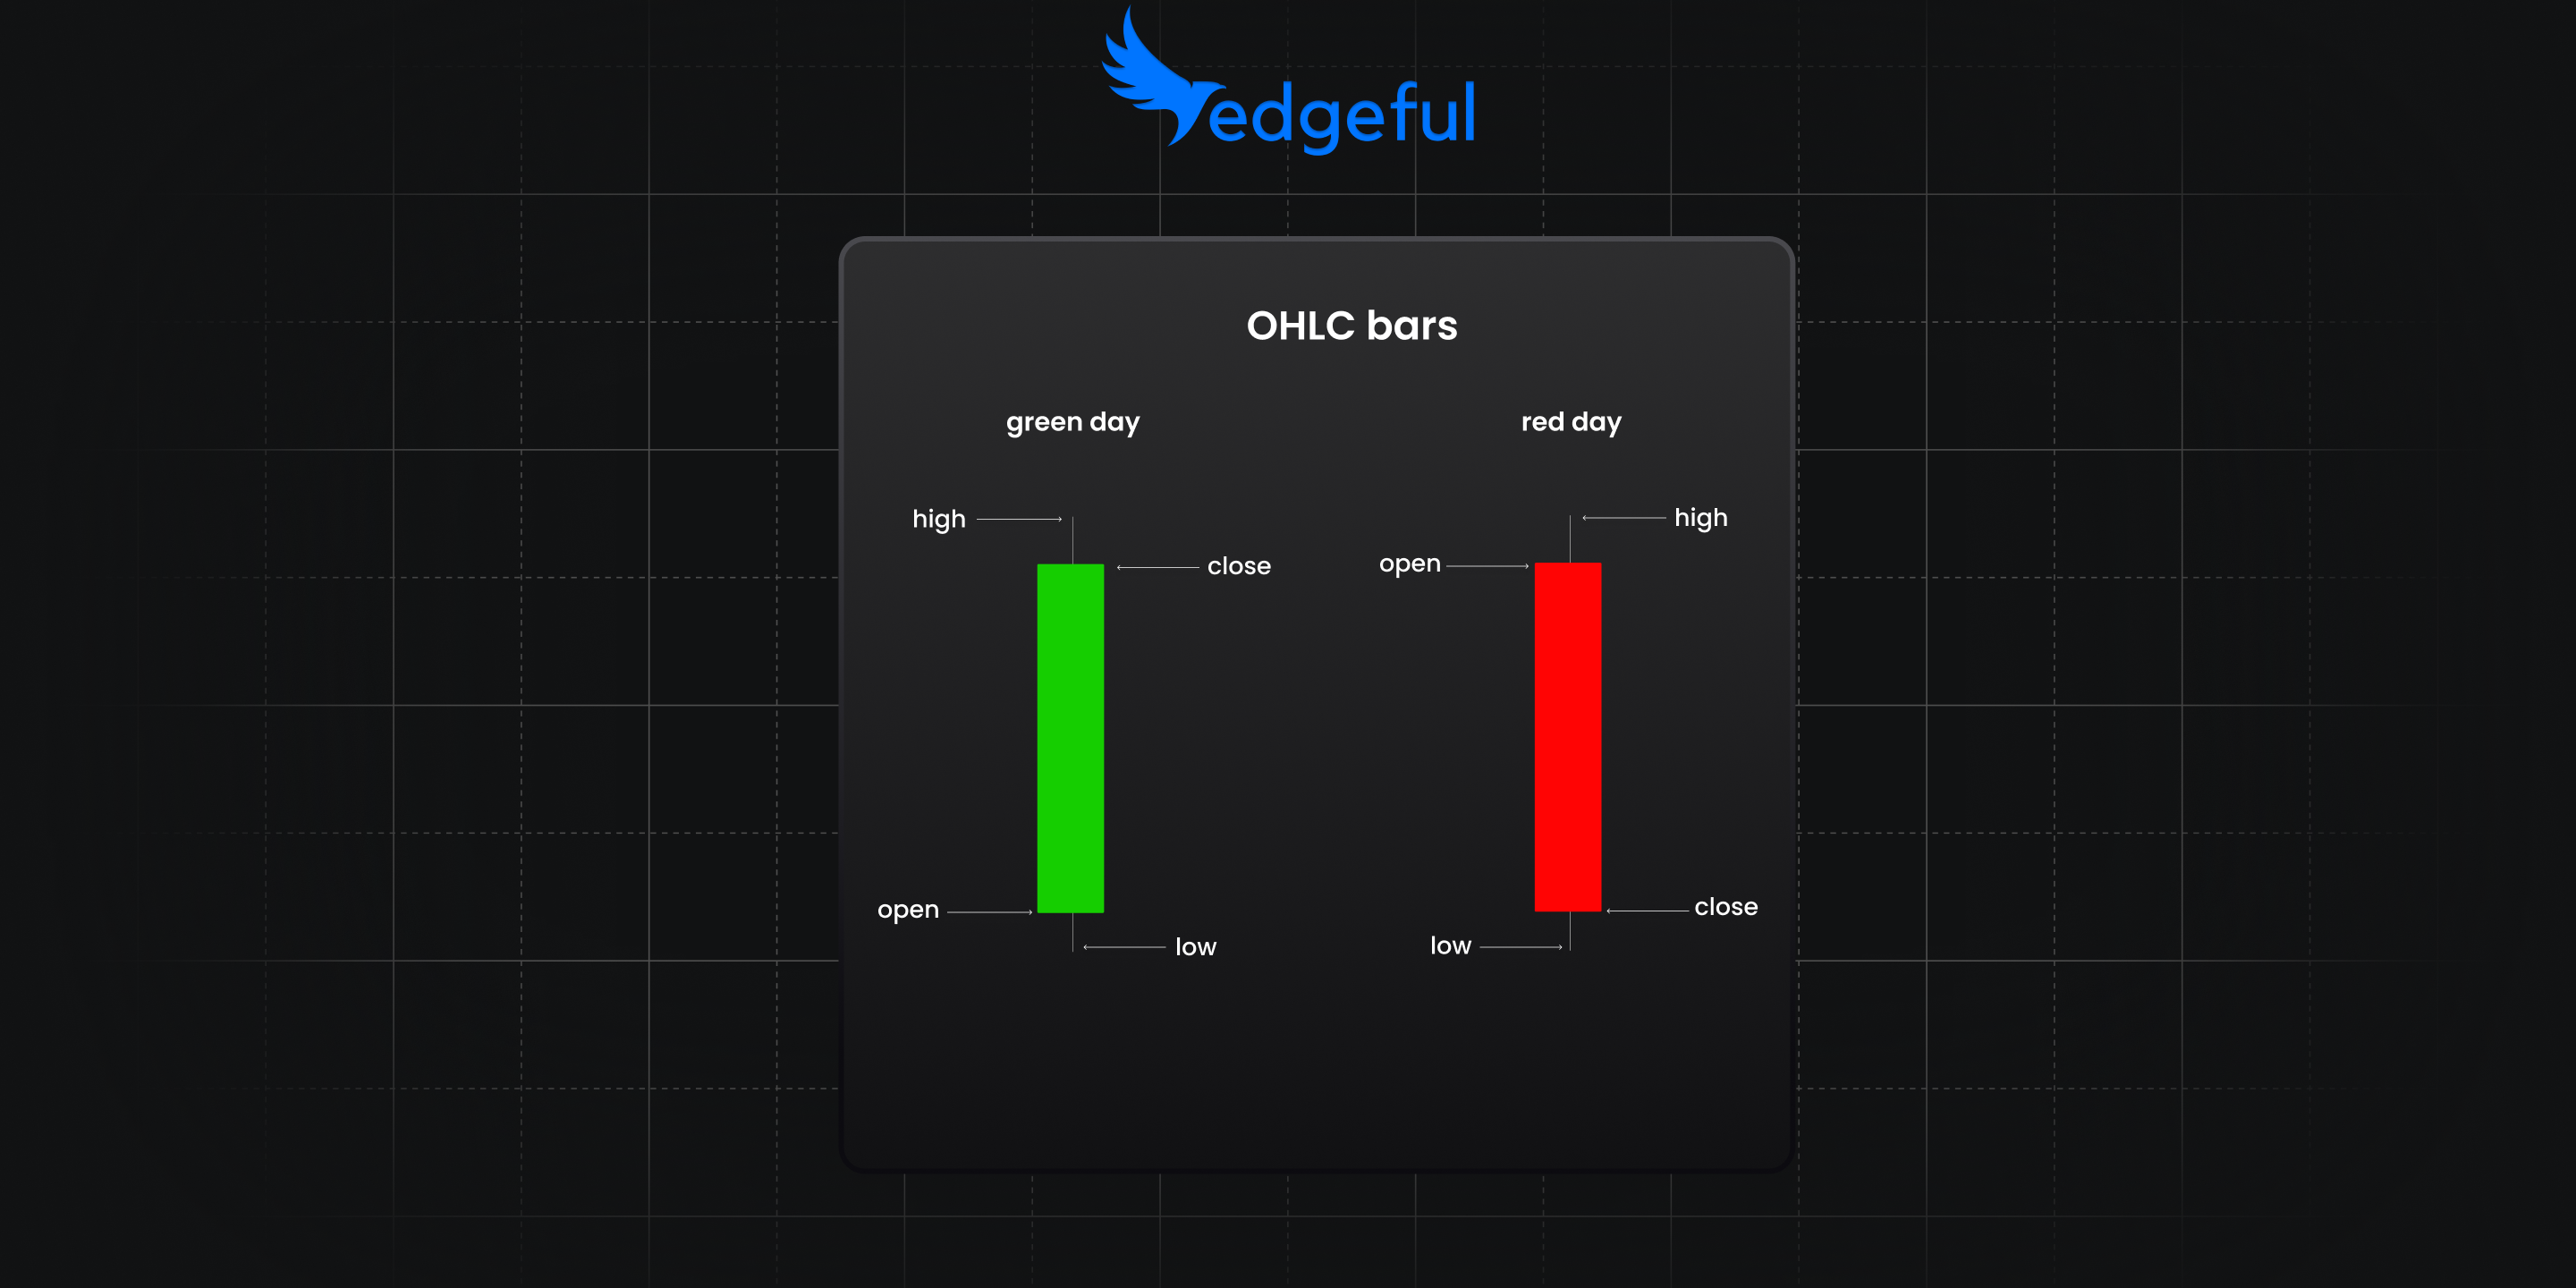
OHLC bar charts
OHLC bars are the purest form of price visualization. each bar is a vertical line showing the high-to-low range, with small horizontal ticks indicating the open (left) and close (right).
advantages:
- clean, uncluttered display
- focuses attention on actual price levels
- easier to spot exact support and resistance
- less emotional bias than colored candles
disadvantages:
- harder to quickly identify bullish vs bearish periods
- requires more practice to read efficiently
- limited pattern recognition compared to candlesticks
candlestick charts
candlesticks use the same OHLC data but present it with colored bodies and wicks. bullish periods typically show green/white bodies, bearish periods show red/black.
advantages:
- instantly shows bullish vs bearish sentiment
- rich pattern recognition capabilities
- widely understood across all markets
- emotional cues through color coding
disadvantages:
- can be visually overwhelming
- color bias might influence decision-making
- body sizes can distract from key levels
- more complex visual processing required
line charts
line charts connect closing prices with a simple line, ignoring open, high, and low data.
advantages:
- clearest trend identification
- reduces market noise
- excellent for long-term analysis
- minimal visual distraction
disadvantages:
- loses critical intraday information
- no support/resistance identification
- poor for entry/exit timing
- misses volatility information
as a day trader, I recommend starting with OHLC bars to truly understand price action, then switching to candlesticks once you've mastered the fundamentals.
reading OHLC bars for day trading
here's where it gets practical... how do you actually use OHLC data to make better day trading decisions?
the range tells the story
the distance between high and low shows you volatility for that period. wide ranges indicate high volatility, narrow ranges suggest consolidation.
larger ranges typically signal stronger momentum and trend continuation potential. smaller ranges often precede breakout moves as the market consolidates before making its next big move.
open-close relationships
the relationship between open and close reveals who controlled the period:
- close > open: buyers dominated (bullish period)
- close < open: sellers dominated (bearish period)
- close ≈ open: indecision or balance (neutral period)
position of close within range
where the close falls within the high-low range is critical:
- close near high: strong buying throughout period
- close near low: strong selling throughout period
- close in middle: back-and-forth action, indecision
here's what makes this powerful... when you see consistent closing strength (close near high) across multiple bars, that's telling you buyers are in control. when you see consistent closing weakness (close near low), sellers are dominating.
volume confirmation
while OHLC shows price action, volume confirms the strength of moves. high-volume OHLC bars carry more weight than low-volume ones.
a closing strength bar with high volume is far more reliable than the same pattern on low volume. always check volume alongside your OHLC analysis.
common OHLC patterns traders use
certain OHLC formations repeat consistently and offer trading opportunities. here are the ones that actually work...
inside bars
an inside bar occurs when the current bar's high is lower than the previous bar's high AND the current bar's low is higher than the previous bar's low.
this pattern indicates consolidation and often precedes breakout moves. inside bars work best when they form after strong trending moves or at key support/resistance levels.
outside bars/days
an outside day or bar has a higher high and lower low than the previous bar. this shows increased volatility and often marks reversal points.
outside bars work best when they occur at key support or resistance levels. the expanded range shows that both buyers and sellers tested extremes before one side took control.
closing strength/weakness bars
bars that close in the top 25% of their range (closing strength) or bottom 25% of their range (closing weakness) are powerful continuation signals.
closing strength characteristics:
- open in lower half of range
- close in top 25% of range
- sustained buying pressure throughout period
closing weakness characteristics:
- open in upper half of range
- close in bottom 25% of range
- sustained selling pressure throughout period
OHLC timeframes that work best
the timeframe you choose for OHLC analysis dramatically affects your trading results. here's what works for day trading...
1-minute OHLC
best for: scalping, precise entries, high-frequency trading drawbacks: lots of noise, requires constant attention trader skill needed: advanced
5-minute OHLC
best for: short-term day trades, momentum plays drawbacks: still fairly noisy, quick decision requirements trader skill needed: intermediate to advanced
15-minute OHLC
best for: swing day trades, pattern recognition, new traders drawbacks: slower signals, fewer opportunities trader skill needed: beginner friendly
1-hour OHLC
best for: position trades, major level identification drawbacks: very slow signals, limited day trading utility trader skill needed: all levels
most day traders find that 15-minute OHLC provides the best balance of signal quality and opportunity frequency. you get 26 bars during a typical ES trading day, which gives plenty of chances without overwhelming noise.
advanced OHLC strategies
once you understand basic OHLC reading, these advanced concepts can improve your trading significantly.
OHLC confluence
look for times when multiple OHLC patterns align:
- inside bar at previous day's close
- closing strength bar at key support level
- outside bar with volume spike
when 2-3 OHLC signals align, your probability of success increases significantly. this is where pattern recognition meets probability.
range expansion and contraction
track how OHLC ranges change over time:
- range expansion: volatility increasing, trend likely
- range contraction: volatility decreasing, breakout coming
we measure this by comparing current bar's range to the average range of the previous 20 bars. when current range is 150%+ of the average, continuation moves are highly probable.
opening gap analysis with OHLC
gaps between yesterday's close and today's open create trading opportunities:
- gap up + inside bar: often fills gap
- gap down + closing strength: often reverses higher
- gap in direction of trend + outside bar: often extends
multiple timeframe OHLC
use OHLC analysis across different timeframes for confirmation:
- daily OHLC for overall context and major levels
- 1-hour OHLC for trend direction and momentum
- 15-minute OHLC for specific entry and exit timing
this multi-timeframe approach helps you see the bigger picture while timing your entries precisely.
frequently asked questions
what's the difference between OHLC and HLC data?
HLC (high, low, close) data excludes the opening price. while HLC can work for some analysis, the opening price provides critical context about gaps, overnight sentiment, and initial market direction. for day trading, the full OHLC data is essential.
can you use OHLC analysis for cryptocurrency trading?
absolutely. crypto markets provide 24/7 OHLC data, making pattern analysis even more reliable since there are no overnight gaps. however, crypto volatility means you'll want to use shorter timeframes - 5-minute and 15-minute OHLC work best.
how do you handle extended hours OHLC data?
for futures like ES and NQ that trade nearly 24 hours, we recommend using regular trading hours (RTH) data for your primary analysis. extended hours can add noise and false signals. however, overnight OHLC ranges often provide excellent support and resistance levels for the next day's trading.
what's the minimum account size needed for OHLC day trading?
unlike stock day trading with PDT rule restrictions, futures trading has no minimum account size. however, most professional traders recommend at least $5,000-$10,000 to properly manage risk with OHLC strategies. smaller accounts limit your position sizing flexibility and increase psychological pressure.
if you're interested in learning more about avoiding PDT restrictions, check out our guide on the PDT rule explained.
do OHLC patterns work better on certain markets?
OHLC patterns work most reliably on highly liquid markets like ES, NQ, and YM futures. these markets have tight spreads, consistent volume, and less manipulation than smaller markets. currency futures also show strong OHLC pattern reliability.
avoid using OHLC analysis on thinly traded markets where a single large order can distort the price action and create false patterns.
key takeaways
here are the essential points to remember about OHLC analysis:
- OHLC data provides the purest view of market behavior - no indicators or interpretations needed
- the relationship between open, high, low, and close tells you everything about who controlled that time period
- 15-minute OHLC timeframes offer the best balance of signal quality and opportunity frequency for day trading
- focus on closing strength/weakness and inside/outside bar patterns for reliable trading signals
- always confirm OHLC signals with volume data for better reliability
- use multiple timeframes - daily for context, hourly for trend, 15-minute for timing
- OHLC analysis works best on liquid futures markets like ES, NQ, and YM
the biggest mistake new traders make is complicating their analysis. start with basic OHLC reading, master the fundamentals, then add advanced techniques.
remember... every successful day trader understands OHLC relationships, whether they realize it or not. the ones who consciously study and apply OHLC analysis have a significant edge.
want more strategies for improving your day trading? our weekly newsletter breaks down key market patterns and probability data for ES, NQ, and other major futures contracts.