weekly open retracement report: what it measures and how traders use it
the weekly open retracement report on edgeful analyzes how price reacts to the weekly open by tracking instances where daily opens occur above or below the weekly open, then measuring whether price retraces back to test that level.
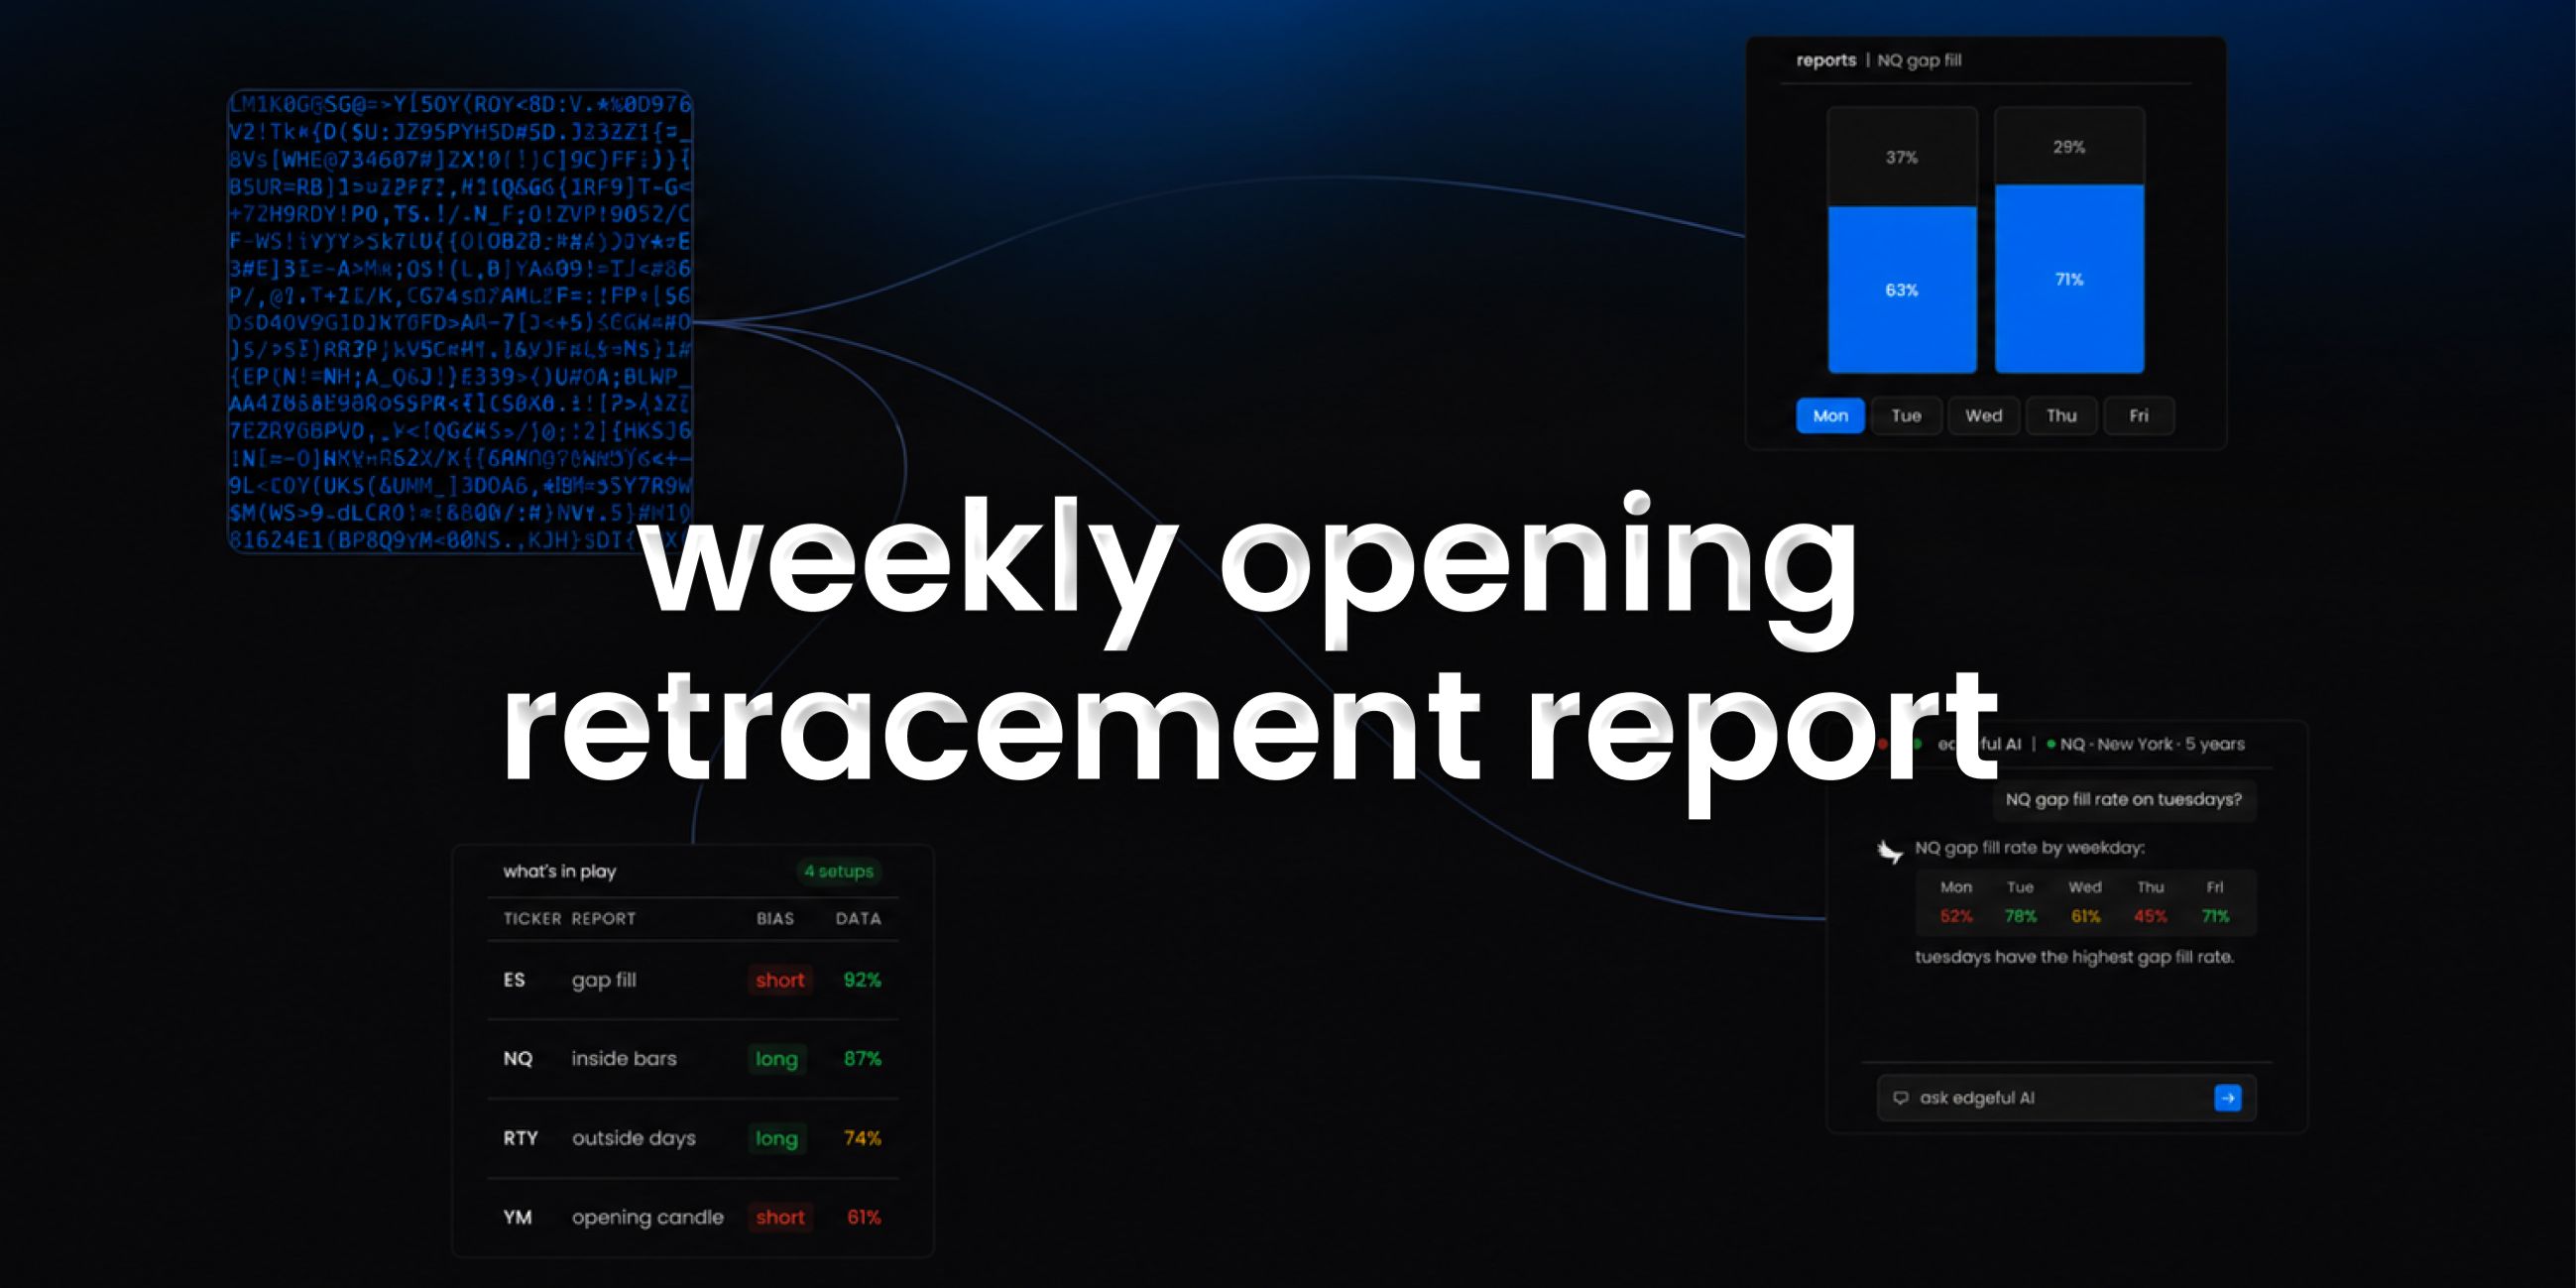
this is one of the 150+ reports available on the edgeful platform. here's how it works, what the data shows, and how traders use it.
table of contents
- what the weekly open retracement report measures
- how the calculation works
- available subreports
- how traders use weekly open retracement data
- combining weekly open retracement with other reports
- key takeaways
what the weekly open retracement report measures
the weekly open retracement report analyzes how price reacts to the weekly open by tracking instances where daily opens occur above or below the weekly open, then measuring whether price retraces back to test that level.
the report is available for futures, stocks, ETFs, forex, and crypto. you can filter by ticker, session (NY, London, Asian, full globex, or custom), and lookback period (1 month to 5+ years).
how the calculation works
according to edgeful data, the weekly open retracement report follows a specific calculation process:
the weekly open retracement report tracks how price interacts with the weekly opening level throughout the week.
- the report identifies the weekly opening price as the reference level
- it checks whether each day opens above or below that weekly open
- for days opening above, it tracks whether price retraces down to test the weekly open level
- for days opening below, it tracks whether price retraces up to test the weekly open level
- retracement percentages are calculated for both scenarios, showing how often the weekly open acts as a magnet for price
available subreports
the weekly open retracement report has 2 subreports for deeper analysis:
by spike. analyzes price spikes that occur before weekly open level retracements by grouping data by iso_year_week and tracking highest/lowest points reached before price returns to weekly open. Calculates spike percentages for weeks opening above versus below weekly open levels, returning averages, maximums, and occurrence counts for each category.
by weekday. analyzes how often price retraces to weekly opening levels on each weekday. Groups historical data by ISO year-week, identifies when price touches weekly open levels, and tracks which weekday the first retracement occurs on. Calculates frequency and percentage distribution of retracements across Monday through Friday.
how traders use weekly open retracement data
- identifying weekly opening levels as key support and resistance zones for intraday trading
- setting expectations for retracement probability based on whether price opens above or below weekly levels
- planning entry strategies around weekly open retests with statistical backing
- risk management by understanding likelihood of weekly level holds versus breaks
- timing trades based on historical patterns of weekly opening level reactions
the data doesn't tell you to trade. the weekly open retracement report tells you the historical performance of the setup in front of you. what you do with that information is your decision.
results require customization, time, and effort. the numbers change depending on your ticker, session, and lookback period. always check the data for your specific conditions.
combining weekly open retracement with other reports
the weekly open retracement report works best when combined with other edgeful reports for confluence:
- use the what's in play dashboard to see weekly open retracement data alongside your other favorite reports in one view
- the screener lets you scan up to 49 tickers for weekly open retracement setups across 4 reports simultaneously
- edgeful AI can analyze weekly open retracement data alongside other reports and find patterns you'd never spot manually
key takeaways
- the edgeful weekly open retracement report measures analyzes how price reacts to the weekly opening level by tracking instances where daily opens occur above or below the weekly open, then measuring whether price retraces back to test that weekly opening level. calculates frequencies and percentages for opened above versus below scenarios and their respective retracement rates.
- available for futures, stocks, ETFs, forex, and crypto with full session, ticker, and date range filtering
- 2 subreports available: by spike, by weekday
- part of the 150+ reports included in the edgeful essential plan ($49/month or $39/month annual)
- works best when combined with other reports using what's in play, the screener, or edgeful AI
trading involves risk. past performance and historical data do not guarantee future results. the statistics referenced in this post are based on historical data and may not reflect future market conditions. always trade with proper risk management.