trade backtesting 2025: why probability stacking beats traditional backtesting
here's the thing about traditional trade backtesting... you're doing it backwards.
most traders think backtesting means coding up some strategy and running it against 20 years of historical data. then they wonder why their "97% win rate" backtest turns into a disaster when they put real money on the line.
I've worked with thousands of traders, and the ones who actually make money don't spend months building complex backtesting systems. instead, they focus on probability stacking – finding setups that already have proven historical edge and combining them when they align.
that's exactly how we approach trade backtesting at edgeful. instead of building strategies from scratch, we identify high-probability setups from our report library and stack multiple edges when market conditions align. the result? strategies that work in current market conditions because they're built on relevant, actionable probabilities.
table of contents
- the traditional backtesting trap
- probability stacking: the edgeful approach
- how to identify high-probability setups
- stacking multiple edges for better odds
- using reports to guide your trading decisions
- from probability to live execution
- frequently asked questions
the traditional backtesting trap
let's talk about why traditional trade backtesting sets you up for failure...
the 20-year data delusion
here's the problem: markets from 2005 have nothing to do with markets in 2025. the algorithms, volatility patterns, participant behavior — everything has changed. yet traders keep optimizing strategies based on data that's completely irrelevant to today's environment.
the overfitting nightmare
traditional backtesting encourages you to tweak parameters until you get perfect results. moving average crossover not working? try different periods. RSI overbought at 70? maybe 73 works better. keep adjusting until the equity curve looks beautiful.
congratulations, you've just built a strategy that's perfectly optimized for the past and completely useless for the future.
the execution reality gap
even if your traditional backtest survives the data relevance problem and the overfitting trap, there's still the execution gap. your backtest assumes perfect fills at perfect prices with perfect timing. real trading? not so much.
slippage, emotional hesitation, news events that mess with your psychology — none of this shows up in your pristine backtest results. that's why so many "profitable" strategies blow up the moment real money touches them.
what you should be doing instead
at edgeful, we believe that you shouldn’t backtest more than 5 years in history. why? for the exact reasons we’ve laid out above — there’s no point trying to trade a strategy that worked in market conditions 2 decades ago.
the strategies you’re trading right now should be performing in the current environment.
it’s even a stretch to think data and strategies from 5 years ago should have any relevance in today’s markets — since 2020, we’ve had:
- COVID
- two presidential elections
- tons of other news events
imagine thinking the 2025 market is the same as the 2020 market. impossible.
probability stacking: the edgeful approach
don’t get me wrong — backtesting is a useful approach to build confidence in a strategy. but it’s more about finding profitable trading opportunities now.
here’s exactly how to do that (which you can then go backtest on your own):
start with proven probabilities
instead of building strategies from scratch, we start with setups that already have documented historical edge. our report library contains 100+ different market behaviors, each with specific probabilities and customizations, based on relevant market data.
take our gap fill report. we know that ES gaps between 0.0-0.19% get filled at an 89% and 93% rate over the last 6 months.
that's not a backtest result – that's a documented probability based on recent, relevant data.
you can then take this data, and build a strategy around it.
identify alignment opportunities
here's where it gets interesting. individual setups might have decent odds, but when multiple high-probability setups align on the same trade, your edge compounds dramatically.
this is where a setup like our ultimate bullish setup comes to play.
let's say the gap fill report shows a 78% probability, the opening range breakout shows 65% odds in the same direction, and our session bias report indicates strong momentum characteristics. when all three align? you're looking at a setup with significantly higher probability than any individual component.
focus on current market relevance
our reports don't use 20 years of irrelevant data. we focus on timeframes that actually matter for current market conditions – typically 6 months to 2 years depending on the specific market behavior we're analyzing.
why? because we want probabilities that reflect TODAY's market structure, not some idealized version from a decade ago. when market conditions change, our probabilities adjust accordingly.
use real-time validation
this is where traditional backtesting completely breaks down, but our approach shines. the what's in play screener shows you which high-probability setups are developing right now, across multiple tickers simultaneously.
instead of wondering "will my backtest work in live markets?" you see exactly which probability-based edges are setting up in real-time. no guesswork, no hoping – just live validation of the same historical probabilities you're using for trade selection.
how to identify high-probability setups
the key to successful trade backtesting isn't building and backtesting perfect strategies – it's learning to recognize setups that already have proven edge and trading them in real time.
understand what creates lasting edge
not all market behaviors are created equal. some patterns reflect deep structural aspects of how markets function, while others are temporary quirks that disappear as soon as everyone notices them.
gap fills, for example, represent genuine supply and demand imbalances that create predictable price movements. this setup has been around for decades — and of course, goes in and out of favor from time to time — but still can provide reliable returns once you know what to look for.
another setup we love — the opening range breakout — works because they represent the resolution of consolidation periods where buying and selling pressure has been building.
focus on measurable probabilities
every setup in our report library comes with specific statistics:
- probabilities/occurrences
- a table with exact instance count
- another table that you can go by instance and filter
- subreports where you can customize the inputs to fit your strategy
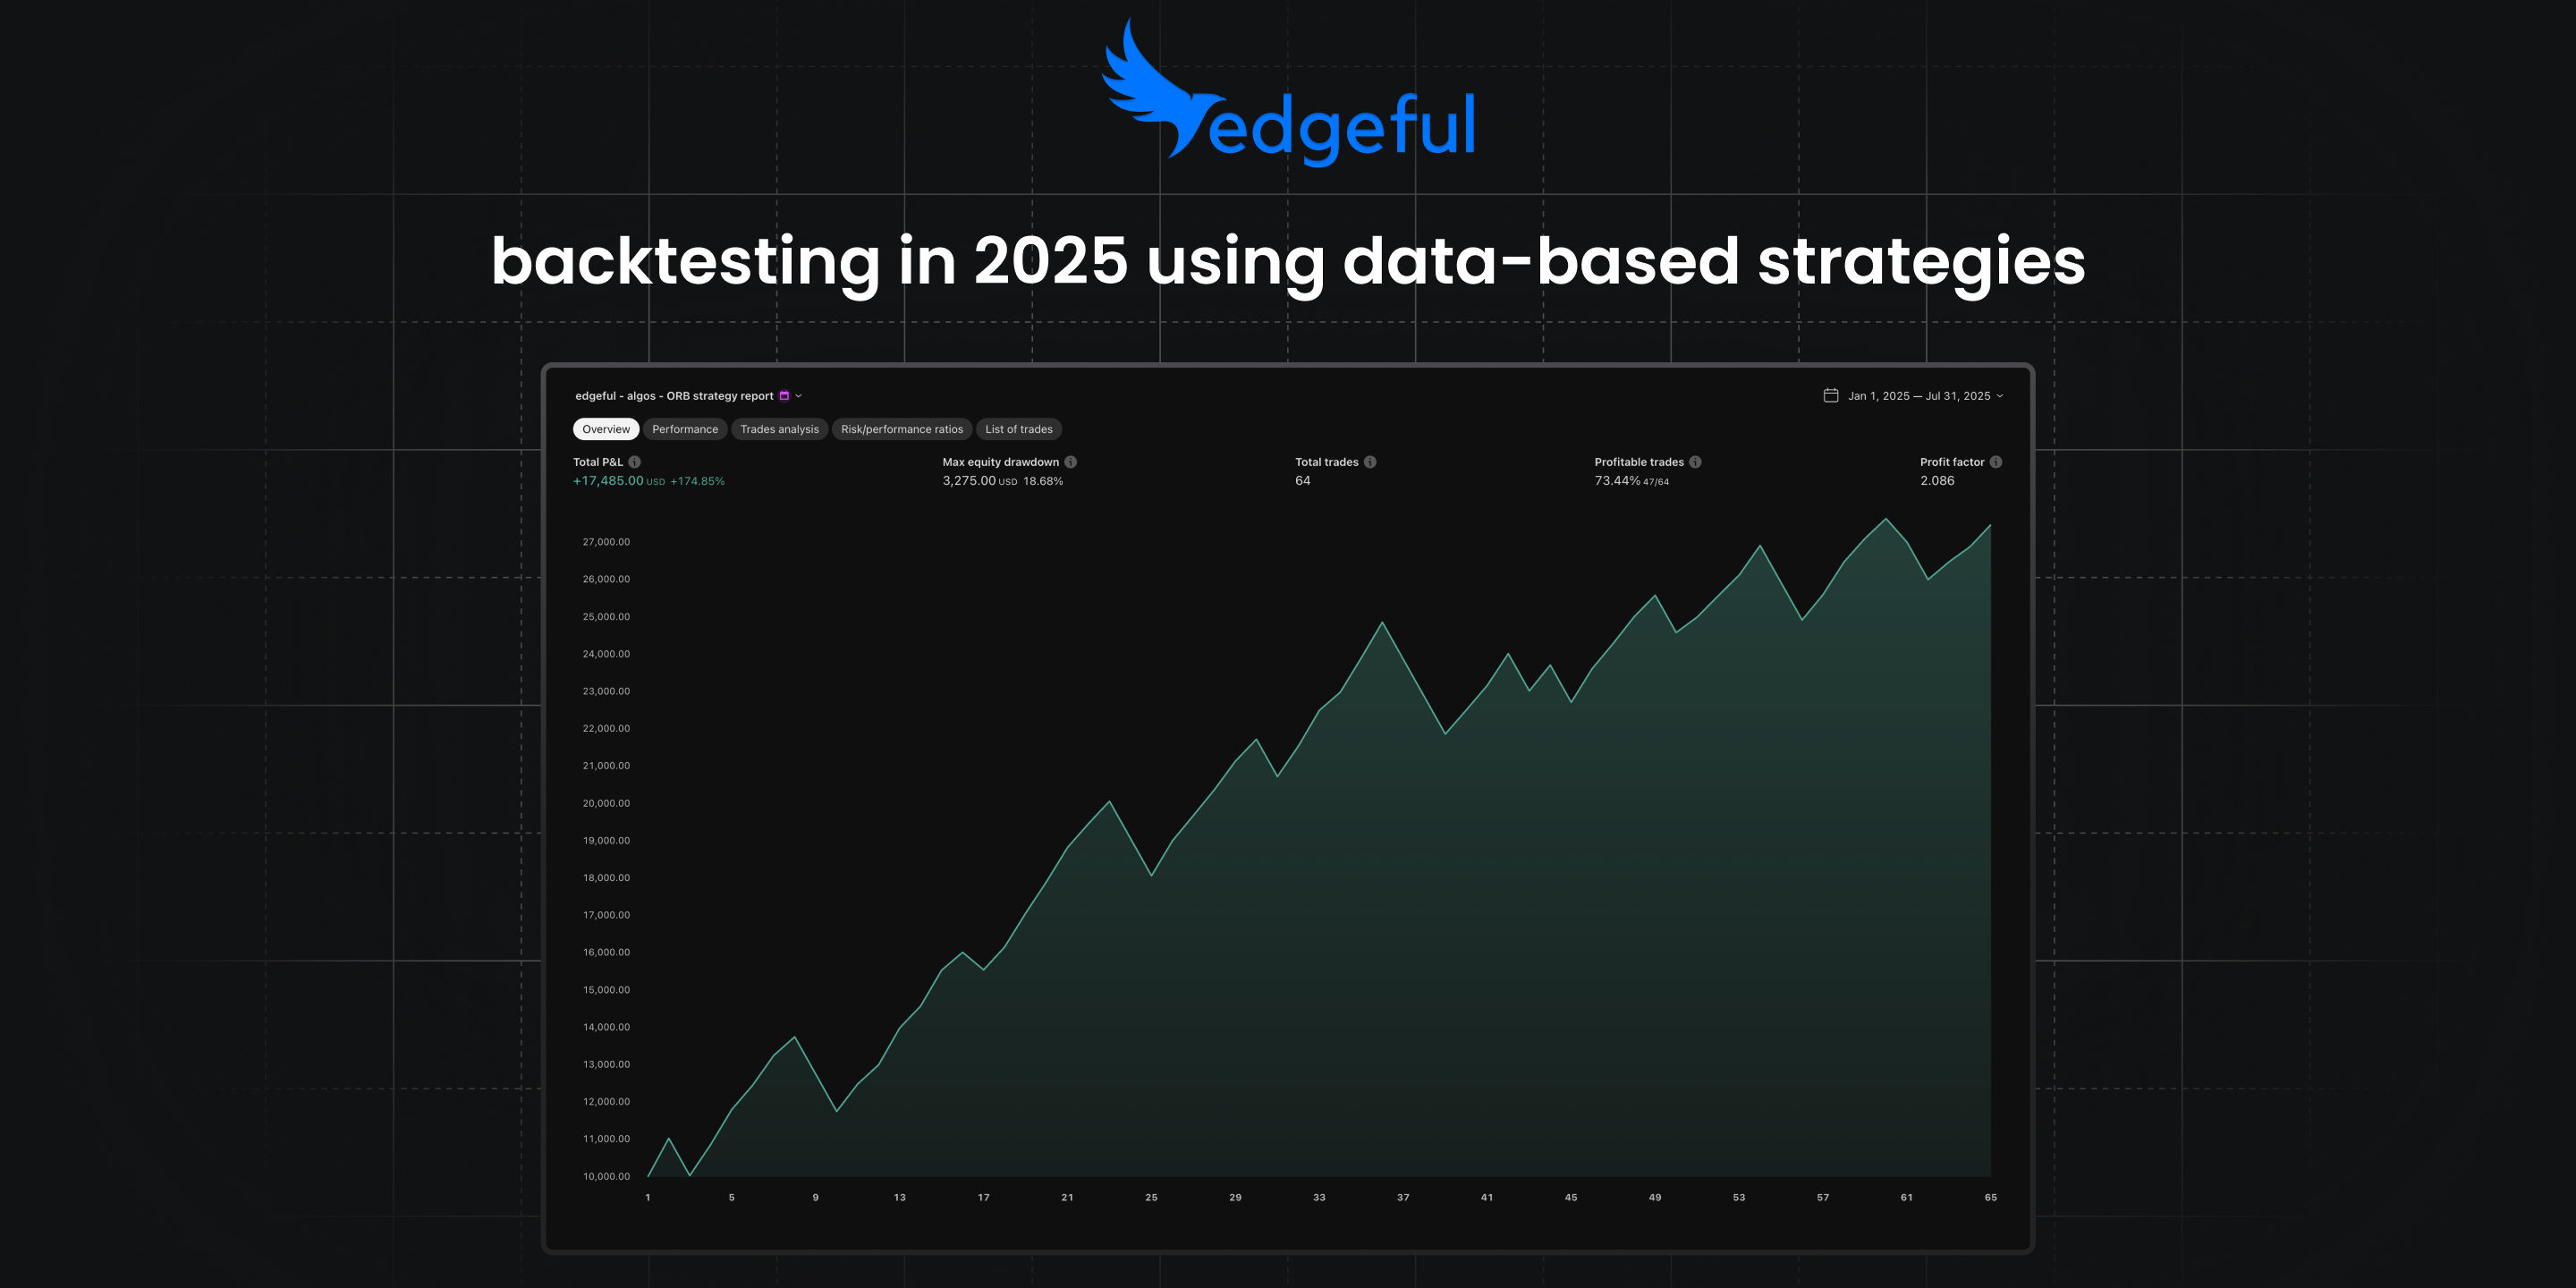
and over the last couple of months, we’ve even taken the best performing reports and turned them into automated trading strategies.
here are the 4 strategies:
- Opening Range Breakout (ORB): One trade per day, breakout continuation, highest win rate.
- Initial Balance Breakout (IB): Trades the first hour’s range, a prop firm classic.
- Gap Fill: Plays mean reversion from overnight gaps.
- Engulfing Candles: Multiple trades per session, reversal setups all day.
these automations allow you to backtest, change inputs, and optimize the algos over different periods. these optimizations then plot into an equity curve, and you can see your past performance, duration, number of winners vs losers, and much more:
from probability to live execution
knowing the probabilities is only half the battle. here's how to translate statistical edge into consistent profits...
paper trading with probabilities
before risking real money, paper trade using our probability-based approach for at least 30 days. track not just your P&L, but whether your results match the expected statistical characteristics of each setup.
if the reports indicate you should see roughly 70% winners, your paper trading should reflect similar statistics. if there's a significant difference, figure out what's causing the gap before going live.
automation reduces execution errors
emotional trading destroys statistical edge. when our reports show a high-probability setup, but fear or greed prevents proper execution, you're throwing away money.
that's why our algos includes the option for automation — all you have to do is integrate following the steps on edgeful’s algos dashboard.
scaling based on edge validation
start small while you validate that live results match the probability-based expectations. as your execution consistency improves and results align with the historical statistics, you can gradually increase position sizes.
the goal isn't to get rich quick – it's to build a sustainable trading process based on documented statistical edge rather than hopes and emotions.
continuous probability monitoring
market conditions change, and probabilities adjust accordingly. what worked with 78% accuracy six months ago might only work 65% of the time in current conditions. our reports update regularly to reflect these changes.
successful probability-based trading means staying current with these statistical changes rather than clinging to outdated data that no longer reflects current market realities.
frequently asked questions
how is this different from traditional backtesting?
traditional trade backtesting builds strategies from scratch and tests them on years of historical data. our approach starts with proven probabilities from recent, relevant market data and focuses on identifying when multiple edges align. instead of coding and optimizing, you're selecting from documented high-probability setups.
what if the probabilities change?
they do change, and that's exactly why we focus on shorter, more relevant timeframes rather than decades of outdated data. our reports update regularly to reflect current market conditions. when probabilities shift, you know immediately rather than discovering it after months of poor live results.
how many setups should I focus on?
start with 3-4 report-based setups that match your schedule and risk tolerance. master those probabilities completely before adding complexity. most successful traders using our approach focus on a small number of high-probability setups rather than trying to trade everything.
can this work for day trading and swing trading?
absolutely. our reports cover different timeframes from intraday momentum plays to multi-day mean reversion setups. the key is matching the probability timeframe to your trading style. day traders focus on intraday reports, swing traders use longer-term probability data.
what about futures vs stocks for this approach?
futures markets often provide cleaner probability data because there are no corporate actions, dividends, or stock splits to complicate the historical analysis. plus, no pdt restrictions means you can take advantage of high-probability setups more frequently with smaller account sizes.
key takeaways
trade backtesting isn't about building the perfect strategy from scratch and then testing it over the last 2 decades. it's about identifying patterns in the current market environment, using data, and then learning to optimize them with specific customizations that fit your personality.
so what should you do?
- focus on proven probabilities: start with setups that already have documented edge rather than building from scratch — use our reports library to do this
- stack multiple edges: real profits come from finding confluence between independent high-probability events. review our ultimate bullish strategy to see this in action.
- use relevant timeframes: recent market data often provides better edge than decades of outdated information. we recommend trade backtesting using the last 6 months to 1 year of data.
- automate execution: when you’re ready, look to use our 4 proven algos to remove emotional decision-making that can destroy your trading.
- track results vs expectations: continuous validation ensures your live results match probability-based projections
the goal isn't perfect prediction – it's consistent execution of strategies with positive mathematical expectancy based on current market probabilities.