session volume by weekday report: what it measures and how traders use it
the session volume by weekday report on edgeful calculates average trading volume for the Tokyo, London, and New York sessions grouped by weekday. it creates summary statistics with mean volumes per weekday and detailed daily volume records.
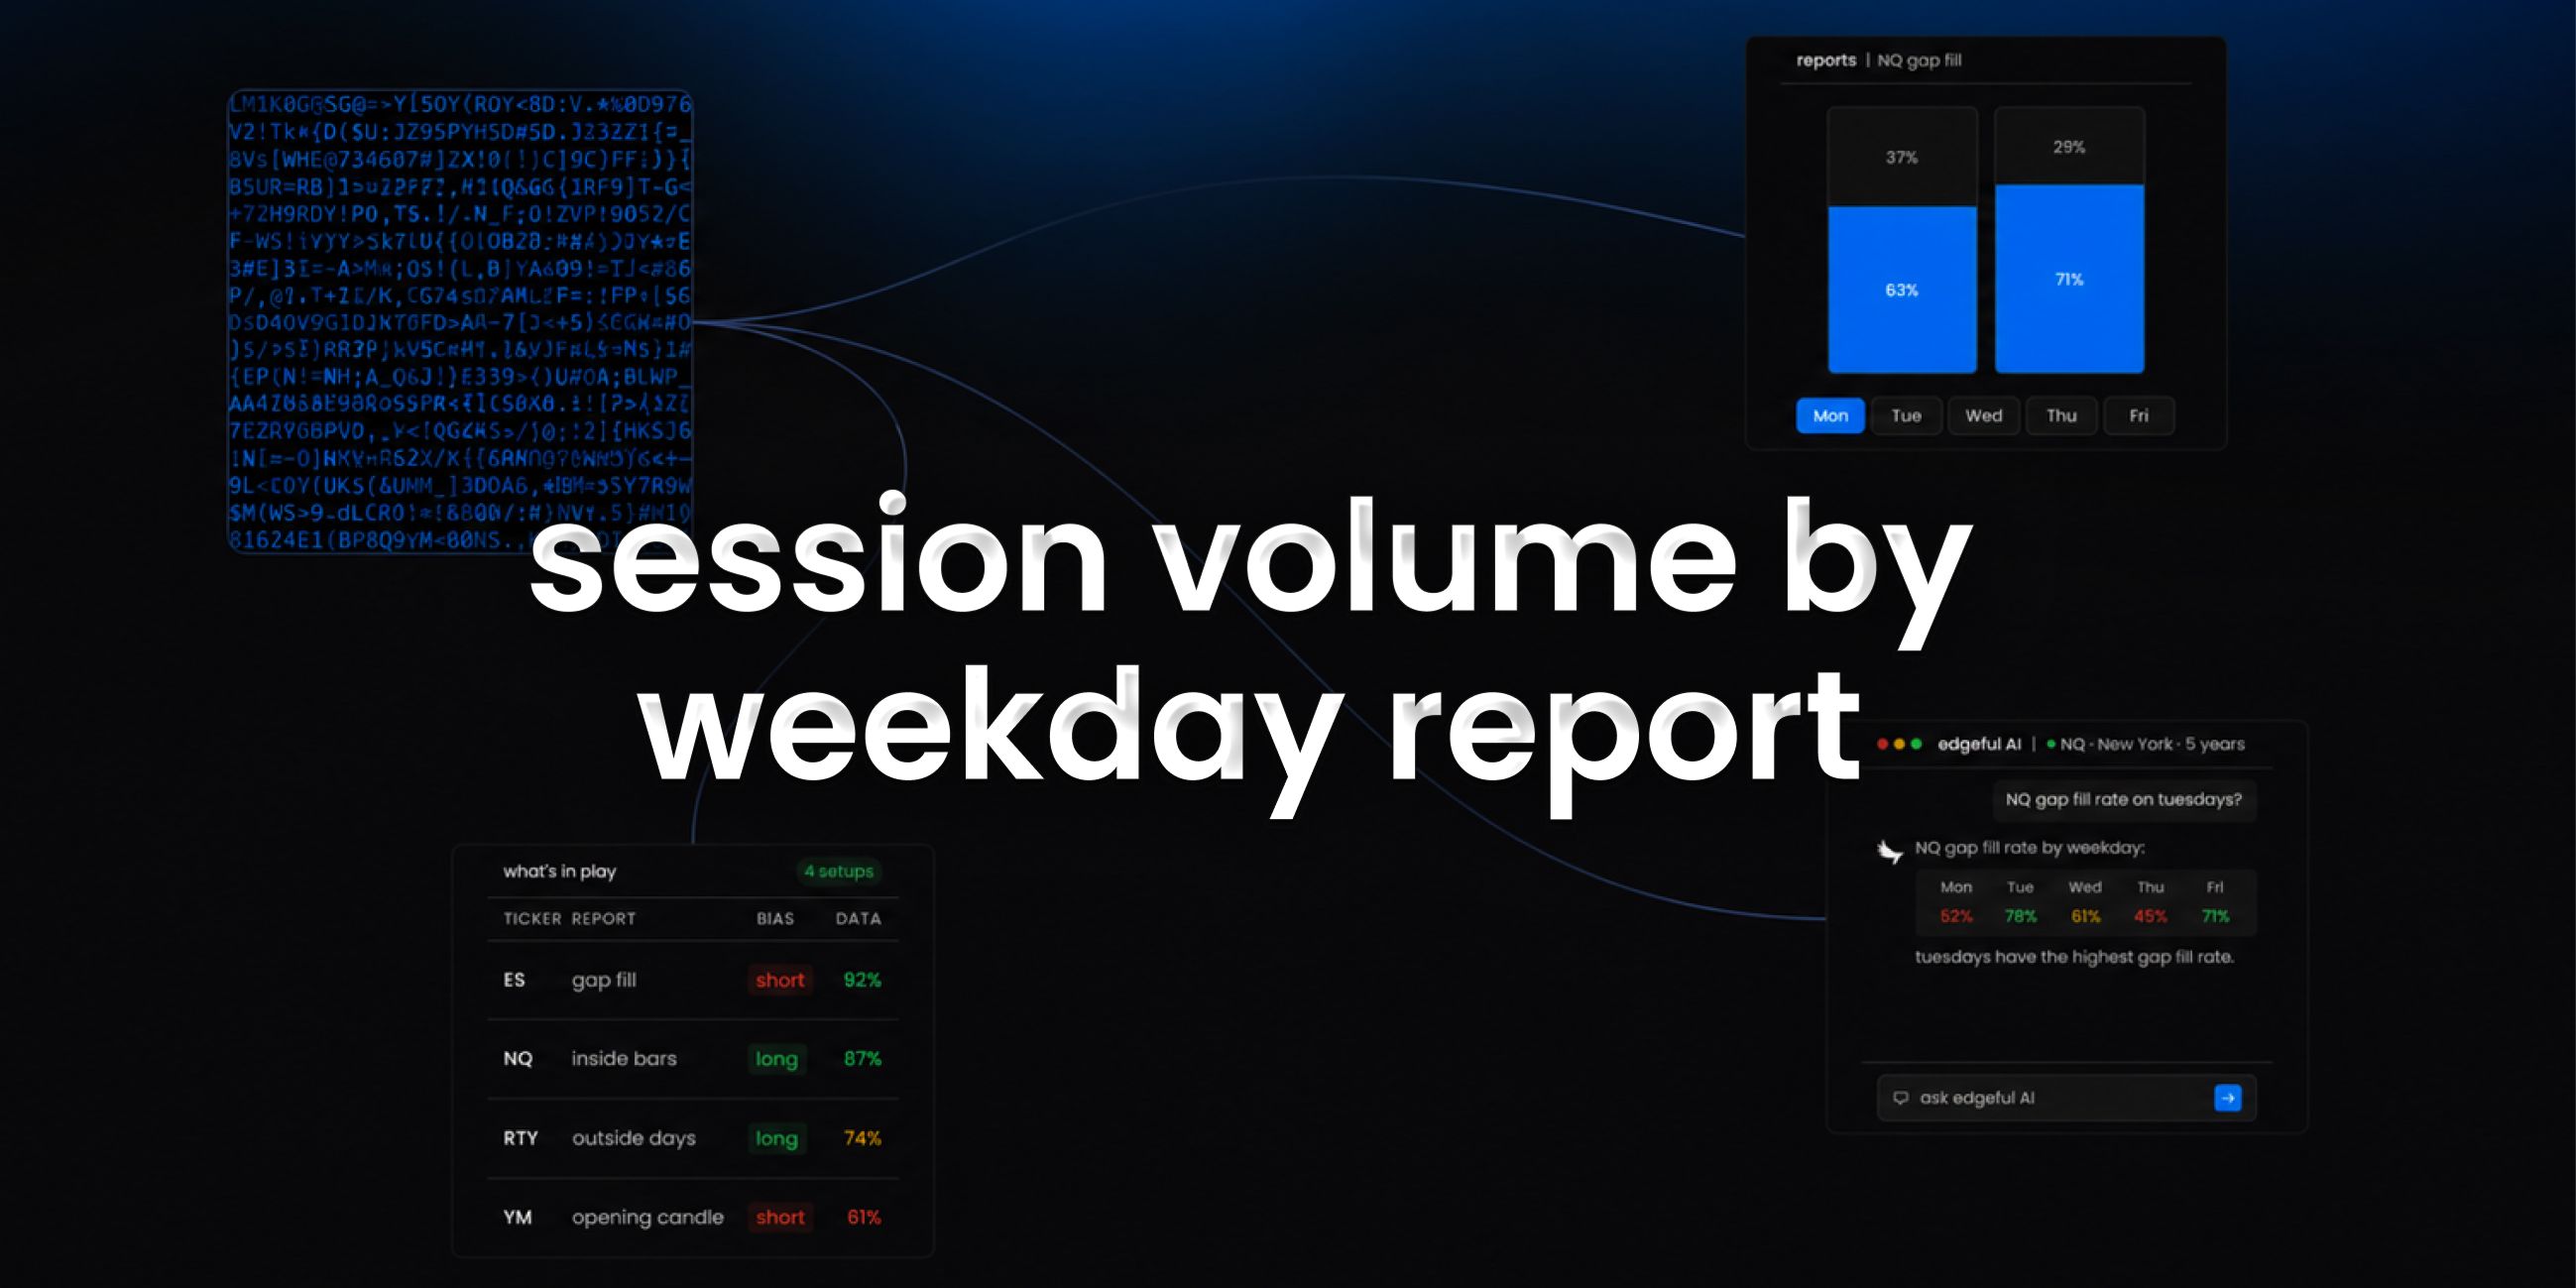
you get volume by session and by day of the week, so you can see when activity tends to concentrate.
this is one of the 150+ reports available on the edgeful platform. here's how it works, what the data shows, and how traders use it.
table of contents
- what the session volume by weekday report measures
- how the calculation works
- how traders use session volume by weekday data
- combining session volume by weekday with other reports
- key takeaways
what the session volume by weekday report measures
the session volume by weekday report calculates average trading volume for the Tokyo, London, and New York sessions grouped by weekday. it creates summary statistics with mean volumes per weekday and detailed daily volume records.
the report is available for futures, stocks, ETFs, forex, and crypto. you can filter by ticker, session (NY, London, Asian, full globex, or custom), and lookback period (1 month to 5+ years).
how the calculation works
the session volume by weekday report aggregates traded volume by weekday.
- the report sums total session volume for each session day across the lookback period
- it groups results by weekday (monday through friday)
- averages are calculated per weekday
- comparing weekdays reveals which days have the most participation
- this gives you a statistical view of which weekdays attract the most activity on a given ticker
how traders use session volume by weekday data
- focusing on weekdays with historically higher volume for cleaner trends
- reducing size on historically lower-volume weekdays
- pairing with session range by weekday for full participation context
- ticker-specific calibration since patterns differ heavily by instrument
- risk management by knowing when low-volume chop is statistically more likely
the data doesn't tell you to trade. the session volume by weekday report tells you the historical performance of the setup in front of you. what you do with that information is your decision.
results require customization, time, and effort. the numbers change depending on your ticker, session, and lookback period. always check the data for your specific conditions.
combining session volume by weekday with other reports
the session volume by weekday report works best when combined with other edgeful reports for confluence:
- use the what's in play dashboard to see session volume by weekday data alongside your other favorite reports in one view
- the screener lets you scan up to 49 tickers for session volume by weekday setups across 4 reports simultaneously
- edgeful AI can analyze session volume by weekday data alongside other reports and find patterns you'd never spot manually
key takeaways
- the edgeful session volume by weekday report measures average session volume broken out by weekday
- available for futures, stocks, ETFs, forex, and crypto with full session, ticker, and date range filtering
- pairs naturally with session range by weekday for participation context
- part of the 150+ reports included in the edgeful essential plan ($49/month or $39/month annual)
- works best when combined with other reports using what's in play, the screener, or edgeful AI
trading involves risk. past performance and historical data do not guarantee future results. the statistics referenced in this post are based on historical data and may not reflect future market conditions. always trade with proper risk management.